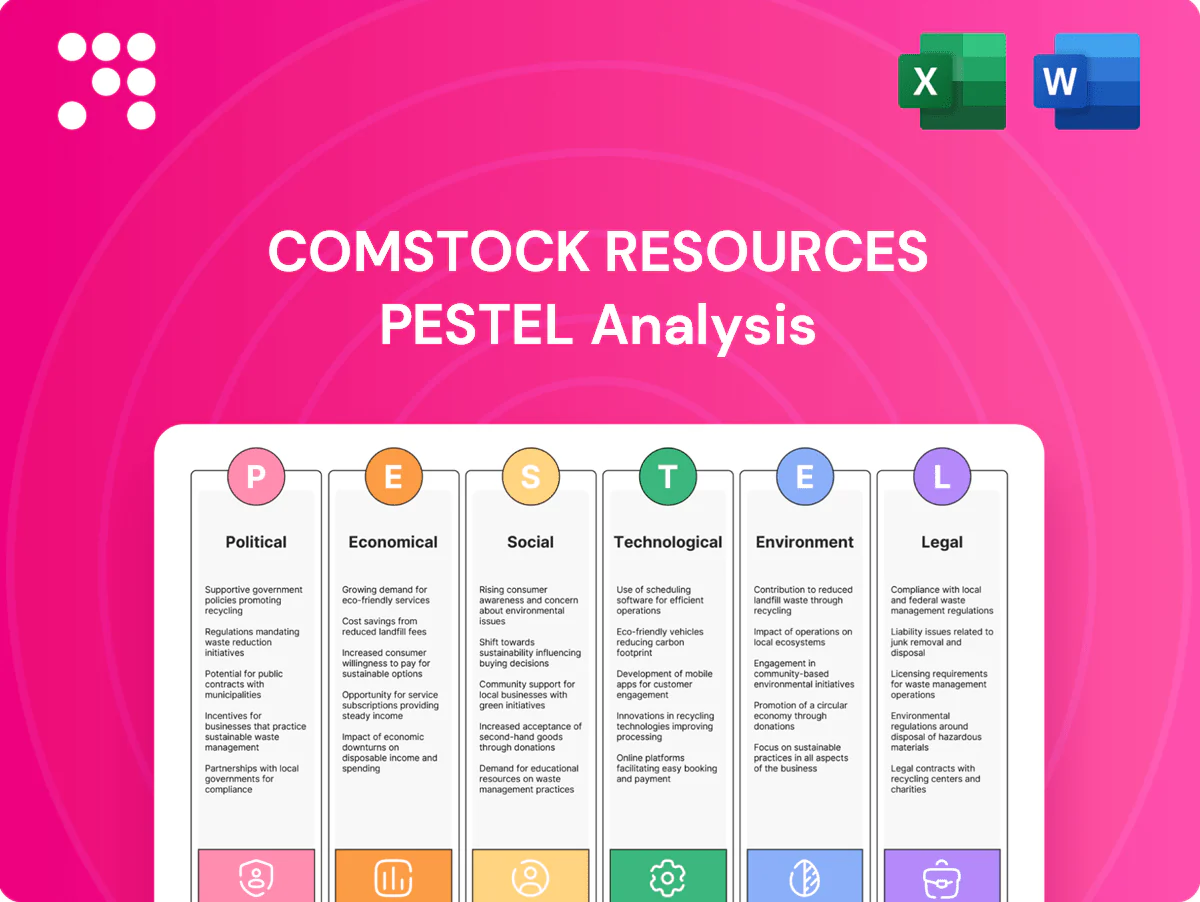
Comstock Resources PESTLE Analysis

Your Competitive Advantage Starts with This Report
Gain a strategic edge with our focused PESTLE Analysis of Comstock Resources—revealing how political, economic, social, technological, legal and environmental forces will shape its prospects. Ideal for investors, analysts and strategists seeking timely, actionable insights to inform decisions. Purchase the full report now for the complete, downloadable breakdown and ready-to-use intelligence.
Political factors

Federal energy policy and LNG export stance
Federal stances on LNG permitting and DOE/FERC approvals directly shape long-term demand and price realization for Haynesville gas, which produces roughly 11 Bcf/d into Gulf Coast markets; US LNG exports reached about 13 Bcf/d in 2023–24, tying regional takeaway to export project timing. Policy acceleration supports Gulf export capacity and stable pricing, while moratoria or stricter criteria could defer investment and compress takeaway value—heightening Comstock’s Gulf-proximate exposure.
State-level regulation in Louisiana and Texas
Texas Railroad Commission and Louisiana Department of Natural Resources enforce different rules on drilling cadence, flaring and reporting, driving varied operational timing and compliance costs for Comstock in the Haynesville.
Streamlined Texas permitting enables continuous development of dense Haynesville pads, while Louisiana requirements and potential sudden tightening on completions or disposal wells could materially raise unit costs.
Local parish and county ordinances in both states add coordination complexities and permit timeline variability that can delay wells and increase administrative expense.

Tax and severance policy dynamics
Adjustments to severance taxes, ad valorem rates, or incentives directly swing project economics; temporary tax relief for new wells or high-cost gas can boost IRRs materially, while hikes compress margins. Texas and Louisiana compete for drilling capital—Texas crude production was about 5.6 million b/d in 2023 (EIA) and Louisiana remains a major gas hub (~7.0 Bcf/d), influencing policy levers. State budget pressures can prompt cyclical tax changes that alter well-level returns.

Infrastructure and pipeline approvals
FERC and state siting decisions dictate timing of new pipelines and compression that evacuate Anadarko Basin gas, and heightened political scrutiny on interstate projects since 2022–24 has slowed capacity additions. Such delays have historically widened basis differentials by roughly $3–7/MMBtu, directly lowering Comstock Resources realized prices; favorable rulings restore market access and reliability.
- Regulatory gatekeeping: FERC/state timing
- Political risk: slower interstate approvals
- Price impact: basis swings ~$3–7/MMBtu
- Upside: favorable rulings improve access
Trade and geopolitical gas demand
Global events driving higher LNG demand in Europe and Asia continue to shape Gulf Coast offtake; US export capacity reached about 13.5 Bcf/d by 2024, tightening regional flows and supporting higher wellhead activity. US trade posture and sanctions can rapidly reroute cargoes and lift domestic prices, while sustained allied demand underpins drilling; détente or oversupply would pressure realizations. Comstock’s Gulf Coast proximity makes it a direct beneficiary of export tightness or a casualty if exports ease.
- Export capacity: ~13.5 Bcf/d (2024)
- Higher European/Asian LNG demand → increased Gulf offtake
- Sanctions/trade policy can redirect flows, impacting pricing
- Allied demand sustains drilling; détente/oversupply eases prices
- Comstock exposure: beneficiary or casualty based on swings
Federal LNG permitting delays tighten Haynesville flows, widen basis by $3-7/MMBtu
Federal LNG permitting, DOE/FERC timing and export policy (US ~13.5 Bcf/d LNG capacity in 2024) directly set Haynesville demand and realized prices (~11 Bcf/d Haynesville flow); interstate siting delays have widened basis differentials ~$3–7/MMBtu, squeezing Comstock margins. State rules and tax changes in TX/LA alter drilling cadence and unit economics. Local ordinances add permit timing risk.
| Metric | Value |
|---|---|
| US LNG capacity (2024) | ~13.5 Bcf/d |
| Haynesville Gulf flow | ~11 Bcf/d |
| Basis impact from delays | $3–7/MMBtu |
What is included in the product
 Detailed Word Document
Explores how macro-environmental factors uniquely affect Comstock Resources across Political, Economic, Social, Technological, Environmental, and Legal dimensions, with data-backed trends and region-specific industry context. Designed for executives, advisors, and investors to identify risks, opportunities, and forward-looking scenarios ready for insertion into plans or reports.

 Customizable Excel Spreadsheet
A compact, visually segmented PESTLE summary for Comstock Resources that clarifies regulatory, market and environmental risks, easing inclusion in presentations or strategy sessions for quick team alignment.
Economic factors

Natural gas price volatility (Henry Hub and basis)
Comstock cash flows are tied to Henry Hub (around $3/MMBtu YTD 2025) and regional East Texas/North Louisiana basis; U.S. working gas inventories near 2.9 Tcf mid‑2025, while weather and rising LNG feedgas demand have driven price swings. Tight pipeline takeaway has widened negative basis (often several tenths $/MMBtu), cutting realizations. Active hedging programs can smooth but not eliminate this exposure.
Service costs and inflation
Pressure pumping, proppant, diesel and labor swings materially move Comstock well costs: industry CPI inflation peaked at 9.1% (June 2022) and diesel hit about 5.79 USD/gal (Oct 2022), expanding AFE line-items and raising breakevens. Efficiency gains and multi-well pad development have offset a portion of inflation-driven cost increases, while downturns historically reset service pricing lower.

Capital availability and interest rates
Higher interest rates (policy rates near 5.25–5.50% in 2024–25) raise Comstock Resources’ debt service and increase hurdle rates for drilling programs, compressing project NPV. Equity appetite for gas E&Ps swings with commodity cycles and ESG sentiment, constraining capital during price downturns. Strong balance sheets — low net leverage — give flexibility while high leverage limits activity. Joint ventures or farm‑outs remain common to share risk and capital.

LNG buildout and Gulf Coast industrial demand
Gulf Coast LNG buildout (US export capacity ~12.6 Bcf/d by mid-2024) and petrochemical expansions are expected to absorb incremental Haynesville volumes, creating step-change demand when new trains commission on schedule; slippages delay the expected price uplift while on-time ramps tighten regional markets. Comstock’s proximity to pipeline takeaways enhances optionality to secure premium LNG and industrial contracts.
- US LNG capacity ~12.6 Bcf/d (mid-2024)
- Commissioning = step-change demand; slippage delays price recovery
- On-time ramps = tighter Gulf markets, upward price pressure
- Comstock proximity = access to premium offtakes
Land, royalty, and lease economics
Royalty burdens (around 18–20% in Comstock's Haynesville footprint in 2024) and lease operating expenses (commonly $2–4/BOE in 2024 benchmarks) materially cut netbacks; tighter margins lower reinvestment capacity. High-quality contiguous acreage supports longer laterals, improving capital efficiency and lowering per‑well break‑evens. Held‑by‑production clauses cut lease renewal risk and re‑leasing costs, while competitive leasing in core blocks can drive bonus and royalty bids higher.
- royalty burden: 18–20% (2024 Haynesville benchmark)
- LOE: $2–4/BOE (2024 industry range)
- contiguous acreage: longer laterals → lower $/BOE capex
- held-by-production: reduces leasing churn and costs
Federal LNG permitting delays tighten Haynesville flows, widen basis by $3-7/MMBtu
Comstock cash flows remain exposed to Henry Hub (~3 USD/MMBtu YTD 2025) and regional negative basis from East Texas takeaway constraints; hedges mitigate but do not eliminate volatility. Inflation in service costs and diesel elevated breakevens, partially offset by pad efficiencies. Higher policy rates (≈5.25–5.50% in 2024–25) raise financing costs and tighten activity unless balance sheet leverage is low.
| Metric | Value |
|---|---|
| Henry Hub | ~3 USD/MMBtu (YTD 2025) |
| US LNG capacity | ~12.6 Bcf/d (mid-2024) |
| Working gas | ~2.9 Tcf (mid-2025) |
| Royalty / LOE | 18–20% / 2–4 USD/BOE (2024) |
| Policy rate | ≈5.25–5.50% (2024–25) |
What You See Is What You Get
Comstock Resources PESTLE Analysis
The Comstock Resources PESTLE Analysis provides a concise review of political, economic, social, technological, legal, and environmental factors affecting the company, with actionable insights for investors and strategists. The preview shown here is the exact document you’ll receive after purchase—fully formatted and ready to use. Use it immediately for decision-making or reporting.

Your Competitive Advantage Starts with This Report
Gain a strategic edge with our focused PESTLE Analysis of Comstock Resources—revealing how political, economic, social, technological, legal and environmental forces will shape its prospects. Ideal for investors, analysts and strategists seeking timely, actionable insights to inform decisions. Purchase the full report now for the complete, downloadable breakdown and ready-to-use intelligence.
Political factors
Federal energy policy and LNG export stance
Federal stances on LNG permitting and DOE/FERC approvals directly shape long-term demand and price realization for Haynesville gas, which produces roughly 11 Bcf/d into Gulf Coast markets; US LNG exports reached about 13 Bcf/d in 2023–24, tying regional takeaway to export project timing. Policy acceleration supports Gulf export capacity and stable pricing, while moratoria or stricter criteria could defer investment and compress takeaway value—heightening Comstock’s Gulf-proximate exposure.
State-level regulation in Louisiana and Texas
Texas Railroad Commission and Louisiana Department of Natural Resources enforce different rules on drilling cadence, flaring and reporting, driving varied operational timing and compliance costs for Comstock in the Haynesville.
Streamlined Texas permitting enables continuous development of dense Haynesville pads, while Louisiana requirements and potential sudden tightening on completions or disposal wells could materially raise unit costs.
Local parish and county ordinances in both states add coordination complexities and permit timeline variability that can delay wells and increase administrative expense.
Tax and severance policy dynamics
Adjustments to severance taxes, ad valorem rates, or incentives directly swing project economics; temporary tax relief for new wells or high-cost gas can boost IRRs materially, while hikes compress margins. Texas and Louisiana compete for drilling capital—Texas crude production was about 5.6 million b/d in 2023 (EIA) and Louisiana remains a major gas hub (~7.0 Bcf/d), influencing policy levers. State budget pressures can prompt cyclical tax changes that alter well-level returns.
Infrastructure and pipeline approvals
FERC and state siting decisions dictate timing of new pipelines and compression that evacuate Anadarko Basin gas, and heightened political scrutiny on interstate projects since 2022–24 has slowed capacity additions. Such delays have historically widened basis differentials by roughly $3–7/MMBtu, directly lowering Comstock Resources realized prices; favorable rulings restore market access and reliability.
- Regulatory gatekeeping: FERC/state timing
- Political risk: slower interstate approvals
- Price impact: basis swings ~$3–7/MMBtu
- Upside: favorable rulings improve access
Trade and geopolitical gas demand
Global events driving higher LNG demand in Europe and Asia continue to shape Gulf Coast offtake; US export capacity reached about 13.5 Bcf/d by 2024, tightening regional flows and supporting higher wellhead activity. US trade posture and sanctions can rapidly reroute cargoes and lift domestic prices, while sustained allied demand underpins drilling; détente or oversupply would pressure realizations. Comstock’s Gulf Coast proximity makes it a direct beneficiary of export tightness or a casualty if exports ease.
- Export capacity: ~13.5 Bcf/d (2024)
- Higher European/Asian LNG demand → increased Gulf offtake
- Sanctions/trade policy can redirect flows, impacting pricing
- Allied demand sustains drilling; détente/oversupply eases prices
- Comstock exposure: beneficiary or casualty based on swings
Federal LNG permitting delays tighten Haynesville flows, widen basis by $3-7/MMBtu
Federal LNG permitting, DOE/FERC timing and export policy (US ~13.5 Bcf/d LNG capacity in 2024) directly set Haynesville demand and realized prices (~11 Bcf/d Haynesville flow); interstate siting delays have widened basis differentials ~$3–7/MMBtu, squeezing Comstock margins. State rules and tax changes in TX/LA alter drilling cadence and unit economics. Local ordinances add permit timing risk.
| Metric | Value |
|---|---|
| US LNG capacity (2024) | ~13.5 Bcf/d |
| Haynesville Gulf flow | ~11 Bcf/d |
| Basis impact from delays | $3–7/MMBtu |
What is included in the product
Detailed Word Document
Explores how macro-environmental factors uniquely affect Comstock Resources across Political, Economic, Social, Technological, Environmental, and Legal dimensions, with data-backed trends and region-specific industry context. Designed for executives, advisors, and investors to identify risks, opportunities, and forward-looking scenarios ready for insertion into plans or reports.
Customizable Excel Spreadsheet
A compact, visually segmented PESTLE summary for Comstock Resources that clarifies regulatory, market and environmental risks, easing inclusion in presentations or strategy sessions for quick team alignment.
Economic factors
Natural gas price volatility (Henry Hub and basis)
Comstock cash flows are tied to Henry Hub (around $3/MMBtu YTD 2025) and regional East Texas/North Louisiana basis; U.S. working gas inventories near 2.9 Tcf mid‑2025, while weather and rising LNG feedgas demand have driven price swings. Tight pipeline takeaway has widened negative basis (often several tenths $/MMBtu), cutting realizations. Active hedging programs can smooth but not eliminate this exposure.
Service costs and inflation
Pressure pumping, proppant, diesel and labor swings materially move Comstock well costs: industry CPI inflation peaked at 9.1% (June 2022) and diesel hit about 5.79 USD/gal (Oct 2022), expanding AFE line-items and raising breakevens. Efficiency gains and multi-well pad development have offset a portion of inflation-driven cost increases, while downturns historically reset service pricing lower.
Capital availability and interest rates
Higher interest rates (policy rates near 5.25–5.50% in 2024–25) raise Comstock Resources’ debt service and increase hurdle rates for drilling programs, compressing project NPV. Equity appetite for gas E&Ps swings with commodity cycles and ESG sentiment, constraining capital during price downturns. Strong balance sheets — low net leverage — give flexibility while high leverage limits activity. Joint ventures or farm‑outs remain common to share risk and capital.
LNG buildout and Gulf Coast industrial demand
Gulf Coast LNG buildout (US export capacity ~12.6 Bcf/d by mid-2024) and petrochemical expansions are expected to absorb incremental Haynesville volumes, creating step-change demand when new trains commission on schedule; slippages delay the expected price uplift while on-time ramps tighten regional markets. Comstock’s proximity to pipeline takeaways enhances optionality to secure premium LNG and industrial contracts.
- US LNG capacity ~12.6 Bcf/d (mid-2024)
- Commissioning = step-change demand; slippage delays price recovery
- On-time ramps = tighter Gulf markets, upward price pressure
- Comstock proximity = access to premium offtakes
Land, royalty, and lease economics
Royalty burdens (around 18–20% in Comstock's Haynesville footprint in 2024) and lease operating expenses (commonly $2–4/BOE in 2024 benchmarks) materially cut netbacks; tighter margins lower reinvestment capacity. High-quality contiguous acreage supports longer laterals, improving capital efficiency and lowering per‑well break‑evens. Held‑by‑production clauses cut lease renewal risk and re‑leasing costs, while competitive leasing in core blocks can drive bonus and royalty bids higher.
- royalty burden: 18–20% (2024 Haynesville benchmark)
- LOE: $2–4/BOE (2024 industry range)
- contiguous acreage: longer laterals → lower $/BOE capex
- held-by-production: reduces leasing churn and costs
Federal LNG permitting delays tighten Haynesville flows, widen basis by $3-7/MMBtu
Comstock cash flows remain exposed to Henry Hub (~3 USD/MMBtu YTD 2025) and regional negative basis from East Texas takeaway constraints; hedges mitigate but do not eliminate volatility. Inflation in service costs and diesel elevated breakevens, partially offset by pad efficiencies. Higher policy rates (≈5.25–5.50% in 2024–25) raise financing costs and tighten activity unless balance sheet leverage is low.
| Metric | Value |
|---|---|
| Henry Hub | ~3 USD/MMBtu (YTD 2025) |
| US LNG capacity | ~12.6 Bcf/d (mid-2024) |
| Working gas | ~2.9 Tcf (mid-2025) |
| Royalty / LOE | 18–20% / 2–4 USD/BOE (2024) |
| Policy rate | ≈5.25–5.50% (2024–25) |
What You See Is What You Get
Comstock Resources PESTLE Analysis
The Comstock Resources PESTLE Analysis provides a concise review of political, economic, social, technological, legal, and environmental factors affecting the company, with actionable insights for investors and strategists. The preview shown here is the exact document you’ll receive after purchase—fully formatted and ready to use. Use it immediately for decision-making or reporting.
Description
Your Competitive Advantage Starts with This Report
Gain a strategic edge with our focused PESTLE Analysis of Comstock Resources—revealing how political, economic, social, technological, legal and environmental forces will shape its prospects. Ideal for investors, analysts and strategists seeking timely, actionable insights to inform decisions. Purchase the full report now for the complete, downloadable breakdown and ready-to-use intelligence.
Political factors
Federal energy policy and LNG export stance
Federal stances on LNG permitting and DOE/FERC approvals directly shape long-term demand and price realization for Haynesville gas, which produces roughly 11 Bcf/d into Gulf Coast markets; US LNG exports reached about 13 Bcf/d in 2023–24, tying regional takeaway to export project timing. Policy acceleration supports Gulf export capacity and stable pricing, while moratoria or stricter criteria could defer investment and compress takeaway value—heightening Comstock’s Gulf-proximate exposure.
State-level regulation in Louisiana and Texas
Texas Railroad Commission and Louisiana Department of Natural Resources enforce different rules on drilling cadence, flaring and reporting, driving varied operational timing and compliance costs for Comstock in the Haynesville.
Streamlined Texas permitting enables continuous development of dense Haynesville pads, while Louisiana requirements and potential sudden tightening on completions or disposal wells could materially raise unit costs.
Local parish and county ordinances in both states add coordination complexities and permit timeline variability that can delay wells and increase administrative expense.
Tax and severance policy dynamics
Adjustments to severance taxes, ad valorem rates, or incentives directly swing project economics; temporary tax relief for new wells or high-cost gas can boost IRRs materially, while hikes compress margins. Texas and Louisiana compete for drilling capital—Texas crude production was about 5.6 million b/d in 2023 (EIA) and Louisiana remains a major gas hub (~7.0 Bcf/d), influencing policy levers. State budget pressures can prompt cyclical tax changes that alter well-level returns.
Infrastructure and pipeline approvals
FERC and state siting decisions dictate timing of new pipelines and compression that evacuate Anadarko Basin gas, and heightened political scrutiny on interstate projects since 2022–24 has slowed capacity additions. Such delays have historically widened basis differentials by roughly $3–7/MMBtu, directly lowering Comstock Resources realized prices; favorable rulings restore market access and reliability.
- Regulatory gatekeeping: FERC/state timing
- Political risk: slower interstate approvals
- Price impact: basis swings ~$3–7/MMBtu
- Upside: favorable rulings improve access
Trade and geopolitical gas demand
Global events driving higher LNG demand in Europe and Asia continue to shape Gulf Coast offtake; US export capacity reached about 13.5 Bcf/d by 2024, tightening regional flows and supporting higher wellhead activity. US trade posture and sanctions can rapidly reroute cargoes and lift domestic prices, while sustained allied demand underpins drilling; détente or oversupply would pressure realizations. Comstock’s Gulf Coast proximity makes it a direct beneficiary of export tightness or a casualty if exports ease.
- Export capacity: ~13.5 Bcf/d (2024)
- Higher European/Asian LNG demand → increased Gulf offtake
- Sanctions/trade policy can redirect flows, impacting pricing
- Allied demand sustains drilling; détente/oversupply eases prices
- Comstock exposure: beneficiary or casualty based on swings
Federal LNG permitting delays tighten Haynesville flows, widen basis by $3-7/MMBtu
Federal LNG permitting, DOE/FERC timing and export policy (US ~13.5 Bcf/d LNG capacity in 2024) directly set Haynesville demand and realized prices (~11 Bcf/d Haynesville flow); interstate siting delays have widened basis differentials ~$3–7/MMBtu, squeezing Comstock margins. State rules and tax changes in TX/LA alter drilling cadence and unit economics. Local ordinances add permit timing risk.
| Metric | Value |
|---|---|
| US LNG capacity (2024) | ~13.5 Bcf/d |
| Haynesville Gulf flow | ~11 Bcf/d |
| Basis impact from delays | $3–7/MMBtu |
What is included in the product
Detailed Word Document
Explores how macro-environmental factors uniquely affect Comstock Resources across Political, Economic, Social, Technological, Environmental, and Legal dimensions, with data-backed trends and region-specific industry context. Designed for executives, advisors, and investors to identify risks, opportunities, and forward-looking scenarios ready for insertion into plans or reports.
Customizable Excel Spreadsheet
A compact, visually segmented PESTLE summary for Comstock Resources that clarifies regulatory, market and environmental risks, easing inclusion in presentations or strategy sessions for quick team alignment.
Economic factors
Natural gas price volatility (Henry Hub and basis)
Comstock cash flows are tied to Henry Hub (around $3/MMBtu YTD 2025) and regional East Texas/North Louisiana basis; U.S. working gas inventories near 2.9 Tcf mid‑2025, while weather and rising LNG feedgas demand have driven price swings. Tight pipeline takeaway has widened negative basis (often several tenths $/MMBtu), cutting realizations. Active hedging programs can smooth but not eliminate this exposure.
Service costs and inflation
Pressure pumping, proppant, diesel and labor swings materially move Comstock well costs: industry CPI inflation peaked at 9.1% (June 2022) and diesel hit about 5.79 USD/gal (Oct 2022), expanding AFE line-items and raising breakevens. Efficiency gains and multi-well pad development have offset a portion of inflation-driven cost increases, while downturns historically reset service pricing lower.
Capital availability and interest rates
Higher interest rates (policy rates near 5.25–5.50% in 2024–25) raise Comstock Resources’ debt service and increase hurdle rates for drilling programs, compressing project NPV. Equity appetite for gas E&Ps swings with commodity cycles and ESG sentiment, constraining capital during price downturns. Strong balance sheets — low net leverage — give flexibility while high leverage limits activity. Joint ventures or farm‑outs remain common to share risk and capital.
LNG buildout and Gulf Coast industrial demand
Gulf Coast LNG buildout (US export capacity ~12.6 Bcf/d by mid-2024) and petrochemical expansions are expected to absorb incremental Haynesville volumes, creating step-change demand when new trains commission on schedule; slippages delay the expected price uplift while on-time ramps tighten regional markets. Comstock’s proximity to pipeline takeaways enhances optionality to secure premium LNG and industrial contracts.
- US LNG capacity ~12.6 Bcf/d (mid-2024)
- Commissioning = step-change demand; slippage delays price recovery
- On-time ramps = tighter Gulf markets, upward price pressure
- Comstock proximity = access to premium offtakes
Land, royalty, and lease economics
Royalty burdens (around 18–20% in Comstock's Haynesville footprint in 2024) and lease operating expenses (commonly $2–4/BOE in 2024 benchmarks) materially cut netbacks; tighter margins lower reinvestment capacity. High-quality contiguous acreage supports longer laterals, improving capital efficiency and lowering per‑well break‑evens. Held‑by‑production clauses cut lease renewal risk and re‑leasing costs, while competitive leasing in core blocks can drive bonus and royalty bids higher.
- royalty burden: 18–20% (2024 Haynesville benchmark)
- LOE: $2–4/BOE (2024 industry range)
- contiguous acreage: longer laterals → lower $/BOE capex
- held-by-production: reduces leasing churn and costs
Federal LNG permitting delays tighten Haynesville flows, widen basis by $3-7/MMBtu
Comstock cash flows remain exposed to Henry Hub (~3 USD/MMBtu YTD 2025) and regional negative basis from East Texas takeaway constraints; hedges mitigate but do not eliminate volatility. Inflation in service costs and diesel elevated breakevens, partially offset by pad efficiencies. Higher policy rates (≈5.25–5.50% in 2024–25) raise financing costs and tighten activity unless balance sheet leverage is low.
| Metric | Value |
|---|---|
| Henry Hub | ~3 USD/MMBtu (YTD 2025) |
| US LNG capacity | ~12.6 Bcf/d (mid-2024) |
| Working gas | ~2.9 Tcf (mid-2025) |
| Royalty / LOE | 18–20% / 2–4 USD/BOE (2024) |
| Policy rate | ≈5.25–5.50% (2024–25) |
What You See Is What You Get
Comstock Resources PESTLE Analysis
The Comstock Resources PESTLE Analysis provides a concise review of political, economic, social, technological, legal, and environmental factors affecting the company, with actionable insights for investors and strategists. The preview shown here is the exact document you’ll receive after purchase—fully formatted and ready to use. Use it immediately for decision-making or reporting.











