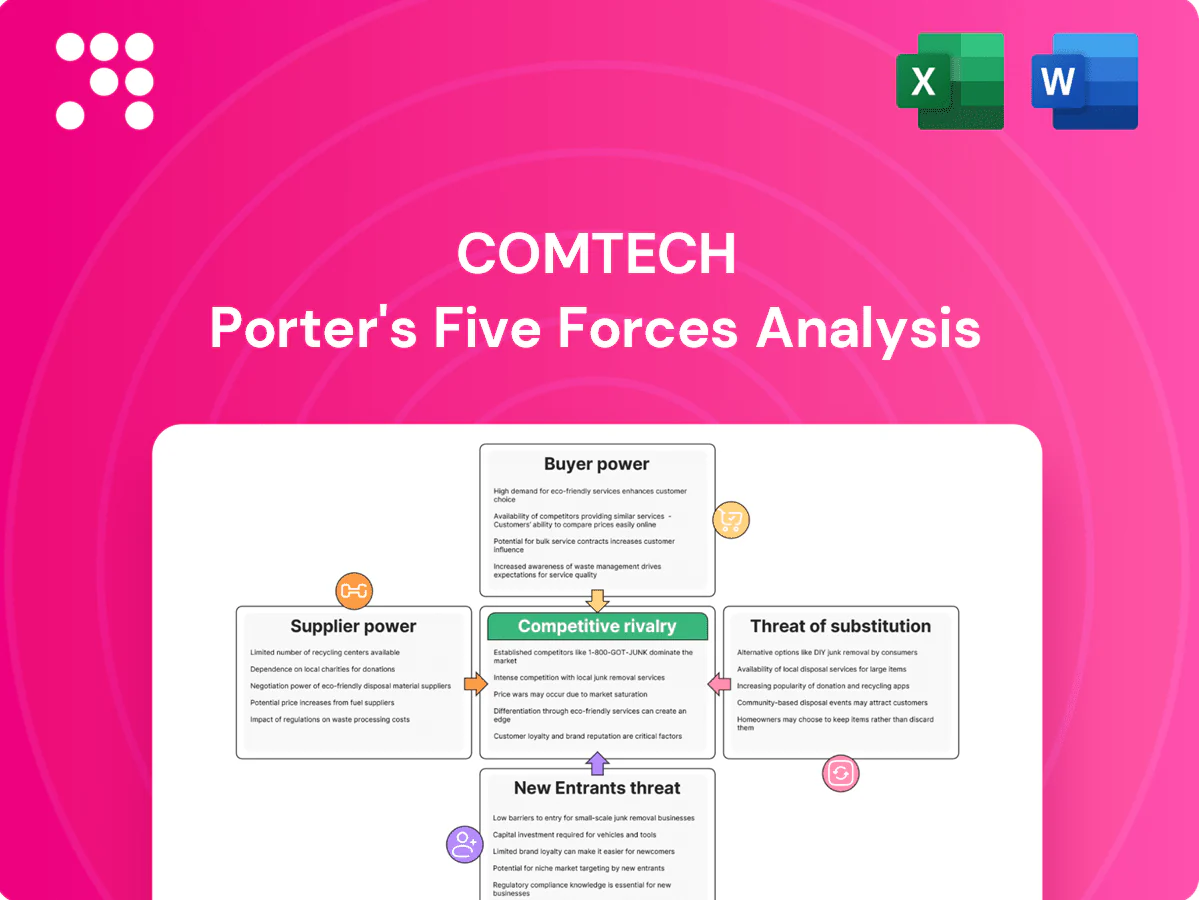
Comtech Porter's Five Forces Analysis

Don't Miss the Bigger Picture
This brief snapshot highlights Comtech’s competitive pressures and strategic levers but only scratches the surface. Unlock the full Porter's Five Forces Analysis to see force-by-force ratings, visuals, and clear business implications. Gain actionable insights on supplier power, buyer dynamics, substitutes, new entrants, and rivalry. Purchase the complete report for a consultant-grade roadmap to inform investment and strategy decisions.
Suppliers Bargaining Power

Specialized RF and satellite component concentration
Critical RF semiconductors, high-reliability oscillators and antennas come from a limited set of qualified vendors, driving switching costs and lead times often reaching 26–52 weeks; long qualification cycles (commonly 12–24 months) and stringent performance specs give suppliers pricing and delivery leverage over Comtech. Dual-sourcing mitigates risk but is frequently infeasible for mission-critical, space-qualified parts.
Software stacks and secure firmware dependencies
Security-certified OS, encryption modules and middleware (FIPS 140-3, NIAP Common Criteria) are supplied by niche vendors, narrowing substitute options and increasing supplier power. Compliance-driven lock-in reduces interchangeability and forces longer validation cycles. Patch cadence and support SLAs directly affect Comtech product roadmaps, while 3–5 year volume and maintenance commitments materially improve negotiation leverage.

Satellite capacity and teleport services
Leased satellite capacity and teleport access can be bottlenecks in specific regions, with gateway scarcity driving price spikes observed to exceed 30% during geopolitical crises. Long-term IRUs of 5–15 years reduce pricing volatility but lock Comtech into fixed capacity costs. Deep operator relationships and SLAs mitigate acute surges in demand or conflict-driven disruptions.

Cloud/edge infrastructure and APIs
NG911 and LBS increasingly run on hyperscaler infrastructure and APIs; in 2024 AWS, Azure and GCP held ~32%, 22% and 11% market share respectively, concentrating supplier power. Data egress, sovereignty and integration create switching frictions; reserved instances/committed spend (savings up to ~60%) lower unit costs but deepen dependence. Contract SLAs and compliance add-on fees compress margins.
- Market concentration: AWS 32% / Azure 22% / GCP 11% (2024)
- Egress/sovereignty = switching friction
- Reserved/commitment → up to ~60% savings, ↑ dependence
- SLA/compliance fees pressure margins
Regulatory testing and certification vendors
Third-party labs and certification bodies are required for public-safety and defense-grade solutions, giving them timing power due to limited accredited test houses; certification timelines commonly range from 3–12 months and failures can trigger redesigns that may add 10–25% to development costs and schedules.
- Scheduling constraints: limited accredited slots
- Specialized know-how: accreditation barriers
- Failed tests: 10–25% added cost
- Preferred labs: preserve velocity
RF bottlenecks: 26–52 wk lead times, 65% hyperscaler lock
Critical RF semiconductors, oscillators and antennas are concentrated among few qualified vendors with lead times 26–52 weeks and qualification 12–24 months, giving suppliers price/delivery leverage. Hyperscalers (AWS 32%/Azure 22%/GCP 11% in 2024) and leased satellite IRUs (5–15 yr) create switching friction and locked costs.
| Supplier | Metric (2024) | Impact |
|---|---|---|
| RF components | Lead 26–52 wk | High switching cost |
| Hyperscalers | AWS32%/AZ22%/GCP11% | Dependence, egress fees |
| Satellite IRU | 5–15 yr | Locked capacity cost |
What is included in the product
 Detailed Word Document
Tailored Porter’s Five Forces analysis for Comtech that uncovers competitive drivers, buyer and supplier power, substitute threats, and entry barriers shaping pricing and profitability. Includes strategic commentary on disruptive risks and opportunities, presented in an editable format for inclusion in investor materials or strategy decks.

 Customizable Excel Spreadsheet
A concise Comtech Porter's Five Forces one-sheet that visualizes competitive pressure with an editable spider chart—easy to copy into decks, customize for shifting threats, and integrate into broader reports to quickly resolve strategic blind spots.
Customers Bargaining Power

Concentrated government and carrier customers
Defense, public safety agencies and large telecoms are concentrated, sophisticated buyers whose RFP-driven procurement scale forces strong price pressure and strict compliance. They insist on 99.999% SLAs, rigorous security attestations (e.g., FedRAMP/FISMA requirements) and deep customization. Vendor scorecards and multi-year frameworks, commonly 3–5 years, further amplify customer leverage.
High switching costs but competitive alternatives
Integration into mission-critical NG911 and LBS workflows creates high switching costs because systems tie into ESInet and NENA i3 architectures, yet buyers commonly run parallel pilots with rivals to extract better terms. Data portability and interoperability standards such as NENA i3 reduce lock-in over time. Renewal cycles, typically 3–5 years, become pivotal negotiation windows for pricing and SLAs.

Outcome-based and availability-focused SLAs
Buyers demand uptime, latency and resilience guarantees with penalties; 99.95% uptime equals ~22 minutes downtime/month and 99.999% equals ~26 seconds/month, shifting operational and margin risk to Comtech. Demonstrated reliability supports premium pricing and can blunt buyer power. Transparent telemetry and defined incident-response windows reduce disputes and contested credits.

Customization and compliance demands
Public safety and defense buyers demand tailored features and certifications (NIJ, MIL-STD), driving customization that often causes scope creep and gives buyers leverage on schedules and price; GAO data through 2023 show median cost growth in major defense programs near 22%, increasing supplier exposure. Modular architectures and reference designs with reusable components help cap customization costs and speed delivery, aligning with the US FY2024 defense budget of about 858 billion USD.
- Customization increases buyer leverage and program cost
- Scope creep linked to ~22% median cost growth (GAO, through 2023)
- Modular architectures constrain cost and time
- Reference designs and reusable components restore supplier pricing power
Budget cyclicality and funding dependencies
Government appropriations (US FY2024 defense ~858 billion) and carrier capex cycles (US Tier‑1 capex ~45 billion annually) drive timing and volume, so buyers often delay awards or compress pricing near fiscal year‑ends. Multi‑year contracts and managed services smooth revenue but increase repricing risk; offering OpEx models reduces buyer pushback and preserves deal flow.
Concentrated buyers compress price/SLA; mission-critical tech raises 3-5yr switching costs
Concentrated, sophisticated buyers (defense, public safety, large telcos) exert strong price/SLA pressure via RFPs and scorecards, yet mission‑critical integrations raise switching costs. Fiscal/review cycles and 3–5y renewals are key negotiation points; OpEx models and modular designs help restore supplier pricing power.
| Metric | Value |
|---|---|
| SLA | 99.999% |
| Renewal | 3–5 yrs |
| US DEF FY2024 | $858B |
Full Version Awaits
Comtech Porter's Five Forces Analysis
This preview shows the exact Comtech Porter's Five Forces analysis you'll receive immediately after purchase—fully formatted, complete and ready to use. No placeholders or samples are included. Instant download grants access to this same professional document.

Don't Miss the Bigger Picture
This brief snapshot highlights Comtech’s competitive pressures and strategic levers but only scratches the surface. Unlock the full Porter's Five Forces Analysis to see force-by-force ratings, visuals, and clear business implications. Gain actionable insights on supplier power, buyer dynamics, substitutes, new entrants, and rivalry. Purchase the complete report for a consultant-grade roadmap to inform investment and strategy decisions.
Suppliers Bargaining Power
Specialized RF and satellite component concentration
Critical RF semiconductors, high-reliability oscillators and antennas come from a limited set of qualified vendors, driving switching costs and lead times often reaching 26–52 weeks; long qualification cycles (commonly 12–24 months) and stringent performance specs give suppliers pricing and delivery leverage over Comtech. Dual-sourcing mitigates risk but is frequently infeasible for mission-critical, space-qualified parts.
Software stacks and secure firmware dependencies
Security-certified OS, encryption modules and middleware (FIPS 140-3, NIAP Common Criteria) are supplied by niche vendors, narrowing substitute options and increasing supplier power. Compliance-driven lock-in reduces interchangeability and forces longer validation cycles. Patch cadence and support SLAs directly affect Comtech product roadmaps, while 3–5 year volume and maintenance commitments materially improve negotiation leverage.
Satellite capacity and teleport services
Leased satellite capacity and teleport access can be bottlenecks in specific regions, with gateway scarcity driving price spikes observed to exceed 30% during geopolitical crises. Long-term IRUs of 5–15 years reduce pricing volatility but lock Comtech into fixed capacity costs. Deep operator relationships and SLAs mitigate acute surges in demand or conflict-driven disruptions.
Cloud/edge infrastructure and APIs
NG911 and LBS increasingly run on hyperscaler infrastructure and APIs; in 2024 AWS, Azure and GCP held ~32%, 22% and 11% market share respectively, concentrating supplier power. Data egress, sovereignty and integration create switching frictions; reserved instances/committed spend (savings up to ~60%) lower unit costs but deepen dependence. Contract SLAs and compliance add-on fees compress margins.
- Market concentration: AWS 32% / Azure 22% / GCP 11% (2024)
- Egress/sovereignty = switching friction
- Reserved/commitment → up to ~60% savings, ↑ dependence
- SLA/compliance fees pressure margins
Regulatory testing and certification vendors
Third-party labs and certification bodies are required for public-safety and defense-grade solutions, giving them timing power due to limited accredited test houses; certification timelines commonly range from 3–12 months and failures can trigger redesigns that may add 10–25% to development costs and schedules.
- Scheduling constraints: limited accredited slots
- Specialized know-how: accreditation barriers
- Failed tests: 10–25% added cost
- Preferred labs: preserve velocity
RF bottlenecks: 26–52 wk lead times, 65% hyperscaler lock
Critical RF semiconductors, oscillators and antennas are concentrated among few qualified vendors with lead times 26–52 weeks and qualification 12–24 months, giving suppliers price/delivery leverage. Hyperscalers (AWS 32%/Azure 22%/GCP 11% in 2024) and leased satellite IRUs (5–15 yr) create switching friction and locked costs.
| Supplier | Metric (2024) | Impact |
|---|---|---|
| RF components | Lead 26–52 wk | High switching cost |
| Hyperscalers | AWS32%/AZ22%/GCP11% | Dependence, egress fees |
| Satellite IRU | 5–15 yr | Locked capacity cost |
What is included in the product
Detailed Word Document
Tailored Porter’s Five Forces analysis for Comtech that uncovers competitive drivers, buyer and supplier power, substitute threats, and entry barriers shaping pricing and profitability. Includes strategic commentary on disruptive risks and opportunities, presented in an editable format for inclusion in investor materials or strategy decks.
Customizable Excel Spreadsheet
A concise Comtech Porter's Five Forces one-sheet that visualizes competitive pressure with an editable spider chart—easy to copy into decks, customize for shifting threats, and integrate into broader reports to quickly resolve strategic blind spots.
Customers Bargaining Power
Concentrated government and carrier customers
Defense, public safety agencies and large telecoms are concentrated, sophisticated buyers whose RFP-driven procurement scale forces strong price pressure and strict compliance. They insist on 99.999% SLAs, rigorous security attestations (e.g., FedRAMP/FISMA requirements) and deep customization. Vendor scorecards and multi-year frameworks, commonly 3–5 years, further amplify customer leverage.
High switching costs but competitive alternatives
Integration into mission-critical NG911 and LBS workflows creates high switching costs because systems tie into ESInet and NENA i3 architectures, yet buyers commonly run parallel pilots with rivals to extract better terms. Data portability and interoperability standards such as NENA i3 reduce lock-in over time. Renewal cycles, typically 3–5 years, become pivotal negotiation windows for pricing and SLAs.
Outcome-based and availability-focused SLAs
Buyers demand uptime, latency and resilience guarantees with penalties; 99.95% uptime equals ~22 minutes downtime/month and 99.999% equals ~26 seconds/month, shifting operational and margin risk to Comtech. Demonstrated reliability supports premium pricing and can blunt buyer power. Transparent telemetry and defined incident-response windows reduce disputes and contested credits.
Customization and compliance demands
Public safety and defense buyers demand tailored features and certifications (NIJ, MIL-STD), driving customization that often causes scope creep and gives buyers leverage on schedules and price; GAO data through 2023 show median cost growth in major defense programs near 22%, increasing supplier exposure. Modular architectures and reference designs with reusable components help cap customization costs and speed delivery, aligning with the US FY2024 defense budget of about 858 billion USD.
- Customization increases buyer leverage and program cost
- Scope creep linked to ~22% median cost growth (GAO, through 2023)
- Modular architectures constrain cost and time
- Reference designs and reusable components restore supplier pricing power
Budget cyclicality and funding dependencies
Government appropriations (US FY2024 defense ~858 billion) and carrier capex cycles (US Tier‑1 capex ~45 billion annually) drive timing and volume, so buyers often delay awards or compress pricing near fiscal year‑ends. Multi‑year contracts and managed services smooth revenue but increase repricing risk; offering OpEx models reduces buyer pushback and preserves deal flow.
Concentrated buyers compress price/SLA; mission-critical tech raises 3-5yr switching costs
Concentrated, sophisticated buyers (defense, public safety, large telcos) exert strong price/SLA pressure via RFPs and scorecards, yet mission‑critical integrations raise switching costs. Fiscal/review cycles and 3–5y renewals are key negotiation points; OpEx models and modular designs help restore supplier pricing power.
| Metric | Value |
|---|---|
| SLA | 99.999% |
| Renewal | 3–5 yrs |
| US DEF FY2024 | $858B |
Full Version Awaits
Comtech Porter's Five Forces Analysis
This preview shows the exact Comtech Porter's Five Forces analysis you'll receive immediately after purchase—fully formatted, complete and ready to use. No placeholders or samples are included. Instant download grants access to this same professional document.
Original: $10.00
-65%$10.00
$3.50Description
Don't Miss the Bigger Picture
This brief snapshot highlights Comtech’s competitive pressures and strategic levers but only scratches the surface. Unlock the full Porter's Five Forces Analysis to see force-by-force ratings, visuals, and clear business implications. Gain actionable insights on supplier power, buyer dynamics, substitutes, new entrants, and rivalry. Purchase the complete report for a consultant-grade roadmap to inform investment and strategy decisions.
Suppliers Bargaining Power
Specialized RF and satellite component concentration
Critical RF semiconductors, high-reliability oscillators and antennas come from a limited set of qualified vendors, driving switching costs and lead times often reaching 26–52 weeks; long qualification cycles (commonly 12–24 months) and stringent performance specs give suppliers pricing and delivery leverage over Comtech. Dual-sourcing mitigates risk but is frequently infeasible for mission-critical, space-qualified parts.
Software stacks and secure firmware dependencies
Security-certified OS, encryption modules and middleware (FIPS 140-3, NIAP Common Criteria) are supplied by niche vendors, narrowing substitute options and increasing supplier power. Compliance-driven lock-in reduces interchangeability and forces longer validation cycles. Patch cadence and support SLAs directly affect Comtech product roadmaps, while 3–5 year volume and maintenance commitments materially improve negotiation leverage.
Satellite capacity and teleport services
Leased satellite capacity and teleport access can be bottlenecks in specific regions, with gateway scarcity driving price spikes observed to exceed 30% during geopolitical crises. Long-term IRUs of 5–15 years reduce pricing volatility but lock Comtech into fixed capacity costs. Deep operator relationships and SLAs mitigate acute surges in demand or conflict-driven disruptions.
Cloud/edge infrastructure and APIs
NG911 and LBS increasingly run on hyperscaler infrastructure and APIs; in 2024 AWS, Azure and GCP held ~32%, 22% and 11% market share respectively, concentrating supplier power. Data egress, sovereignty and integration create switching frictions; reserved instances/committed spend (savings up to ~60%) lower unit costs but deepen dependence. Contract SLAs and compliance add-on fees compress margins.
- Market concentration: AWS 32% / Azure 22% / GCP 11% (2024)
- Egress/sovereignty = switching friction
- Reserved/commitment → up to ~60% savings, ↑ dependence
- SLA/compliance fees pressure margins
Regulatory testing and certification vendors
Third-party labs and certification bodies are required for public-safety and defense-grade solutions, giving them timing power due to limited accredited test houses; certification timelines commonly range from 3–12 months and failures can trigger redesigns that may add 10–25% to development costs and schedules.
- Scheduling constraints: limited accredited slots
- Specialized know-how: accreditation barriers
- Failed tests: 10–25% added cost
- Preferred labs: preserve velocity
RF bottlenecks: 26–52 wk lead times, 65% hyperscaler lock
Critical RF semiconductors, oscillators and antennas are concentrated among few qualified vendors with lead times 26–52 weeks and qualification 12–24 months, giving suppliers price/delivery leverage. Hyperscalers (AWS 32%/Azure 22%/GCP 11% in 2024) and leased satellite IRUs (5–15 yr) create switching friction and locked costs.
| Supplier | Metric (2024) | Impact |
|---|---|---|
| RF components | Lead 26–52 wk | High switching cost |
| Hyperscalers | AWS32%/AZ22%/GCP11% | Dependence, egress fees |
| Satellite IRU | 5–15 yr | Locked capacity cost |
What is included in the product
Detailed Word Document
Tailored Porter’s Five Forces analysis for Comtech that uncovers competitive drivers, buyer and supplier power, substitute threats, and entry barriers shaping pricing and profitability. Includes strategic commentary on disruptive risks and opportunities, presented in an editable format for inclusion in investor materials or strategy decks.
Customizable Excel Spreadsheet
A concise Comtech Porter's Five Forces one-sheet that visualizes competitive pressure with an editable spider chart—easy to copy into decks, customize for shifting threats, and integrate into broader reports to quickly resolve strategic blind spots.
Customers Bargaining Power
Concentrated government and carrier customers
Defense, public safety agencies and large telecoms are concentrated, sophisticated buyers whose RFP-driven procurement scale forces strong price pressure and strict compliance. They insist on 99.999% SLAs, rigorous security attestations (e.g., FedRAMP/FISMA requirements) and deep customization. Vendor scorecards and multi-year frameworks, commonly 3–5 years, further amplify customer leverage.
High switching costs but competitive alternatives
Integration into mission-critical NG911 and LBS workflows creates high switching costs because systems tie into ESInet and NENA i3 architectures, yet buyers commonly run parallel pilots with rivals to extract better terms. Data portability and interoperability standards such as NENA i3 reduce lock-in over time. Renewal cycles, typically 3–5 years, become pivotal negotiation windows for pricing and SLAs.
Outcome-based and availability-focused SLAs
Buyers demand uptime, latency and resilience guarantees with penalties; 99.95% uptime equals ~22 minutes downtime/month and 99.999% equals ~26 seconds/month, shifting operational and margin risk to Comtech. Demonstrated reliability supports premium pricing and can blunt buyer power. Transparent telemetry and defined incident-response windows reduce disputes and contested credits.
Customization and compliance demands
Public safety and defense buyers demand tailored features and certifications (NIJ, MIL-STD), driving customization that often causes scope creep and gives buyers leverage on schedules and price; GAO data through 2023 show median cost growth in major defense programs near 22%, increasing supplier exposure. Modular architectures and reference designs with reusable components help cap customization costs and speed delivery, aligning with the US FY2024 defense budget of about 858 billion USD.
- Customization increases buyer leverage and program cost
- Scope creep linked to ~22% median cost growth (GAO, through 2023)
- Modular architectures constrain cost and time
- Reference designs and reusable components restore supplier pricing power
Budget cyclicality and funding dependencies
Government appropriations (US FY2024 defense ~858 billion) and carrier capex cycles (US Tier‑1 capex ~45 billion annually) drive timing and volume, so buyers often delay awards or compress pricing near fiscal year‑ends. Multi‑year contracts and managed services smooth revenue but increase repricing risk; offering OpEx models reduces buyer pushback and preserves deal flow.
Concentrated buyers compress price/SLA; mission-critical tech raises 3-5yr switching costs
Concentrated, sophisticated buyers (defense, public safety, large telcos) exert strong price/SLA pressure via RFPs and scorecards, yet mission‑critical integrations raise switching costs. Fiscal/review cycles and 3–5y renewals are key negotiation points; OpEx models and modular designs help restore supplier pricing power.
| Metric | Value |
|---|---|
| SLA | 99.999% |
| Renewal | 3–5 yrs |
| US DEF FY2024 | $858B |
Full Version Awaits
Comtech Porter's Five Forces Analysis
This preview shows the exact Comtech Porter's Five Forces analysis you'll receive immediately after purchase—fully formatted, complete and ready to use. No placeholders or samples are included. Instant download grants access to this same professional document.











