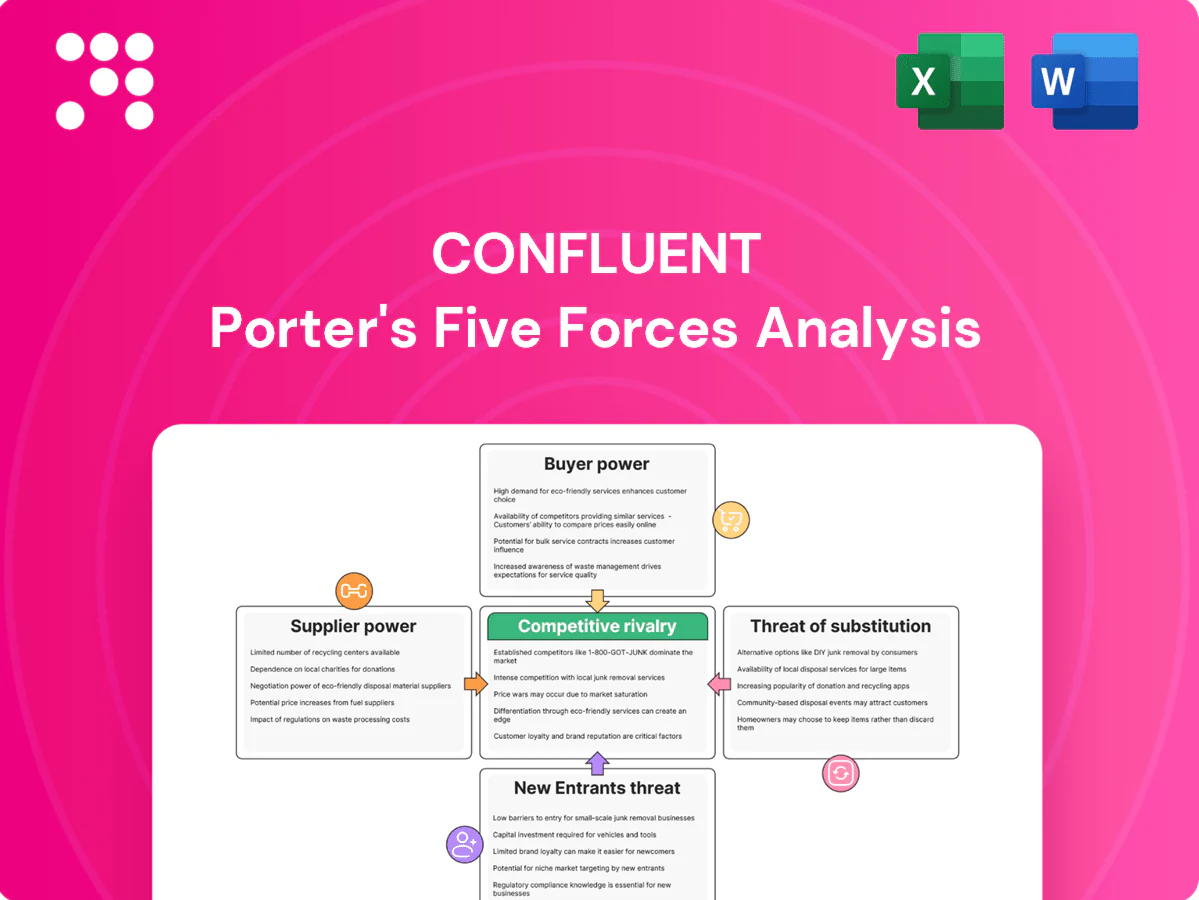
Confluent Porter's Five Forces Analysis

A Must-Have Tool for Decision-Makers
Confluent’s Porter's Five Forces snapshot highlights high buyer expectations, strong rivalry among cloud data-streaming providers, moderate supplier leverage, growing threat of substitutes and significant barriers to new entrants due to platform effects and integrations. These dynamics shape pricing power, margin sustainability and strategic priorities for product and partner investments. This brief snapshot only scratches the surface—unlock the full Porter's Five Forces Analysis to explore Confluent’s competitive dynamics in detail.
Suppliers Bargaining Power

Reliance on Hyperscalers
Confluent’s cloud relies on AWS, Azure and Google Cloud for compute, storage and networking, with those hyperscalers holding roughly 32%, 22% and 11% of the IaaS market in 2024 (Synergy Research), concentrating supplier risk. This raises exposure to pricing shifts, reserved-instance dynamics and egress fees that can materially affect margins. Co-selling and go-to-market partnerships partially offset costs, but hyperscalers are also competitive suppliers, increasing leverage. Multi-cloud architecture reduces single-vendor risk but does not eliminate dependency.
Open-Source Kafka Stewardship
Apache Kafka’s open-source community is a critical supplier of innovation and standards, with Kafka registering millions of downloads in 2024 and wide industry adoption. Permissive Apache licensing limits direct supplier pricing power, but governance or roadmap shifts can slow Confluent’s product differentiation. Confluent’s substantial code and financial contributions help shape Kafka’s direction and reduce risk. Fragmentation or rival OSS streams could still shift influence dynamics.

Specialized Engineering Talent
Expertise in distributed systems, low-latency networking and security is scarce, giving labor suppliers elevated leverage over Confluent; in 2024 US median software engineer pay was about $135,000 and specialists in infra often command premiums of 20–40%. Big tech and AI-infrastructure firms driving demand raised tech attrition to roughly 18–20% in 2024, increasing hiring costs. Remote hiring and internal tooling reduce but do not eliminate this supplier power.

Third-Party Connectors & ISVs
Third-party connectors, observability and security vendors materially expand Confluent’s platform value by enabling integrations with databases, SaaS apps and SIEMs; critical integrations often require certification and partnership terms that vendors negotiate. Certification fees and elevated support SLAs can increase total cost of ownership for Confluent and its customers. Building first-party alternatives and expanding Confluent Hub reduces supplier leverage over time.
- ecosystem: platform extensibility via connectors
- costs: certification fees and support expectations
- risk: dependency on key ISVs/SIEMs
- mitigation: first-party builds and broader partner base
Compliance, Security, and Hardware Dependencies
Meeting SOC2, ISO and FedRAMP and regional data residency requirements depends on third-party cloud infra and accredited auditors; FedRAMP authorization typically takes 6–18 months, creating schedule and cost risk. Changes in hardware pricing or network capacity can materially affect unit economics for real-time streaming. Compliance providers and auditors exert schedule and cost pressure, so investing in automated controls and multi-region footprints reduces exposure.
- FedRAMP: 6–18 months authorization
- 60+ countries have data residency/localization rules
- Third-party auditors drive timing and fees
- Automation and regional footprints lower compliance risk
Streaming vendor exposed to hyperscaler fees, OSS forks, talent squeeze, FedRAMP delays
Confluent faces concentrated supplier power from hyperscalers (IaaS: AWS 32%, Azure 22%, GCP 11% in 2024), exposing margins to pricing and egress fees. Kafka OSS and contributors limit direct pricing power but governance or forks remain strategic risks; millions of downloads in 2024 show ecosystem scale. Talent scarcity (US median SWE $135,000; infra attrition ~18–20% in 2024) plus ISV certification costs raise supplier leverage.
| Metric | 2024 Data |
|---|---|
| Hyperscaler IaaS share | AWS 32%, Azure 22%, GCP 11% |
| Kafka downloads | Millions (2024) |
| US median SWE pay | $135,000 |
| Infra attrition | ~18–20% |
| FedRAMP timeline | 6–18 months |
| Data residency | 60+ countries |
What is included in the product
 Detailed Word Document
Concise Porter's Five Forces assessment of Confluent highlighting competitive rivalry, buyer/supplier power, threat of substitutes and entrants, and strategic barriers shaping its pricing and market resilience.

 Customizable Excel Spreadsheet
A clear one-sheet Porter's Five Forces for Confluent that distills competitive pressure into actionable insights for faster strategic decisions. Easily customize force levels, swap inputs, and export to decks—no code needed, perfect for busy execs and investors.
Customers Bargaining Power

Enterprise Procurement Leverage
Enterprise buyers extract volume discounts, stricter SLAs and security commitments; multi-year, multi-cloud deals amplify their leverage. Competitive bids vs hyperscaler-native services heighten price pressure—AWS ~33%, Azure ~22%, GCP ~10% (combined ~65% IaaS share in 2024). Clear articulation of TCO and time-to-market is vital to defend Confluent’s margin.
Availability of Free Kafka
Open-source Apache Kafka offers a no-license alternative with thousands of deployments and adoption in over 80% of Fortune 100 firms, expanding buyer alternatives and bargaining power. DIY teams often accept operational burden to cut costs, pressuring vendors; Confluent reported full-year 2024 revenue of $532.9 million, so it must justify its premium via reliability, governance, and managed ops. Migration tooling and paid support lower perceived migration risk and soften price sensitivity.

Switching Costs and Lock-In
Data pipelines, schemas, and connectors create growing switching costs as integrations and governance accumulate, though Kafka protocol compatibility and open standards moderate lock-in; Confluent Hub listed 400+ connectors in 2024. Buyers use portability and connector ecosystems to negotiate pricing and terms, while proprietary value-adds like Stream Governance and Flink integrations materially increase customer stickiness.

SLA and Compliance Demands
Mission-critical streaming demands stringent SLAs, compliance, and end-to-end observability, with buyers in 2024 frequently insisting on 99.99% availability and tailored support tiers for finance, healthcare, and public sector use cases. These demands let customers extract custom contract terms and premium support, raising Confluent’s delivery costs for sector-specific certifications and controls. Strong reference architectures and validated deployments help Confluent rebalance bargaining power by reducing integration risk and time-to-value.
- 99.99% SLA expectations
- Higher delivery costs for sector certifications
- Customers leverage custom terms and tiers
- Reference architectures reduce buyer leverage
Price Sensitivity in Data Volumes
Throughput, retention, and egress (AWS data transfer out $0.09/GB in 2024) directly drive Confluent bills, so cost predictability is crucial; buyers therefore press for committed-use discounts and granular cost controls. Transparent pricing, autoscaling and per-GB/per-MB pricing reduce procurement friction, while built-in cost-optimization features materially increase buyer leverage.
- Throughput-driven billing
- Retention/egress cost pressure
- Committed-use negotiations
- Transparent pricing & autoscaling
Enterprises demand discounts as Kafka adoption exceeds 80%
Enterprise buyers secure volume discounts, strict SLAs (99.99%) and multi-year multi-cloud terms, amplifying leverage versus Confluent (FY2024 revenue $532.9M). Open-source Kafka (80%+ Fortune 100 adoption) and 400+ connectors lower switching costs and drive price pressure amid hyperscalers (AWS ~33%, Azure ~22%, GCP ~10% IaaS share 2024). Throughput, retention and egress ($0.09/GB AWS 2024) push buyers to demand committed discounts and transparent pricing.
| Metric | 2024 |
|---|---|
| Confluent revenue | $532.9M |
| Hyperscaler IaaS share | AWS 33% / Azure 22% / GCP 10% |
| Fortune 100 Kafka adoption | 80%+ |
| Connectors (Confluent Hub) | 400+ |
| AWS egress | $0.09/GB |
What You See Is What You Get
Confluent Porter's Five Forces Analysis
This Confluent Porter's Five Forces analysis is the exact, fully formatted document you’re previewing and the same file you will receive instantly after purchase. It contains a complete assessment of supplier power, buyer power, competitive rivalry, threat of entry and substitutes. No placeholders, no mockups—ready for immediate use.

A Must-Have Tool for Decision-Makers
Confluent’s Porter's Five Forces snapshot highlights high buyer expectations, strong rivalry among cloud data-streaming providers, moderate supplier leverage, growing threat of substitutes and significant barriers to new entrants due to platform effects and integrations. These dynamics shape pricing power, margin sustainability and strategic priorities for product and partner investments. This brief snapshot only scratches the surface—unlock the full Porter's Five Forces Analysis to explore Confluent’s competitive dynamics in detail.
Suppliers Bargaining Power
Reliance on Hyperscalers
Confluent’s cloud relies on AWS, Azure and Google Cloud for compute, storage and networking, with those hyperscalers holding roughly 32%, 22% and 11% of the IaaS market in 2024 (Synergy Research), concentrating supplier risk. This raises exposure to pricing shifts, reserved-instance dynamics and egress fees that can materially affect margins. Co-selling and go-to-market partnerships partially offset costs, but hyperscalers are also competitive suppliers, increasing leverage. Multi-cloud architecture reduces single-vendor risk but does not eliminate dependency.
Open-Source Kafka Stewardship
Apache Kafka’s open-source community is a critical supplier of innovation and standards, with Kafka registering millions of downloads in 2024 and wide industry adoption. Permissive Apache licensing limits direct supplier pricing power, but governance or roadmap shifts can slow Confluent’s product differentiation. Confluent’s substantial code and financial contributions help shape Kafka’s direction and reduce risk. Fragmentation or rival OSS streams could still shift influence dynamics.
Specialized Engineering Talent
Expertise in distributed systems, low-latency networking and security is scarce, giving labor suppliers elevated leverage over Confluent; in 2024 US median software engineer pay was about $135,000 and specialists in infra often command premiums of 20–40%. Big tech and AI-infrastructure firms driving demand raised tech attrition to roughly 18–20% in 2024, increasing hiring costs. Remote hiring and internal tooling reduce but do not eliminate this supplier power.
Third-Party Connectors & ISVs
Third-party connectors, observability and security vendors materially expand Confluent’s platform value by enabling integrations with databases, SaaS apps and SIEMs; critical integrations often require certification and partnership terms that vendors negotiate. Certification fees and elevated support SLAs can increase total cost of ownership for Confluent and its customers. Building first-party alternatives and expanding Confluent Hub reduces supplier leverage over time.
- ecosystem: platform extensibility via connectors
- costs: certification fees and support expectations
- risk: dependency on key ISVs/SIEMs
- mitigation: first-party builds and broader partner base
Compliance, Security, and Hardware Dependencies
Meeting SOC2, ISO and FedRAMP and regional data residency requirements depends on third-party cloud infra and accredited auditors; FedRAMP authorization typically takes 6–18 months, creating schedule and cost risk. Changes in hardware pricing or network capacity can materially affect unit economics for real-time streaming. Compliance providers and auditors exert schedule and cost pressure, so investing in automated controls and multi-region footprints reduces exposure.
- FedRAMP: 6–18 months authorization
- 60+ countries have data residency/localization rules
- Third-party auditors drive timing and fees
- Automation and regional footprints lower compliance risk
Streaming vendor exposed to hyperscaler fees, OSS forks, talent squeeze, FedRAMP delays
Confluent faces concentrated supplier power from hyperscalers (IaaS: AWS 32%, Azure 22%, GCP 11% in 2024), exposing margins to pricing and egress fees. Kafka OSS and contributors limit direct pricing power but governance or forks remain strategic risks; millions of downloads in 2024 show ecosystem scale. Talent scarcity (US median SWE $135,000; infra attrition ~18–20% in 2024) plus ISV certification costs raise supplier leverage.
| Metric | 2024 Data |
|---|---|
| Hyperscaler IaaS share | AWS 32%, Azure 22%, GCP 11% |
| Kafka downloads | Millions (2024) |
| US median SWE pay | $135,000 |
| Infra attrition | ~18–20% |
| FedRAMP timeline | 6–18 months |
| Data residency | 60+ countries |
What is included in the product
Detailed Word Document
Concise Porter's Five Forces assessment of Confluent highlighting competitive rivalry, buyer/supplier power, threat of substitutes and entrants, and strategic barriers shaping its pricing and market resilience.
Customizable Excel Spreadsheet
A clear one-sheet Porter's Five Forces for Confluent that distills competitive pressure into actionable insights for faster strategic decisions. Easily customize force levels, swap inputs, and export to decks—no code needed, perfect for busy execs and investors.
Customers Bargaining Power
Enterprise Procurement Leverage
Enterprise buyers extract volume discounts, stricter SLAs and security commitments; multi-year, multi-cloud deals amplify their leverage. Competitive bids vs hyperscaler-native services heighten price pressure—AWS ~33%, Azure ~22%, GCP ~10% (combined ~65% IaaS share in 2024). Clear articulation of TCO and time-to-market is vital to defend Confluent’s margin.
Availability of Free Kafka
Open-source Apache Kafka offers a no-license alternative with thousands of deployments and adoption in over 80% of Fortune 100 firms, expanding buyer alternatives and bargaining power. DIY teams often accept operational burden to cut costs, pressuring vendors; Confluent reported full-year 2024 revenue of $532.9 million, so it must justify its premium via reliability, governance, and managed ops. Migration tooling and paid support lower perceived migration risk and soften price sensitivity.
Switching Costs and Lock-In
Data pipelines, schemas, and connectors create growing switching costs as integrations and governance accumulate, though Kafka protocol compatibility and open standards moderate lock-in; Confluent Hub listed 400+ connectors in 2024. Buyers use portability and connector ecosystems to negotiate pricing and terms, while proprietary value-adds like Stream Governance and Flink integrations materially increase customer stickiness.
SLA and Compliance Demands
Mission-critical streaming demands stringent SLAs, compliance, and end-to-end observability, with buyers in 2024 frequently insisting on 99.99% availability and tailored support tiers for finance, healthcare, and public sector use cases. These demands let customers extract custom contract terms and premium support, raising Confluent’s delivery costs for sector-specific certifications and controls. Strong reference architectures and validated deployments help Confluent rebalance bargaining power by reducing integration risk and time-to-value.
- 99.99% SLA expectations
- Higher delivery costs for sector certifications
- Customers leverage custom terms and tiers
- Reference architectures reduce buyer leverage
Price Sensitivity in Data Volumes
Throughput, retention, and egress (AWS data transfer out $0.09/GB in 2024) directly drive Confluent bills, so cost predictability is crucial; buyers therefore press for committed-use discounts and granular cost controls. Transparent pricing, autoscaling and per-GB/per-MB pricing reduce procurement friction, while built-in cost-optimization features materially increase buyer leverage.
- Throughput-driven billing
- Retention/egress cost pressure
- Committed-use negotiations
- Transparent pricing & autoscaling
Enterprises demand discounts as Kafka adoption exceeds 80%
Enterprise buyers secure volume discounts, strict SLAs (99.99%) and multi-year multi-cloud terms, amplifying leverage versus Confluent (FY2024 revenue $532.9M). Open-source Kafka (80%+ Fortune 100 adoption) and 400+ connectors lower switching costs and drive price pressure amid hyperscalers (AWS ~33%, Azure ~22%, GCP ~10% IaaS share 2024). Throughput, retention and egress ($0.09/GB AWS 2024) push buyers to demand committed discounts and transparent pricing.
| Metric | 2024 |
|---|---|
| Confluent revenue | $532.9M |
| Hyperscaler IaaS share | AWS 33% / Azure 22% / GCP 10% |
| Fortune 100 Kafka adoption | 80%+ |
| Connectors (Confluent Hub) | 400+ |
| AWS egress | $0.09/GB |
What You See Is What You Get
Confluent Porter's Five Forces Analysis
This Confluent Porter's Five Forces analysis is the exact, fully formatted document you’re previewing and the same file you will receive instantly after purchase. It contains a complete assessment of supplier power, buyer power, competitive rivalry, threat of entry and substitutes. No placeholders, no mockups—ready for immediate use.
Original: $10.00
-65%$10.00
$3.50Description
A Must-Have Tool for Decision-Makers
Confluent’s Porter's Five Forces snapshot highlights high buyer expectations, strong rivalry among cloud data-streaming providers, moderate supplier leverage, growing threat of substitutes and significant barriers to new entrants due to platform effects and integrations. These dynamics shape pricing power, margin sustainability and strategic priorities for product and partner investments. This brief snapshot only scratches the surface—unlock the full Porter's Five Forces Analysis to explore Confluent’s competitive dynamics in detail.
Suppliers Bargaining Power
Reliance on Hyperscalers
Confluent’s cloud relies on AWS, Azure and Google Cloud for compute, storage and networking, with those hyperscalers holding roughly 32%, 22% and 11% of the IaaS market in 2024 (Synergy Research), concentrating supplier risk. This raises exposure to pricing shifts, reserved-instance dynamics and egress fees that can materially affect margins. Co-selling and go-to-market partnerships partially offset costs, but hyperscalers are also competitive suppliers, increasing leverage. Multi-cloud architecture reduces single-vendor risk but does not eliminate dependency.
Open-Source Kafka Stewardship
Apache Kafka’s open-source community is a critical supplier of innovation and standards, with Kafka registering millions of downloads in 2024 and wide industry adoption. Permissive Apache licensing limits direct supplier pricing power, but governance or roadmap shifts can slow Confluent’s product differentiation. Confluent’s substantial code and financial contributions help shape Kafka’s direction and reduce risk. Fragmentation or rival OSS streams could still shift influence dynamics.
Specialized Engineering Talent
Expertise in distributed systems, low-latency networking and security is scarce, giving labor suppliers elevated leverage over Confluent; in 2024 US median software engineer pay was about $135,000 and specialists in infra often command premiums of 20–40%. Big tech and AI-infrastructure firms driving demand raised tech attrition to roughly 18–20% in 2024, increasing hiring costs. Remote hiring and internal tooling reduce but do not eliminate this supplier power.
Third-Party Connectors & ISVs
Third-party connectors, observability and security vendors materially expand Confluent’s platform value by enabling integrations with databases, SaaS apps and SIEMs; critical integrations often require certification and partnership terms that vendors negotiate. Certification fees and elevated support SLAs can increase total cost of ownership for Confluent and its customers. Building first-party alternatives and expanding Confluent Hub reduces supplier leverage over time.
- ecosystem: platform extensibility via connectors
- costs: certification fees and support expectations
- risk: dependency on key ISVs/SIEMs
- mitigation: first-party builds and broader partner base
Compliance, Security, and Hardware Dependencies
Meeting SOC2, ISO and FedRAMP and regional data residency requirements depends on third-party cloud infra and accredited auditors; FedRAMP authorization typically takes 6–18 months, creating schedule and cost risk. Changes in hardware pricing or network capacity can materially affect unit economics for real-time streaming. Compliance providers and auditors exert schedule and cost pressure, so investing in automated controls and multi-region footprints reduces exposure.
- FedRAMP: 6–18 months authorization
- 60+ countries have data residency/localization rules
- Third-party auditors drive timing and fees
- Automation and regional footprints lower compliance risk
Streaming vendor exposed to hyperscaler fees, OSS forks, talent squeeze, FedRAMP delays
Confluent faces concentrated supplier power from hyperscalers (IaaS: AWS 32%, Azure 22%, GCP 11% in 2024), exposing margins to pricing and egress fees. Kafka OSS and contributors limit direct pricing power but governance or forks remain strategic risks; millions of downloads in 2024 show ecosystem scale. Talent scarcity (US median SWE $135,000; infra attrition ~18–20% in 2024) plus ISV certification costs raise supplier leverage.
| Metric | 2024 Data |
|---|---|
| Hyperscaler IaaS share | AWS 32%, Azure 22%, GCP 11% |
| Kafka downloads | Millions (2024) |
| US median SWE pay | $135,000 |
| Infra attrition | ~18–20% |
| FedRAMP timeline | 6–18 months |
| Data residency | 60+ countries |
What is included in the product
Detailed Word Document
Concise Porter's Five Forces assessment of Confluent highlighting competitive rivalry, buyer/supplier power, threat of substitutes and entrants, and strategic barriers shaping its pricing and market resilience.
Customizable Excel Spreadsheet
A clear one-sheet Porter's Five Forces for Confluent that distills competitive pressure into actionable insights for faster strategic decisions. Easily customize force levels, swap inputs, and export to decks—no code needed, perfect for busy execs and investors.
Customers Bargaining Power
Enterprise Procurement Leverage
Enterprise buyers extract volume discounts, stricter SLAs and security commitments; multi-year, multi-cloud deals amplify their leverage. Competitive bids vs hyperscaler-native services heighten price pressure—AWS ~33%, Azure ~22%, GCP ~10% (combined ~65% IaaS share in 2024). Clear articulation of TCO and time-to-market is vital to defend Confluent’s margin.
Availability of Free Kafka
Open-source Apache Kafka offers a no-license alternative with thousands of deployments and adoption in over 80% of Fortune 100 firms, expanding buyer alternatives and bargaining power. DIY teams often accept operational burden to cut costs, pressuring vendors; Confluent reported full-year 2024 revenue of $532.9 million, so it must justify its premium via reliability, governance, and managed ops. Migration tooling and paid support lower perceived migration risk and soften price sensitivity.
Switching Costs and Lock-In
Data pipelines, schemas, and connectors create growing switching costs as integrations and governance accumulate, though Kafka protocol compatibility and open standards moderate lock-in; Confluent Hub listed 400+ connectors in 2024. Buyers use portability and connector ecosystems to negotiate pricing and terms, while proprietary value-adds like Stream Governance and Flink integrations materially increase customer stickiness.
SLA and Compliance Demands
Mission-critical streaming demands stringent SLAs, compliance, and end-to-end observability, with buyers in 2024 frequently insisting on 99.99% availability and tailored support tiers for finance, healthcare, and public sector use cases. These demands let customers extract custom contract terms and premium support, raising Confluent’s delivery costs for sector-specific certifications and controls. Strong reference architectures and validated deployments help Confluent rebalance bargaining power by reducing integration risk and time-to-value.
- 99.99% SLA expectations
- Higher delivery costs for sector certifications
- Customers leverage custom terms and tiers
- Reference architectures reduce buyer leverage
Price Sensitivity in Data Volumes
Throughput, retention, and egress (AWS data transfer out $0.09/GB in 2024) directly drive Confluent bills, so cost predictability is crucial; buyers therefore press for committed-use discounts and granular cost controls. Transparent pricing, autoscaling and per-GB/per-MB pricing reduce procurement friction, while built-in cost-optimization features materially increase buyer leverage.
- Throughput-driven billing
- Retention/egress cost pressure
- Committed-use negotiations
- Transparent pricing & autoscaling
Enterprises demand discounts as Kafka adoption exceeds 80%
Enterprise buyers secure volume discounts, strict SLAs (99.99%) and multi-year multi-cloud terms, amplifying leverage versus Confluent (FY2024 revenue $532.9M). Open-source Kafka (80%+ Fortune 100 adoption) and 400+ connectors lower switching costs and drive price pressure amid hyperscalers (AWS ~33%, Azure ~22%, GCP ~10% IaaS share 2024). Throughput, retention and egress ($0.09/GB AWS 2024) push buyers to demand committed discounts and transparent pricing.
| Metric | 2024 |
|---|---|
| Confluent revenue | $532.9M |
| Hyperscaler IaaS share | AWS 33% / Azure 22% / GCP 10% |
| Fortune 100 Kafka adoption | 80%+ |
| Connectors (Confluent Hub) | 400+ |
| AWS egress | $0.09/GB |
What You See Is What You Get
Confluent Porter's Five Forces Analysis
This Confluent Porter's Five Forces analysis is the exact, fully formatted document you’re previewing and the same file you will receive instantly after purchase. It contains a complete assessment of supplier power, buyer power, competitive rivalry, threat of entry and substitutes. No placeholders, no mockups—ready for immediate use.











