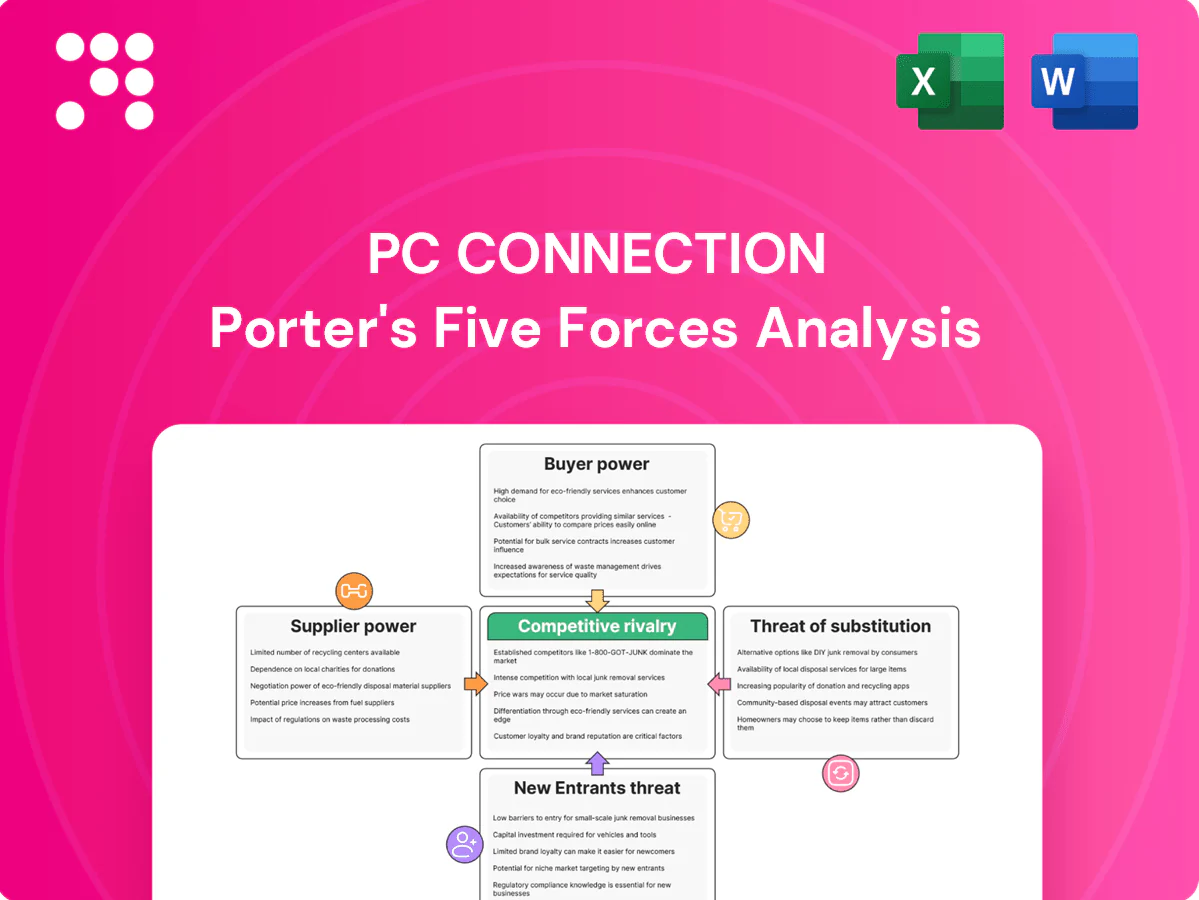
PC Connection Porter's Five Forces Analysis

Don't Miss the Bigger Picture
PC Connection faces moderate supplier power, intense buyer price sensitivity, and strong rivalry from online and direct competitors; barriers to entry are mixed while substitutes erode margins in parts of its portfolio. This snapshot highlights key pressures and strategic levers. Unlock the full Porter's Five Forces Analysis to access force-by-force ratings, visuals, and actionable recommendations.
Suppliers Bargaining Power

Concentrated OEM brands
Connection depends on a handful of dominant OEMs—Microsoft (FY2024 revenue ~$212B), Apple (~$383B), Dell (~$101B), HP (~$58B) and Cisco (~$56B)—whose scale and limited substitutes boost supplier leverage. These vendors can dictate pricing, allocation and co-marketing terms. Changes in certification or partner tiers directly affect discounts and deal registration. Reliance on vendor roadmaps and end-of-life cycles increases exposure to supply and margin risk.
Distributor intermediation
Ingram Micro and TD SYNNEX, which together account for roughly 60% of global IT distribution revenue in 2024, control availability, credit terms and logistics across a vast SKU universe, so tight allocations or credit tightening can compress PC Connection margins; distributors often prioritize larger partners in shortages, and Connection mitigates by multi-distributor sourcing and active inventory planning.

Cloud hyperscaler terms
Azure, AWS and Google control ~66% of global cloud spend (AWS 32%, Azure 23%, GCP 11% in 2024), setting margins, incentives and marketplace rules that dictate resale and managed services economics; partner program shifts (eg. 2023–24 incentive changes) can cut profitability quickly. Usage-based billing volatility (often ±20–30% monthly) limits pricing control, while deep certifications raise margins but require ongoing investment—certified engineers command 20–40% higher pay.

Supply chain volatility
Supply chain volatility in 2024 lets component suppliers pass through costs from shortages, freight disruptions, and tariff changes, squeezing PC Connection margins; lead-time swings force buffer inventory or costly expedited shipping, and suppliers may impose allocation during demand spikes, while transparent customer communication preserves trust despite delays.
- 2024: component shortages + freight/tariff pass-through
- Lead-time swings → buffer inventory or expedite
- Supplier allocations in spikes
- Transparent customer communication mitigates churn
Mitigation via value-add
Design, integration, configuration, and managed services shift PC Connection away from pure product dependence, leveraging its FY2024 net sales of $2.15 billion to negotiate services-led contracts; multi-vendor portfolios and cross-certifications widen supplier choice and improve bargaining leverage; strong demand forecasting and MDF co-planning secure better pricing and lead-times; private-label and refurbished options add incremental negotiating power.
Large OEMs + two distributors (~60%) grant suppliers pricing leverage
Dominant OEMs (Apple $383B, Microsoft $212B, Dell $101B, HP $58B, Cisco $56B in FY2024) and two distributors (Ingram/TD SYNNEX ~60% share) give suppliers strong leverage over price, allocation and terms. Cloud providers (AWS 32%, Azure 23%, GCP 11% = ~66% spend) control incentives; usage volatility ±20–30% and cert pay premiums (20–40%) raise costs. PC Connection FY2024 sales $2.15B; services and private-label reduce but do not eliminate supplier power.
| Metric | 2024 |
|---|---|
| PC Connection sales | $2.15B |
| Apple | $383B |
| Microsoft | $212B |
| Ingram+SYNNEX share | ~60% |
| Cloud (AWS/Azure/GCP) | 32/23/11% |
What is included in the product
 Detailed Word Document
Concise Porter's Five Forces analysis of PC Connection, unpacking competitive rivalry, supplier and buyer power, threat of substitutes and new entrants, and identifying disruptive risks to market share and pricing power; includes strategic commentary and industry data to inform investor, management, or academic use.

 Customizable Excel Spreadsheet
A concise one-sheet Porter's Five Forces for PC Connection that turns complex competitive dynamics into actionable decisions—customize pressure levels, swap in your data, and export clean spider charts for pitch decks. No macros or coding; integrates with Excel dashboards and pairs with the Word deep-dive for instant, boardroom-ready insights.
Customers Bargaining Power

Large RFP-driven accounts
Enterprises, government and education buyers run RFPs that intensely pressure pricing, with 2024 procurement practice favoring competitive bids and e-procurement platforms. Multi-year contracts (commonly 3–5 years) and volume commitments force material discounts and strict SLAs. Increasing procurement sophistication in 2024 heightened negotiation leverage. Strong past performance and contract vehicles (GSA, state term) often shift decisions away from price alone.
Low switching costs
Customers can shift between VARs and e-tailers with minimal friction for commodity hardware and software, driving price-based churn. Online price transparency and comparison tools have intensified shopping, and in 2024 roughly 62% of enterprise IT purchases flowed through e-procurement or online channels, making multi-sourcing straightforward. Differentiated services—integration, managed services, SLAs—remain essential to create stickiness.

Service bundling stickiness
Managed services, lifecycle management and custom integrations raise switching costs by embedding processes and tools; industry data in 2024 shows the global managed services market exceeded $250 billion, underscoring scale. Embedded imaging, device tracking and co-developed architectures create operational dependency, while performance-based SLAs align incentives and lower churn.

Compliance and SLAs
Regulated buyers demand security, accessibility, and strict data-handling compliance that vendors must meet, and in 2024 roughly 62% of public-sector RFPs cited formal compliance requirements. Buyers leverage these rules to negotiate tailored SLAs and penalties, often prioritizing FedRAMP or ISO certifications; possessing them can decisively win deals. Vendors lacking required accreditations risk disqualification even if their price is 5–10% lower.
- Compliance-driven procurement: 62% public RFPs (2024)
- Decisive certifications: FedRAMP, ISO
- SLA leverage: tailored penalties common
- Disqualification risk > small price gaps
Budget cycles and seasonality
E-procurement 62% and $250B services tilt IT buying power
Buyers run RFPs and e-procurement (62% of enterprise IT purchases in 2024), forcing discounts, multi-year SLAs and pricing pressure. Commodity hardware enables easy switching, while managed services (> $250B global market in 2024) and certifications (FedRAMP/ISO) raise switching costs and can disqualify lower-cost bidders. US education/public tech budgets (~$30B in 2024) concentrate timing and strengthen buyer leverage.
| Metric | 2024 Value |
|---|---|
| e-procurement share | 62% |
| Managed services market | > $250B |
| US education/public tech budgets | ~ $30B |
What You See Is What You Get
PC Connection Porter's Five Forces Analysis
This preview shows the exact PC Connection Porter's Five Forces analysis you'll receive upon purchase—fully formatted, complete and ready to use. It examines threat of new entrants, supplier and buyer power, threat of substitutes and competitive rivalry with data-driven insights and strategic implications. No placeholders or samples; the file you see is the file you'll download immediately after payment.

Don't Miss the Bigger Picture
PC Connection faces moderate supplier power, intense buyer price sensitivity, and strong rivalry from online and direct competitors; barriers to entry are mixed while substitutes erode margins in parts of its portfolio. This snapshot highlights key pressures and strategic levers. Unlock the full Porter's Five Forces Analysis to access force-by-force ratings, visuals, and actionable recommendations.
Suppliers Bargaining Power
Concentrated OEM brands
Connection depends on a handful of dominant OEMs—Microsoft (FY2024 revenue ~$212B), Apple (~$383B), Dell (~$101B), HP (~$58B) and Cisco (~$56B)—whose scale and limited substitutes boost supplier leverage. These vendors can dictate pricing, allocation and co-marketing terms. Changes in certification or partner tiers directly affect discounts and deal registration. Reliance on vendor roadmaps and end-of-life cycles increases exposure to supply and margin risk.
Distributor intermediation
Ingram Micro and TD SYNNEX, which together account for roughly 60% of global IT distribution revenue in 2024, control availability, credit terms and logistics across a vast SKU universe, so tight allocations or credit tightening can compress PC Connection margins; distributors often prioritize larger partners in shortages, and Connection mitigates by multi-distributor sourcing and active inventory planning.
Cloud hyperscaler terms
Azure, AWS and Google control ~66% of global cloud spend (AWS 32%, Azure 23%, GCP 11% in 2024), setting margins, incentives and marketplace rules that dictate resale and managed services economics; partner program shifts (eg. 2023–24 incentive changes) can cut profitability quickly. Usage-based billing volatility (often ±20–30% monthly) limits pricing control, while deep certifications raise margins but require ongoing investment—certified engineers command 20–40% higher pay.
Supply chain volatility
Supply chain volatility in 2024 lets component suppliers pass through costs from shortages, freight disruptions, and tariff changes, squeezing PC Connection margins; lead-time swings force buffer inventory or costly expedited shipping, and suppliers may impose allocation during demand spikes, while transparent customer communication preserves trust despite delays.
- 2024: component shortages + freight/tariff pass-through
- Lead-time swings → buffer inventory or expedite
- Supplier allocations in spikes
- Transparent customer communication mitigates churn
Mitigation via value-add
Design, integration, configuration, and managed services shift PC Connection away from pure product dependence, leveraging its FY2024 net sales of $2.15 billion to negotiate services-led contracts; multi-vendor portfolios and cross-certifications widen supplier choice and improve bargaining leverage; strong demand forecasting and MDF co-planning secure better pricing and lead-times; private-label and refurbished options add incremental negotiating power.
Large OEMs + two distributors (~60%) grant suppliers pricing leverage
Dominant OEMs (Apple $383B, Microsoft $212B, Dell $101B, HP $58B, Cisco $56B in FY2024) and two distributors (Ingram/TD SYNNEX ~60% share) give suppliers strong leverage over price, allocation and terms. Cloud providers (AWS 32%, Azure 23%, GCP 11% = ~66% spend) control incentives; usage volatility ±20–30% and cert pay premiums (20–40%) raise costs. PC Connection FY2024 sales $2.15B; services and private-label reduce but do not eliminate supplier power.
| Metric | 2024 |
|---|---|
| PC Connection sales | $2.15B |
| Apple | $383B |
| Microsoft | $212B |
| Ingram+SYNNEX share | ~60% |
| Cloud (AWS/Azure/GCP) | 32/23/11% |
What is included in the product
Detailed Word Document
Concise Porter's Five Forces analysis of PC Connection, unpacking competitive rivalry, supplier and buyer power, threat of substitutes and new entrants, and identifying disruptive risks to market share and pricing power; includes strategic commentary and industry data to inform investor, management, or academic use.
Customizable Excel Spreadsheet
A concise one-sheet Porter's Five Forces for PC Connection that turns complex competitive dynamics into actionable decisions—customize pressure levels, swap in your data, and export clean spider charts for pitch decks. No macros or coding; integrates with Excel dashboards and pairs with the Word deep-dive for instant, boardroom-ready insights.
Customers Bargaining Power
Large RFP-driven accounts
Enterprises, government and education buyers run RFPs that intensely pressure pricing, with 2024 procurement practice favoring competitive bids and e-procurement platforms. Multi-year contracts (commonly 3–5 years) and volume commitments force material discounts and strict SLAs. Increasing procurement sophistication in 2024 heightened negotiation leverage. Strong past performance and contract vehicles (GSA, state term) often shift decisions away from price alone.
Low switching costs
Customers can shift between VARs and e-tailers with minimal friction for commodity hardware and software, driving price-based churn. Online price transparency and comparison tools have intensified shopping, and in 2024 roughly 62% of enterprise IT purchases flowed through e-procurement or online channels, making multi-sourcing straightforward. Differentiated services—integration, managed services, SLAs—remain essential to create stickiness.
Service bundling stickiness
Managed services, lifecycle management and custom integrations raise switching costs by embedding processes and tools; industry data in 2024 shows the global managed services market exceeded $250 billion, underscoring scale. Embedded imaging, device tracking and co-developed architectures create operational dependency, while performance-based SLAs align incentives and lower churn.
Compliance and SLAs
Regulated buyers demand security, accessibility, and strict data-handling compliance that vendors must meet, and in 2024 roughly 62% of public-sector RFPs cited formal compliance requirements. Buyers leverage these rules to negotiate tailored SLAs and penalties, often prioritizing FedRAMP or ISO certifications; possessing them can decisively win deals. Vendors lacking required accreditations risk disqualification even if their price is 5–10% lower.
- Compliance-driven procurement: 62% public RFPs (2024)
- Decisive certifications: FedRAMP, ISO
- SLA leverage: tailored penalties common
- Disqualification risk > small price gaps
Budget cycles and seasonality
E-procurement 62% and $250B services tilt IT buying power
Buyers run RFPs and e-procurement (62% of enterprise IT purchases in 2024), forcing discounts, multi-year SLAs and pricing pressure. Commodity hardware enables easy switching, while managed services (> $250B global market in 2024) and certifications (FedRAMP/ISO) raise switching costs and can disqualify lower-cost bidders. US education/public tech budgets (~$30B in 2024) concentrate timing and strengthen buyer leverage.
| Metric | 2024 Value |
|---|---|
| e-procurement share | 62% |
| Managed services market | > $250B |
| US education/public tech budgets | ~ $30B |
What You See Is What You Get
PC Connection Porter's Five Forces Analysis
This preview shows the exact PC Connection Porter's Five Forces analysis you'll receive upon purchase—fully formatted, complete and ready to use. It examines threat of new entrants, supplier and buyer power, threat of substitutes and competitive rivalry with data-driven insights and strategic implications. No placeholders or samples; the file you see is the file you'll download immediately after payment.
Original: $10.00
-65%$10.00
$3.50Description
Don't Miss the Bigger Picture
PC Connection faces moderate supplier power, intense buyer price sensitivity, and strong rivalry from online and direct competitors; barriers to entry are mixed while substitutes erode margins in parts of its portfolio. This snapshot highlights key pressures and strategic levers. Unlock the full Porter's Five Forces Analysis to access force-by-force ratings, visuals, and actionable recommendations.
Suppliers Bargaining Power
Concentrated OEM brands
Connection depends on a handful of dominant OEMs—Microsoft (FY2024 revenue ~$212B), Apple (~$383B), Dell (~$101B), HP (~$58B) and Cisco (~$56B)—whose scale and limited substitutes boost supplier leverage. These vendors can dictate pricing, allocation and co-marketing terms. Changes in certification or partner tiers directly affect discounts and deal registration. Reliance on vendor roadmaps and end-of-life cycles increases exposure to supply and margin risk.
Distributor intermediation
Ingram Micro and TD SYNNEX, which together account for roughly 60% of global IT distribution revenue in 2024, control availability, credit terms and logistics across a vast SKU universe, so tight allocations or credit tightening can compress PC Connection margins; distributors often prioritize larger partners in shortages, and Connection mitigates by multi-distributor sourcing and active inventory planning.
Cloud hyperscaler terms
Azure, AWS and Google control ~66% of global cloud spend (AWS 32%, Azure 23%, GCP 11% in 2024), setting margins, incentives and marketplace rules that dictate resale and managed services economics; partner program shifts (eg. 2023–24 incentive changes) can cut profitability quickly. Usage-based billing volatility (often ±20–30% monthly) limits pricing control, while deep certifications raise margins but require ongoing investment—certified engineers command 20–40% higher pay.
Supply chain volatility
Supply chain volatility in 2024 lets component suppliers pass through costs from shortages, freight disruptions, and tariff changes, squeezing PC Connection margins; lead-time swings force buffer inventory or costly expedited shipping, and suppliers may impose allocation during demand spikes, while transparent customer communication preserves trust despite delays.
- 2024: component shortages + freight/tariff pass-through
- Lead-time swings → buffer inventory or expedite
- Supplier allocations in spikes
- Transparent customer communication mitigates churn
Mitigation via value-add
Design, integration, configuration, and managed services shift PC Connection away from pure product dependence, leveraging its FY2024 net sales of $2.15 billion to negotiate services-led contracts; multi-vendor portfolios and cross-certifications widen supplier choice and improve bargaining leverage; strong demand forecasting and MDF co-planning secure better pricing and lead-times; private-label and refurbished options add incremental negotiating power.
Large OEMs + two distributors (~60%) grant suppliers pricing leverage
Dominant OEMs (Apple $383B, Microsoft $212B, Dell $101B, HP $58B, Cisco $56B in FY2024) and two distributors (Ingram/TD SYNNEX ~60% share) give suppliers strong leverage over price, allocation and terms. Cloud providers (AWS 32%, Azure 23%, GCP 11% = ~66% spend) control incentives; usage volatility ±20–30% and cert pay premiums (20–40%) raise costs. PC Connection FY2024 sales $2.15B; services and private-label reduce but do not eliminate supplier power.
| Metric | 2024 |
|---|---|
| PC Connection sales | $2.15B |
| Apple | $383B |
| Microsoft | $212B |
| Ingram+SYNNEX share | ~60% |
| Cloud (AWS/Azure/GCP) | 32/23/11% |
What is included in the product
Detailed Word Document
Concise Porter's Five Forces analysis of PC Connection, unpacking competitive rivalry, supplier and buyer power, threat of substitutes and new entrants, and identifying disruptive risks to market share and pricing power; includes strategic commentary and industry data to inform investor, management, or academic use.
Customizable Excel Spreadsheet
A concise one-sheet Porter's Five Forces for PC Connection that turns complex competitive dynamics into actionable decisions—customize pressure levels, swap in your data, and export clean spider charts for pitch decks. No macros or coding; integrates with Excel dashboards and pairs with the Word deep-dive for instant, boardroom-ready insights.
Customers Bargaining Power
Large RFP-driven accounts
Enterprises, government and education buyers run RFPs that intensely pressure pricing, with 2024 procurement practice favoring competitive bids and e-procurement platforms. Multi-year contracts (commonly 3–5 years) and volume commitments force material discounts and strict SLAs. Increasing procurement sophistication in 2024 heightened negotiation leverage. Strong past performance and contract vehicles (GSA, state term) often shift decisions away from price alone.
Low switching costs
Customers can shift between VARs and e-tailers with minimal friction for commodity hardware and software, driving price-based churn. Online price transparency and comparison tools have intensified shopping, and in 2024 roughly 62% of enterprise IT purchases flowed through e-procurement or online channels, making multi-sourcing straightforward. Differentiated services—integration, managed services, SLAs—remain essential to create stickiness.
Service bundling stickiness
Managed services, lifecycle management and custom integrations raise switching costs by embedding processes and tools; industry data in 2024 shows the global managed services market exceeded $250 billion, underscoring scale. Embedded imaging, device tracking and co-developed architectures create operational dependency, while performance-based SLAs align incentives and lower churn.
Compliance and SLAs
Regulated buyers demand security, accessibility, and strict data-handling compliance that vendors must meet, and in 2024 roughly 62% of public-sector RFPs cited formal compliance requirements. Buyers leverage these rules to negotiate tailored SLAs and penalties, often prioritizing FedRAMP or ISO certifications; possessing them can decisively win deals. Vendors lacking required accreditations risk disqualification even if their price is 5–10% lower.
- Compliance-driven procurement: 62% public RFPs (2024)
- Decisive certifications: FedRAMP, ISO
- SLA leverage: tailored penalties common
- Disqualification risk > small price gaps
Budget cycles and seasonality
E-procurement 62% and $250B services tilt IT buying power
Buyers run RFPs and e-procurement (62% of enterprise IT purchases in 2024), forcing discounts, multi-year SLAs and pricing pressure. Commodity hardware enables easy switching, while managed services (> $250B global market in 2024) and certifications (FedRAMP/ISO) raise switching costs and can disqualify lower-cost bidders. US education/public tech budgets (~$30B in 2024) concentrate timing and strengthen buyer leverage.
| Metric | 2024 Value |
|---|---|
| e-procurement share | 62% |
| Managed services market | > $250B |
| US education/public tech budgets | ~ $30B |
What You See Is What You Get
PC Connection Porter's Five Forces Analysis
This preview shows the exact PC Connection Porter's Five Forces analysis you'll receive upon purchase—fully formatted, complete and ready to use. It examines threat of new entrants, supplier and buyer power, threat of substitutes and competitive rivalry with data-driven insights and strategic implications. No placeholders or samples; the file you see is the file you'll download immediately after payment.











