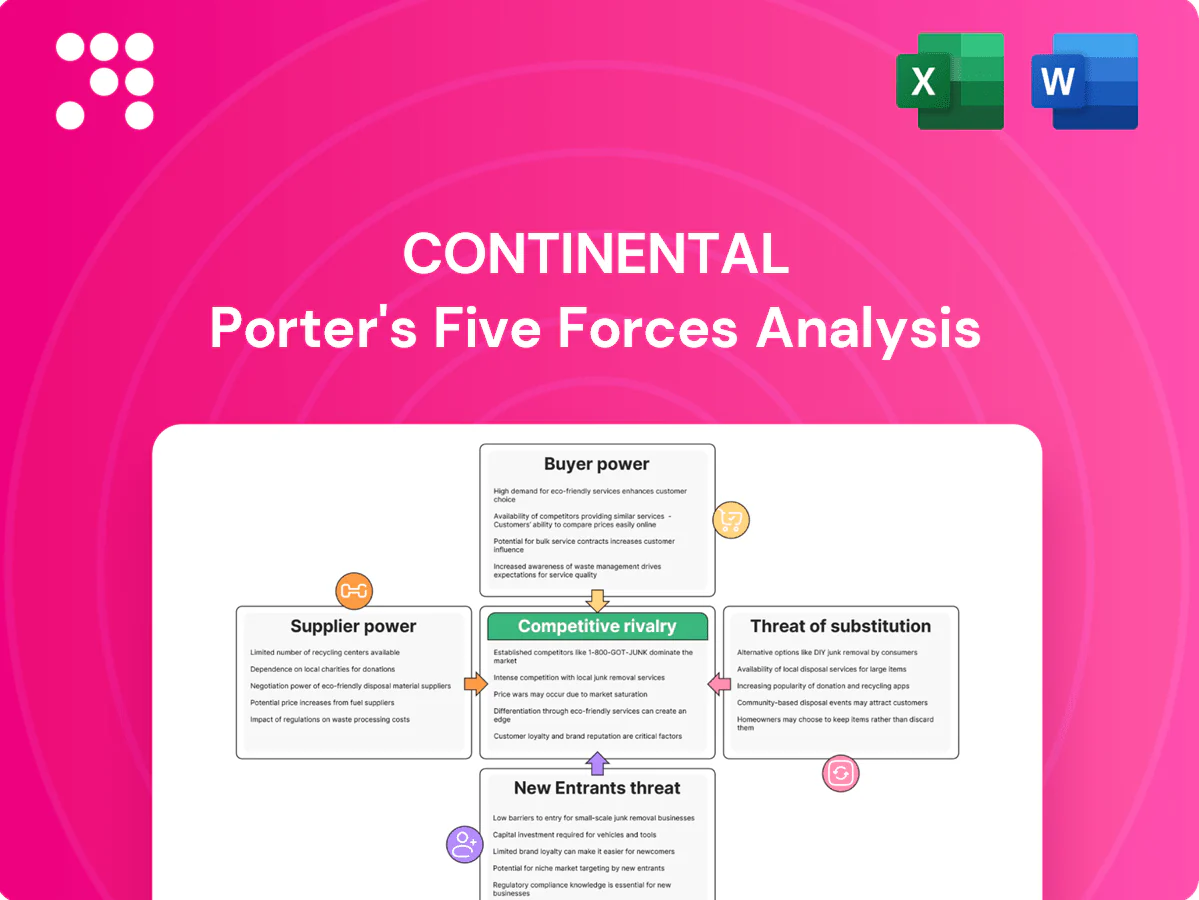
Continental Porter's Five Forces Analysis

From Overview to Strategy Blueprint
This brief snapshot highlights key competitive pressures on Continental—supplier leverage, buyer power, rivalry intensity, and substitution risks—showing where strategic vulnerability and opportunity lie. The full Porter's Five Forces Analysis delivers force-by-force ratings, visuals, and actionable implications tailored to Continental. Unlock the complete report to inform investment or strategy decisions with consultant-grade insight.
Suppliers Bargaining Power

Semiconductor dependency
Continental depends on a narrow set of Tier-2 chipmakers for ADAS controllers, sensors and power electronics, concentrating supplier leverage. Global wafer fab utilization hovered near 90% in 2024 and automotive-grade chip lead times averaged 28–34 weeks, boosting pricing power. Dual-sourcing and redesigns reduce single-supplier risk but add 6–18 months of validation. Strategic agreements ease supply but node-specific capacity constraints persist.
Specialty materials and chemicals
Advanced tires and brake systems rely on proprietary rubber compounds, carbon black, silica and specialty resins supplied by a concentrated set of chemical firms such as Cabot, Birla Carbon, Orion, Evonik and Dow, giving suppliers notable bargaining power. Volatility in oil and energy prices transmits to these feedstocks and thus to Continental’s input costs. Long-term supply contracts mitigate price spikes but constrain short-term negotiating flexibility.

Software toolchains and platforms
Continental’s development relies on licensed toolchains, AUTOSAR stacks, RTOS and major cloud providers, creating high supplier leverage; switching core platforms mid-program is costly and risky and can add months and multimillion-euro redesigns. Cybersecurity and compliance patches increase lock-in; in 2024 software represented roughly 25% of vehicle value, raising platform dependency. Building internal platforms reduces vendor risk but requires years and scarce talent.

Precision components and machinery
Production relies on specialized molds, curing presses, tire-building machines and sensor packaging equipment, with qualification cycles in 2024 commonly exceeding 12 months due to safety-critical standards.
A small number of OEMs dominate these niches in 2024, enabling premium pricing and stricter service terms that raise switching costs for Continental.
Preventive maintenance and multi-year service contracts (often 3–5 years) embed ongoing supplier leverage and recurring spend.
- Specialized equipment: long qualification (12+ months)
- Supplier concentration: dominant OEMs, premium pricing
- Service contracts: 3–5 year maintenance lock-in
Logistics and geopolitical exposure
Global supply chains across Europe, Asia and the Americas expose Continental to volatile shipping rates, tariffs and export controls; container rates fell sharply from 2021 peaks into 2024, easing freight costs but leaving tariff and export-control risk intact. Regionalized manufacturing has reduced transit exposure but raised fixed costs and capex. Suppliers in sensitive jurisdictions face sudden restrictions; buffer inventory and nearshoring mitigate but do not eliminate disruption risk.
- Supply-chain exposure: Europe/Asia/Americas
- Shipping rates: normalized by 2024 vs 2021 peak
- Regionalization: lower transit risk, higher fixed costs
- Policy risk: sudden supplier restrictions
- Mitigants: buffer inventory, nearshoring (partial)
Supplier power squeezes automakers: chip lead times, software lock-in, costly contracts
Supplier power is high: auto chips (fab utilization ~90% in 2024; lead times 28–34 weeks) and specialty chemicals raise input costs. Software/platforms (~25% of vehicle value in 2024) create lock-in; switching costs months and multimillion-euro redesigns. Equipment qualification >12 months and 3–5 year service contracts sustain supplier leverage amid regional policy risks.
| Metric | 2024 | Impact |
|---|---|---|
| Wafer fab utilization | ~90% | Price/lead-time pressure |
| Chip lead times | 28–34 wks | Supply risk |
| Software share | ~25% vehicle value | Platform lock-in |
| Equip qual. | >12 months | Slow switching |
| Service contracts | 3–5 yrs | Ongoing spend |
What is included in the product
 Detailed Word Document
Tailored Porter's Five Forces analysis for Continental that dissects competitive rivalry, supplier and buyer power, threat of entrants and substitutes, and emerging disruptions—evaluating impacts on pricing, margins, and market share; fully editable for inclusion in investor decks, strategy reports, or academic projects.

 Customizable Excel Spreadsheet
Continental Porter's Five Forces Analysis provides a concise one-sheet of competitive pressures with customizable intensity levels and an instant radar visual—ideal for quick boardroom decisions, pitch decks, or embedding into broader dashboards.
Customers Bargaining Power

Concentrated OEM customers
Global automakers and Tier-1 platforms act as large, consolidated buyers with strong leverage over suppliers; Continental reported group sales of €34.1 billion in 2023, concentrating bargaining around major program volumes. Their scale and multi-year platform awards enable steep price negotiation and volume commitments, so losing a platform can materially reduce production utilization and margins. Winning programs increasingly requires aggressive pricing, bundled value-adds (software, integration) and technical differentiation.
Platform sourcing and long cycles
Automotive platforms lock suppliers 5–7 years, concentrating program volume in few contracts and reducing churn. Competitive RFQs at award typically force margin concessions, often trimming supplier margins by 200–400 basis points in 2024. Lock-in cements those price concessions for the program lifetime. Mid-cycle engineering change requests can further squeeze suppliers' margins and working capital.

Stringent quality and penalty regimes
OEMs enforce strict PPAP, ASPICE and ISO 26262 functional safety standards and include warranty clawbacks that can trigger chargebacks and disqualification for noncompliance; failures routinely lead to immediate cost recovery and contract termination risk. This transfers the cost of quality to suppliers and incentivizes buyers to demand broader commercial protections and non-price concessions. Buyers thus secure favorable payment, liability and audit terms beyond unit price.

Switching costs vs modularity
Integration into vehicle E/E architectures raises switching costs for complex ADAS and braking systems because deep software and hardware coupling locks OEMs into suppliers for calibration, updates and liability management, while growing modularity and standardized interfaces (e.g., SOME/IP, AUTOSAR) enable buyers to multi-source; Continental must balance proprietary integration with openness and use joint roadmaps to reduce switching desire.
- Lock-in vs openness
- Joint roadmaps lower churn
- Standards enable multi-sourcing
Aftermarket dynamics
Aftermarket tires and replacement parts sell into retail and fleet channels with increasingly informed buyers; global tire aftermarket was about USD 120bn in 2024, and online sales reached roughly 25% of retail, amplifying price transparency and private-label growth (~15% share in key markets). Brand, performance, and sustainability claims sustain premium segments, while promotions and channel programs are essential to defend share.
- Market size: USD 120bn (2024)
- Online retail share: ~25%
- Private-label share: ~15%
- Focus: brand, performance, sustainability, promotions
OEMs squeeze suppliers 200–400 bps; aftermarket USD 120bn
Large OEMs/Tier‑1 buyers concentrate volume (Continental sales €34.1bn in 2023), enforce 5–7 year program lock‑ins and drove supplier margin compression of ~200–400 bps in 2024. OEMs extract non‑price protections via PPAP/ASPICE/ISO26262 and warranty clawbacks. Aftermarket remains sizable (USD 120bn in 2024) with ~25% online and ~15% private‑label.
| Metric | Value |
|---|---|
| Group sales (2023) | €34.1bn |
| Margin pressure (2024) | 200–400 bps |
| Program length | 5–7 yrs |
| Aftermarket (2024) | USD 120bn |
| Online share | ~25% |
| Private‑label | ~15% |
Preview the Actual Deliverable
Continental Porter's Five Forces Analysis
This preview shows the exact Continental Porter's Five Forces Analysis you'll receive after purchase—no placeholders or summaries. The file is fully formatted, professionally written, and ready to download instantly upon payment. Use it immediately for strategic planning, valuation, or market assessment.

From Overview to Strategy Blueprint
This brief snapshot highlights key competitive pressures on Continental—supplier leverage, buyer power, rivalry intensity, and substitution risks—showing where strategic vulnerability and opportunity lie. The full Porter's Five Forces Analysis delivers force-by-force ratings, visuals, and actionable implications tailored to Continental. Unlock the complete report to inform investment or strategy decisions with consultant-grade insight.
Suppliers Bargaining Power
Semiconductor dependency
Continental depends on a narrow set of Tier-2 chipmakers for ADAS controllers, sensors and power electronics, concentrating supplier leverage. Global wafer fab utilization hovered near 90% in 2024 and automotive-grade chip lead times averaged 28–34 weeks, boosting pricing power. Dual-sourcing and redesigns reduce single-supplier risk but add 6–18 months of validation. Strategic agreements ease supply but node-specific capacity constraints persist.
Specialty materials and chemicals
Advanced tires and brake systems rely on proprietary rubber compounds, carbon black, silica and specialty resins supplied by a concentrated set of chemical firms such as Cabot, Birla Carbon, Orion, Evonik and Dow, giving suppliers notable bargaining power. Volatility in oil and energy prices transmits to these feedstocks and thus to Continental’s input costs. Long-term supply contracts mitigate price spikes but constrain short-term negotiating flexibility.
Software toolchains and platforms
Continental’s development relies on licensed toolchains, AUTOSAR stacks, RTOS and major cloud providers, creating high supplier leverage; switching core platforms mid-program is costly and risky and can add months and multimillion-euro redesigns. Cybersecurity and compliance patches increase lock-in; in 2024 software represented roughly 25% of vehicle value, raising platform dependency. Building internal platforms reduces vendor risk but requires years and scarce talent.
Precision components and machinery
Production relies on specialized molds, curing presses, tire-building machines and sensor packaging equipment, with qualification cycles in 2024 commonly exceeding 12 months due to safety-critical standards.
A small number of OEMs dominate these niches in 2024, enabling premium pricing and stricter service terms that raise switching costs for Continental.
Preventive maintenance and multi-year service contracts (often 3–5 years) embed ongoing supplier leverage and recurring spend.
- Specialized equipment: long qualification (12+ months)
- Supplier concentration: dominant OEMs, premium pricing
- Service contracts: 3–5 year maintenance lock-in
Logistics and geopolitical exposure
Global supply chains across Europe, Asia and the Americas expose Continental to volatile shipping rates, tariffs and export controls; container rates fell sharply from 2021 peaks into 2024, easing freight costs but leaving tariff and export-control risk intact. Regionalized manufacturing has reduced transit exposure but raised fixed costs and capex. Suppliers in sensitive jurisdictions face sudden restrictions; buffer inventory and nearshoring mitigate but do not eliminate disruption risk.
- Supply-chain exposure: Europe/Asia/Americas
- Shipping rates: normalized by 2024 vs 2021 peak
- Regionalization: lower transit risk, higher fixed costs
- Policy risk: sudden supplier restrictions
- Mitigants: buffer inventory, nearshoring (partial)
Supplier power squeezes automakers: chip lead times, software lock-in, costly contracts
Supplier power is high: auto chips (fab utilization ~90% in 2024; lead times 28–34 weeks) and specialty chemicals raise input costs. Software/platforms (~25% of vehicle value in 2024) create lock-in; switching costs months and multimillion-euro redesigns. Equipment qualification >12 months and 3–5 year service contracts sustain supplier leverage amid regional policy risks.
| Metric | 2024 | Impact |
|---|---|---|
| Wafer fab utilization | ~90% | Price/lead-time pressure |
| Chip lead times | 28–34 wks | Supply risk |
| Software share | ~25% vehicle value | Platform lock-in |
| Equip qual. | >12 months | Slow switching |
| Service contracts | 3–5 yrs | Ongoing spend |
What is included in the product
Detailed Word Document
Tailored Porter's Five Forces analysis for Continental that dissects competitive rivalry, supplier and buyer power, threat of entrants and substitutes, and emerging disruptions—evaluating impacts on pricing, margins, and market share; fully editable for inclusion in investor decks, strategy reports, or academic projects.
Customizable Excel Spreadsheet
Continental Porter's Five Forces Analysis provides a concise one-sheet of competitive pressures with customizable intensity levels and an instant radar visual—ideal for quick boardroom decisions, pitch decks, or embedding into broader dashboards.
Customers Bargaining Power
Concentrated OEM customers
Global automakers and Tier-1 platforms act as large, consolidated buyers with strong leverage over suppliers; Continental reported group sales of €34.1 billion in 2023, concentrating bargaining around major program volumes. Their scale and multi-year platform awards enable steep price negotiation and volume commitments, so losing a platform can materially reduce production utilization and margins. Winning programs increasingly requires aggressive pricing, bundled value-adds (software, integration) and technical differentiation.
Platform sourcing and long cycles
Automotive platforms lock suppliers 5–7 years, concentrating program volume in few contracts and reducing churn. Competitive RFQs at award typically force margin concessions, often trimming supplier margins by 200–400 basis points in 2024. Lock-in cements those price concessions for the program lifetime. Mid-cycle engineering change requests can further squeeze suppliers' margins and working capital.
Stringent quality and penalty regimes
OEMs enforce strict PPAP, ASPICE and ISO 26262 functional safety standards and include warranty clawbacks that can trigger chargebacks and disqualification for noncompliance; failures routinely lead to immediate cost recovery and contract termination risk. This transfers the cost of quality to suppliers and incentivizes buyers to demand broader commercial protections and non-price concessions. Buyers thus secure favorable payment, liability and audit terms beyond unit price.
Switching costs vs modularity
Integration into vehicle E/E architectures raises switching costs for complex ADAS and braking systems because deep software and hardware coupling locks OEMs into suppliers for calibration, updates and liability management, while growing modularity and standardized interfaces (e.g., SOME/IP, AUTOSAR) enable buyers to multi-source; Continental must balance proprietary integration with openness and use joint roadmaps to reduce switching desire.
- Lock-in vs openness
- Joint roadmaps lower churn
- Standards enable multi-sourcing
Aftermarket dynamics
Aftermarket tires and replacement parts sell into retail and fleet channels with increasingly informed buyers; global tire aftermarket was about USD 120bn in 2024, and online sales reached roughly 25% of retail, amplifying price transparency and private-label growth (~15% share in key markets). Brand, performance, and sustainability claims sustain premium segments, while promotions and channel programs are essential to defend share.
- Market size: USD 120bn (2024)
- Online retail share: ~25%
- Private-label share: ~15%
- Focus: brand, performance, sustainability, promotions
OEMs squeeze suppliers 200–400 bps; aftermarket USD 120bn
Large OEMs/Tier‑1 buyers concentrate volume (Continental sales €34.1bn in 2023), enforce 5–7 year program lock‑ins and drove supplier margin compression of ~200–400 bps in 2024. OEMs extract non‑price protections via PPAP/ASPICE/ISO26262 and warranty clawbacks. Aftermarket remains sizable (USD 120bn in 2024) with ~25% online and ~15% private‑label.
| Metric | Value |
|---|---|
| Group sales (2023) | €34.1bn |
| Margin pressure (2024) | 200–400 bps |
| Program length | 5–7 yrs |
| Aftermarket (2024) | USD 120bn |
| Online share | ~25% |
| Private‑label | ~15% |
Preview the Actual Deliverable
Continental Porter's Five Forces Analysis
This preview shows the exact Continental Porter's Five Forces Analysis you'll receive after purchase—no placeholders or summaries. The file is fully formatted, professionally written, and ready to download instantly upon payment. Use it immediately for strategic planning, valuation, or market assessment.
Description
From Overview to Strategy Blueprint
This brief snapshot highlights key competitive pressures on Continental—supplier leverage, buyer power, rivalry intensity, and substitution risks—showing where strategic vulnerability and opportunity lie. The full Porter's Five Forces Analysis delivers force-by-force ratings, visuals, and actionable implications tailored to Continental. Unlock the complete report to inform investment or strategy decisions with consultant-grade insight.
Suppliers Bargaining Power
Semiconductor dependency
Continental depends on a narrow set of Tier-2 chipmakers for ADAS controllers, sensors and power electronics, concentrating supplier leverage. Global wafer fab utilization hovered near 90% in 2024 and automotive-grade chip lead times averaged 28–34 weeks, boosting pricing power. Dual-sourcing and redesigns reduce single-supplier risk but add 6–18 months of validation. Strategic agreements ease supply but node-specific capacity constraints persist.
Specialty materials and chemicals
Advanced tires and brake systems rely on proprietary rubber compounds, carbon black, silica and specialty resins supplied by a concentrated set of chemical firms such as Cabot, Birla Carbon, Orion, Evonik and Dow, giving suppliers notable bargaining power. Volatility in oil and energy prices transmits to these feedstocks and thus to Continental’s input costs. Long-term supply contracts mitigate price spikes but constrain short-term negotiating flexibility.
Software toolchains and platforms
Continental’s development relies on licensed toolchains, AUTOSAR stacks, RTOS and major cloud providers, creating high supplier leverage; switching core platforms mid-program is costly and risky and can add months and multimillion-euro redesigns. Cybersecurity and compliance patches increase lock-in; in 2024 software represented roughly 25% of vehicle value, raising platform dependency. Building internal platforms reduces vendor risk but requires years and scarce talent.
Precision components and machinery
Production relies on specialized molds, curing presses, tire-building machines and sensor packaging equipment, with qualification cycles in 2024 commonly exceeding 12 months due to safety-critical standards.
A small number of OEMs dominate these niches in 2024, enabling premium pricing and stricter service terms that raise switching costs for Continental.
Preventive maintenance and multi-year service contracts (often 3–5 years) embed ongoing supplier leverage and recurring spend.
- Specialized equipment: long qualification (12+ months)
- Supplier concentration: dominant OEMs, premium pricing
- Service contracts: 3–5 year maintenance lock-in
Logistics and geopolitical exposure
Global supply chains across Europe, Asia and the Americas expose Continental to volatile shipping rates, tariffs and export controls; container rates fell sharply from 2021 peaks into 2024, easing freight costs but leaving tariff and export-control risk intact. Regionalized manufacturing has reduced transit exposure but raised fixed costs and capex. Suppliers in sensitive jurisdictions face sudden restrictions; buffer inventory and nearshoring mitigate but do not eliminate disruption risk.
- Supply-chain exposure: Europe/Asia/Americas
- Shipping rates: normalized by 2024 vs 2021 peak
- Regionalization: lower transit risk, higher fixed costs
- Policy risk: sudden supplier restrictions
- Mitigants: buffer inventory, nearshoring (partial)
Supplier power squeezes automakers: chip lead times, software lock-in, costly contracts
Supplier power is high: auto chips (fab utilization ~90% in 2024; lead times 28–34 weeks) and specialty chemicals raise input costs. Software/platforms (~25% of vehicle value in 2024) create lock-in; switching costs months and multimillion-euro redesigns. Equipment qualification >12 months and 3–5 year service contracts sustain supplier leverage amid regional policy risks.
| Metric | 2024 | Impact |
|---|---|---|
| Wafer fab utilization | ~90% | Price/lead-time pressure |
| Chip lead times | 28–34 wks | Supply risk |
| Software share | ~25% vehicle value | Platform lock-in |
| Equip qual. | >12 months | Slow switching |
| Service contracts | 3–5 yrs | Ongoing spend |
What is included in the product
Detailed Word Document
Tailored Porter's Five Forces analysis for Continental that dissects competitive rivalry, supplier and buyer power, threat of entrants and substitutes, and emerging disruptions—evaluating impacts on pricing, margins, and market share; fully editable for inclusion in investor decks, strategy reports, or academic projects.
Customizable Excel Spreadsheet
Continental Porter's Five Forces Analysis provides a concise one-sheet of competitive pressures with customizable intensity levels and an instant radar visual—ideal for quick boardroom decisions, pitch decks, or embedding into broader dashboards.
Customers Bargaining Power
Concentrated OEM customers
Global automakers and Tier-1 platforms act as large, consolidated buyers with strong leverage over suppliers; Continental reported group sales of €34.1 billion in 2023, concentrating bargaining around major program volumes. Their scale and multi-year platform awards enable steep price negotiation and volume commitments, so losing a platform can materially reduce production utilization and margins. Winning programs increasingly requires aggressive pricing, bundled value-adds (software, integration) and technical differentiation.
Platform sourcing and long cycles
Automotive platforms lock suppliers 5–7 years, concentrating program volume in few contracts and reducing churn. Competitive RFQs at award typically force margin concessions, often trimming supplier margins by 200–400 basis points in 2024. Lock-in cements those price concessions for the program lifetime. Mid-cycle engineering change requests can further squeeze suppliers' margins and working capital.
Stringent quality and penalty regimes
OEMs enforce strict PPAP, ASPICE and ISO 26262 functional safety standards and include warranty clawbacks that can trigger chargebacks and disqualification for noncompliance; failures routinely lead to immediate cost recovery and contract termination risk. This transfers the cost of quality to suppliers and incentivizes buyers to demand broader commercial protections and non-price concessions. Buyers thus secure favorable payment, liability and audit terms beyond unit price.
Switching costs vs modularity
Integration into vehicle E/E architectures raises switching costs for complex ADAS and braking systems because deep software and hardware coupling locks OEMs into suppliers for calibration, updates and liability management, while growing modularity and standardized interfaces (e.g., SOME/IP, AUTOSAR) enable buyers to multi-source; Continental must balance proprietary integration with openness and use joint roadmaps to reduce switching desire.
- Lock-in vs openness
- Joint roadmaps lower churn
- Standards enable multi-sourcing
Aftermarket dynamics
Aftermarket tires and replacement parts sell into retail and fleet channels with increasingly informed buyers; global tire aftermarket was about USD 120bn in 2024, and online sales reached roughly 25% of retail, amplifying price transparency and private-label growth (~15% share in key markets). Brand, performance, and sustainability claims sustain premium segments, while promotions and channel programs are essential to defend share.
- Market size: USD 120bn (2024)
- Online retail share: ~25%
- Private-label share: ~15%
- Focus: brand, performance, sustainability, promotions
OEMs squeeze suppliers 200–400 bps; aftermarket USD 120bn
Large OEMs/Tier‑1 buyers concentrate volume (Continental sales €34.1bn in 2023), enforce 5–7 year program lock‑ins and drove supplier margin compression of ~200–400 bps in 2024. OEMs extract non‑price protections via PPAP/ASPICE/ISO26262 and warranty clawbacks. Aftermarket remains sizable (USD 120bn in 2024) with ~25% online and ~15% private‑label.
| Metric | Value |
|---|---|
| Group sales (2023) | €34.1bn |
| Margin pressure (2024) | 200–400 bps |
| Program length | 5–7 yrs |
| Aftermarket (2024) | USD 120bn |
| Online share | ~25% |
| Private‑label | ~15% |
Preview the Actual Deliverable
Continental Porter's Five Forces Analysis
This preview shows the exact Continental Porter's Five Forces Analysis you'll receive after purchase—no placeholders or summaries. The file is fully formatted, professionally written, and ready to download instantly upon payment. Use it immediately for strategic planning, valuation, or market assessment.











