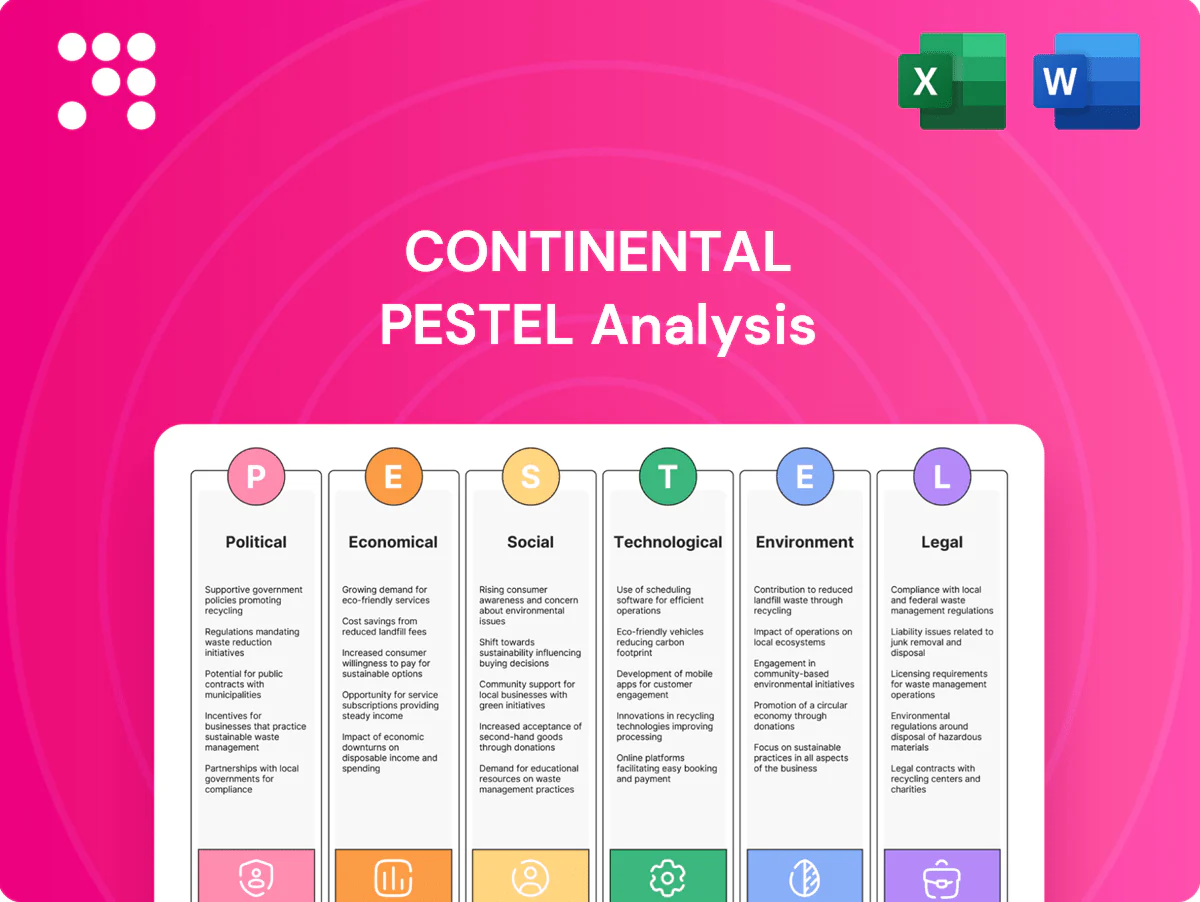
Continental PESTLE Analysis

Plan Smarter. Present Sharper. Compete Stronger.
Gain a strategic edge with our PESTLE Analysis of Continental—concise, targeted insights into political, economic, social, technological, legal, and environmental forces shaping its future. Ideal for investors, consultants, and strategists seeking actionable intelligence. Purchase the full report to access the complete, ready-to-use breakdown and forecasts.
Political factors

EV incentives and industrial policy
Government subsidies and electrification targets—EU ban on new ICE car sales from 2035 and US EV tax credit up to 7,500 USD—are reshaping OEM powertrain roadmaps and pushing Continental toward more inverters, e-axles and battery sensors. IRA-style packages (~369 billion USD federal clean energy support) and EU industrial programs redirect investments and sourcing footprints via localization incentives. Any rollback or delay in incentives would shift timing and volume for e-mobility and ADAS content demand.
Trade tensions and tariffs
Auto parts face tariff risks across EU–US–China corridors, with US Section 301 measures still imposing duties up to 25% on many Chinese imports, raising component costs and pressuring price competitiveness. Tariff escalation or anti-dumping actions on tires or electronics can compress margins and raise input volatility. Continental must diversify manufacturing footprints and logistics routes to mitigate cross-border tariff shocks.

Geopolitical supply-chain security
Government scrutiny of sensors and semiconductors, amplified by US export controls on advanced chips to China, is forcing localization and resilience requirements; the US CHIPS and Science Act authorized $52.7 billion for domestic semiconductor incentives. TSMC held roughly 50–53% of global foundry market share in 2023, concentrating leading-edge capacity and heightening geopolitical risk. Sanctions and controls limit access to advanced tooling, making multi-regional redundancy a political imperative rather than an operational choice.

Public procurement and infrastructure
State spending on smart roads, 5G rollout and charging networks — backed by the US Infrastructure Investment and Jobs Act (1.2 trillion USD, including 7.5 billion USD for EV charging) and the EU Digital Decade 2030 5G coverage target — catalyzes ADAS and V2X adoption; policy-driven timing of these investments directly shapes take-rates for connected and automated features.
- Align pilots to public co-investment to shorten deployment cycles
- Prioritize regions with IIJA/EU funding to boost early take-rates
- Use 5G and charger rollouts as commercial proof points for V2X
Regulatory alignment and standards diplomacy
Policy shocks boost demand for inverters, e-axles and chips; tariffs lengthen homologation timelines
Political shifts—EV mandates (EU 2035 ICE ban), IRA/IIJA and ~$369B US clean‑energy support plus $52.7B CHIPS—accelerate demand for inverters, e‑axles and localized semiconductors. Tariffs and export controls (Section 301, chip limits) raise costs and force multi‑regional sourcing. UNECE rules (70+ parties) and EU ~10M new cars (2023) add 6–18 months to homologation if not engaged early.
| Metric | Value | Impact |
|---|---|---|
| US clean energy | ~369B | Local production push |
| CHIPS | 52.7B | Semiconductor localization |
| UNECE reach | 70+ (2024) | Global standards/cert delay |
What is included in the product
 Detailed Word Document
Explores how Political, Economic, Social, Technological, Environmental, and Legal forces uniquely impact the Continental, with each section supported by current data and trends to highlight risks and opportunities. Designed for executives and advisors, the analysis offers actionable, forward-looking insights ready for reports and strategy planning.

 Customizable Excel Spreadsheet
A concise, visually segmented Continental PESTLE summary that’s easily shareable and editable, enabling quick alignment across teams, seamless inclusion in presentations or strategy folders, and fast reference during planning or client meetings.
Economic factors

Auto demand cyclicality
Vehicle sales are highly cyclical—global light-vehicle volumes were near 78 million units in 2024, while US annualized sales were about 15.5 million, making demand sensitive to interest rates (Fed funds ~5.25–5.50% in 2024), employment (US unemployment ~3.7% in 2024) and consumer confidence, driving order volatility. Downcycles compress margins and pricing for Tier-1 suppliers; upcycles squeeze capacity and working capital. Continental must pair flexible cost structures with multi-year R&D spending on ADAS and electrification.
Input costs and inflation
Raw-materials and energy—natural rubber, petrochemicals, steel and electronics—directly squeeze Continental margins as input volatility persists; European gas prices, which peaked in 2022, declined sharply by roughly 40% into 2024 while eurozone inflation eased from double-digits to about 2.4% in 2024, complicating pass-through and OEM repricing cadences. Procurement hedging and design-to-cost remain pivotal to protect profitability.

FX exposure and global footprint
Continental’s revenues and costs span EUR, USD, CNY and multiple emerging-market currencies, creating material translation and transaction risk given its operations in over 60 countries and tens of billions of euros in sales. Currency swings shift the competitiveness of European exports and affect sourcing economics, pressuring margins when EUR/USD or CNY moves. Natural hedging through geographically matched costs and dynamic pricing are key tools management uses to stabilize reported earnings.

Semiconductor and logistics normalization
Post-pandemic semiconductor lead times have declined from peaks near 28 weeks in 2021 to ~12–14 weeks by 2024 and global container freight rates are down about 70–80% from 2021–22 highs, but the situation remains fragile; renewed bottlenecks quickly ripple into ADAS and infotainment programs, which account for the largest share of automotive semiconductor content. Strategic supplier ties and higher OEM buffer inventories (around 50–60 days) have materially reduced line‑stop risk.
- Lead times: ~12–14 weeks (2024)
- Freight rates: down ~70–80% vs 2021–22
- OEM semiconductor inventory: ~50–60 days
- High sensitivity: ADAS/infotainment exposure
Capital intensity and ROI
Electrification, software and tire capacity push Continental’s capital intensity: 2024 R&D was about €2.6bn and capex near €1.7bn, straining free cash flow and extending ROI timelines. OEM program delays lengthen payback periods and increase working capital needs. Rigorous portfolio pruning and platform reuse are therefore critical to restore return discipline and protect margins.
- Electrification: high capex and development cycles
- Software: ongoing R&D spend, slower monetization
- Tire capacity: cyclical investment, margin pressure
- Mitigation: platform reuse, portfolio pruning
Policy shocks boost demand for inverters, e-axles and chips; tariffs lengthen homologation timelines
Vehicle demand is cyclical (global LV ~78m, US ~15.5m in 2024) and sensitive to rates (Fed ~5.25–5.50%), employment (~3.7% US) and confidence; R&D €2.6bn, capex €1.7bn strain cash; input and currency swings (EUR/USD, CNY) compress margins; semiconductor lead times ~12–14 weeks and freight down ~70–80% vs 2021–22.
| Metric | 2024 |
|---|---|
| Global LV sales | 78m |
| US sales | 15.5m |
| Fed funds | 5.25–5.50% |
| R&D / Capex | €2.6bn / €1.7bn |
What You See Is What You Get
Continental PESTLE Analysis
The preview shown here is the exact Continental PESTLE Analysis you’ll receive after purchase—fully formatted and ready to use. The content, layout, and structure visible are the final version with no placeholders or surprises. After payment you’ll instantly download this exact, professionally structured file.

Plan Smarter. Present Sharper. Compete Stronger.
Gain a strategic edge with our PESTLE Analysis of Continental—concise, targeted insights into political, economic, social, technological, legal, and environmental forces shaping its future. Ideal for investors, consultants, and strategists seeking actionable intelligence. Purchase the full report to access the complete, ready-to-use breakdown and forecasts.
Political factors
EV incentives and industrial policy
Government subsidies and electrification targets—EU ban on new ICE car sales from 2035 and US EV tax credit up to 7,500 USD—are reshaping OEM powertrain roadmaps and pushing Continental toward more inverters, e-axles and battery sensors. IRA-style packages (~369 billion USD federal clean energy support) and EU industrial programs redirect investments and sourcing footprints via localization incentives. Any rollback or delay in incentives would shift timing and volume for e-mobility and ADAS content demand.
Trade tensions and tariffs
Auto parts face tariff risks across EU–US–China corridors, with US Section 301 measures still imposing duties up to 25% on many Chinese imports, raising component costs and pressuring price competitiveness. Tariff escalation or anti-dumping actions on tires or electronics can compress margins and raise input volatility. Continental must diversify manufacturing footprints and logistics routes to mitigate cross-border tariff shocks.
Geopolitical supply-chain security
Government scrutiny of sensors and semiconductors, amplified by US export controls on advanced chips to China, is forcing localization and resilience requirements; the US CHIPS and Science Act authorized $52.7 billion for domestic semiconductor incentives. TSMC held roughly 50–53% of global foundry market share in 2023, concentrating leading-edge capacity and heightening geopolitical risk. Sanctions and controls limit access to advanced tooling, making multi-regional redundancy a political imperative rather than an operational choice.
Public procurement and infrastructure
State spending on smart roads, 5G rollout and charging networks — backed by the US Infrastructure Investment and Jobs Act (1.2 trillion USD, including 7.5 billion USD for EV charging) and the EU Digital Decade 2030 5G coverage target — catalyzes ADAS and V2X adoption; policy-driven timing of these investments directly shapes take-rates for connected and automated features.
- Align pilots to public co-investment to shorten deployment cycles
- Prioritize regions with IIJA/EU funding to boost early take-rates
- Use 5G and charger rollouts as commercial proof points for V2X
Regulatory alignment and standards diplomacy
Policy shocks boost demand for inverters, e-axles and chips; tariffs lengthen homologation timelines
Political shifts—EV mandates (EU 2035 ICE ban), IRA/IIJA and ~$369B US clean‑energy support plus $52.7B CHIPS—accelerate demand for inverters, e‑axles and localized semiconductors. Tariffs and export controls (Section 301, chip limits) raise costs and force multi‑regional sourcing. UNECE rules (70+ parties) and EU ~10M new cars (2023) add 6–18 months to homologation if not engaged early.
| Metric | Value | Impact |
|---|---|---|
| US clean energy | ~369B | Local production push |
| CHIPS | 52.7B | Semiconductor localization |
| UNECE reach | 70+ (2024) | Global standards/cert delay |
What is included in the product
Detailed Word Document
Explores how Political, Economic, Social, Technological, Environmental, and Legal forces uniquely impact the Continental, with each section supported by current data and trends to highlight risks and opportunities. Designed for executives and advisors, the analysis offers actionable, forward-looking insights ready for reports and strategy planning.
Customizable Excel Spreadsheet
A concise, visually segmented Continental PESTLE summary that’s easily shareable and editable, enabling quick alignment across teams, seamless inclusion in presentations or strategy folders, and fast reference during planning or client meetings.
Economic factors
Auto demand cyclicality
Vehicle sales are highly cyclical—global light-vehicle volumes were near 78 million units in 2024, while US annualized sales were about 15.5 million, making demand sensitive to interest rates (Fed funds ~5.25–5.50% in 2024), employment (US unemployment ~3.7% in 2024) and consumer confidence, driving order volatility. Downcycles compress margins and pricing for Tier-1 suppliers; upcycles squeeze capacity and working capital. Continental must pair flexible cost structures with multi-year R&D spending on ADAS and electrification.
Input costs and inflation
Raw-materials and energy—natural rubber, petrochemicals, steel and electronics—directly squeeze Continental margins as input volatility persists; European gas prices, which peaked in 2022, declined sharply by roughly 40% into 2024 while eurozone inflation eased from double-digits to about 2.4% in 2024, complicating pass-through and OEM repricing cadences. Procurement hedging and design-to-cost remain pivotal to protect profitability.
FX exposure and global footprint
Continental’s revenues and costs span EUR, USD, CNY and multiple emerging-market currencies, creating material translation and transaction risk given its operations in over 60 countries and tens of billions of euros in sales. Currency swings shift the competitiveness of European exports and affect sourcing economics, pressuring margins when EUR/USD or CNY moves. Natural hedging through geographically matched costs and dynamic pricing are key tools management uses to stabilize reported earnings.
Semiconductor and logistics normalization
Post-pandemic semiconductor lead times have declined from peaks near 28 weeks in 2021 to ~12–14 weeks by 2024 and global container freight rates are down about 70–80% from 2021–22 highs, but the situation remains fragile; renewed bottlenecks quickly ripple into ADAS and infotainment programs, which account for the largest share of automotive semiconductor content. Strategic supplier ties and higher OEM buffer inventories (around 50–60 days) have materially reduced line‑stop risk.
- Lead times: ~12–14 weeks (2024)
- Freight rates: down ~70–80% vs 2021–22
- OEM semiconductor inventory: ~50–60 days
- High sensitivity: ADAS/infotainment exposure
Capital intensity and ROI
Electrification, software and tire capacity push Continental’s capital intensity: 2024 R&D was about €2.6bn and capex near €1.7bn, straining free cash flow and extending ROI timelines. OEM program delays lengthen payback periods and increase working capital needs. Rigorous portfolio pruning and platform reuse are therefore critical to restore return discipline and protect margins.
- Electrification: high capex and development cycles
- Software: ongoing R&D spend, slower monetization
- Tire capacity: cyclical investment, margin pressure
- Mitigation: platform reuse, portfolio pruning
Policy shocks boost demand for inverters, e-axles and chips; tariffs lengthen homologation timelines
Vehicle demand is cyclical (global LV ~78m, US ~15.5m in 2024) and sensitive to rates (Fed ~5.25–5.50%), employment (~3.7% US) and confidence; R&D €2.6bn, capex €1.7bn strain cash; input and currency swings (EUR/USD, CNY) compress margins; semiconductor lead times ~12–14 weeks and freight down ~70–80% vs 2021–22.
| Metric | 2024 |
|---|---|
| Global LV sales | 78m |
| US sales | 15.5m |
| Fed funds | 5.25–5.50% |
| R&D / Capex | €2.6bn / €1.7bn |
What You See Is What You Get
Continental PESTLE Analysis
The preview shown here is the exact Continental PESTLE Analysis you’ll receive after purchase—fully formatted and ready to use. The content, layout, and structure visible are the final version with no placeholders or surprises. After payment you’ll instantly download this exact, professionally structured file.
Original: $10.00
-65%$10.00
$3.50Description
Plan Smarter. Present Sharper. Compete Stronger.
Gain a strategic edge with our PESTLE Analysis of Continental—concise, targeted insights into political, economic, social, technological, legal, and environmental forces shaping its future. Ideal for investors, consultants, and strategists seeking actionable intelligence. Purchase the full report to access the complete, ready-to-use breakdown and forecasts.
Political factors
EV incentives and industrial policy
Government subsidies and electrification targets—EU ban on new ICE car sales from 2035 and US EV tax credit up to 7,500 USD—are reshaping OEM powertrain roadmaps and pushing Continental toward more inverters, e-axles and battery sensors. IRA-style packages (~369 billion USD federal clean energy support) and EU industrial programs redirect investments and sourcing footprints via localization incentives. Any rollback or delay in incentives would shift timing and volume for e-mobility and ADAS content demand.
Trade tensions and tariffs
Auto parts face tariff risks across EU–US–China corridors, with US Section 301 measures still imposing duties up to 25% on many Chinese imports, raising component costs and pressuring price competitiveness. Tariff escalation or anti-dumping actions on tires or electronics can compress margins and raise input volatility. Continental must diversify manufacturing footprints and logistics routes to mitigate cross-border tariff shocks.
Geopolitical supply-chain security
Government scrutiny of sensors and semiconductors, amplified by US export controls on advanced chips to China, is forcing localization and resilience requirements; the US CHIPS and Science Act authorized $52.7 billion for domestic semiconductor incentives. TSMC held roughly 50–53% of global foundry market share in 2023, concentrating leading-edge capacity and heightening geopolitical risk. Sanctions and controls limit access to advanced tooling, making multi-regional redundancy a political imperative rather than an operational choice.
Public procurement and infrastructure
State spending on smart roads, 5G rollout and charging networks — backed by the US Infrastructure Investment and Jobs Act (1.2 trillion USD, including 7.5 billion USD for EV charging) and the EU Digital Decade 2030 5G coverage target — catalyzes ADAS and V2X adoption; policy-driven timing of these investments directly shapes take-rates for connected and automated features.
- Align pilots to public co-investment to shorten deployment cycles
- Prioritize regions with IIJA/EU funding to boost early take-rates
- Use 5G and charger rollouts as commercial proof points for V2X
Regulatory alignment and standards diplomacy
Policy shocks boost demand for inverters, e-axles and chips; tariffs lengthen homologation timelines
Political shifts—EV mandates (EU 2035 ICE ban), IRA/IIJA and ~$369B US clean‑energy support plus $52.7B CHIPS—accelerate demand for inverters, e‑axles and localized semiconductors. Tariffs and export controls (Section 301, chip limits) raise costs and force multi‑regional sourcing. UNECE rules (70+ parties) and EU ~10M new cars (2023) add 6–18 months to homologation if not engaged early.
| Metric | Value | Impact |
|---|---|---|
| US clean energy | ~369B | Local production push |
| CHIPS | 52.7B | Semiconductor localization |
| UNECE reach | 70+ (2024) | Global standards/cert delay |
What is included in the product
Detailed Word Document
Explores how Political, Economic, Social, Technological, Environmental, and Legal forces uniquely impact the Continental, with each section supported by current data and trends to highlight risks and opportunities. Designed for executives and advisors, the analysis offers actionable, forward-looking insights ready for reports and strategy planning.
Customizable Excel Spreadsheet
A concise, visually segmented Continental PESTLE summary that’s easily shareable and editable, enabling quick alignment across teams, seamless inclusion in presentations or strategy folders, and fast reference during planning or client meetings.
Economic factors
Auto demand cyclicality
Vehicle sales are highly cyclical—global light-vehicle volumes were near 78 million units in 2024, while US annualized sales were about 15.5 million, making demand sensitive to interest rates (Fed funds ~5.25–5.50% in 2024), employment (US unemployment ~3.7% in 2024) and consumer confidence, driving order volatility. Downcycles compress margins and pricing for Tier-1 suppliers; upcycles squeeze capacity and working capital. Continental must pair flexible cost structures with multi-year R&D spending on ADAS and electrification.
Input costs and inflation
Raw-materials and energy—natural rubber, petrochemicals, steel and electronics—directly squeeze Continental margins as input volatility persists; European gas prices, which peaked in 2022, declined sharply by roughly 40% into 2024 while eurozone inflation eased from double-digits to about 2.4% in 2024, complicating pass-through and OEM repricing cadences. Procurement hedging and design-to-cost remain pivotal to protect profitability.
FX exposure and global footprint
Continental’s revenues and costs span EUR, USD, CNY and multiple emerging-market currencies, creating material translation and transaction risk given its operations in over 60 countries and tens of billions of euros in sales. Currency swings shift the competitiveness of European exports and affect sourcing economics, pressuring margins when EUR/USD or CNY moves. Natural hedging through geographically matched costs and dynamic pricing are key tools management uses to stabilize reported earnings.
Semiconductor and logistics normalization
Post-pandemic semiconductor lead times have declined from peaks near 28 weeks in 2021 to ~12–14 weeks by 2024 and global container freight rates are down about 70–80% from 2021–22 highs, but the situation remains fragile; renewed bottlenecks quickly ripple into ADAS and infotainment programs, which account for the largest share of automotive semiconductor content. Strategic supplier ties and higher OEM buffer inventories (around 50–60 days) have materially reduced line‑stop risk.
- Lead times: ~12–14 weeks (2024)
- Freight rates: down ~70–80% vs 2021–22
- OEM semiconductor inventory: ~50–60 days
- High sensitivity: ADAS/infotainment exposure
Capital intensity and ROI
Electrification, software and tire capacity push Continental’s capital intensity: 2024 R&D was about €2.6bn and capex near €1.7bn, straining free cash flow and extending ROI timelines. OEM program delays lengthen payback periods and increase working capital needs. Rigorous portfolio pruning and platform reuse are therefore critical to restore return discipline and protect margins.
- Electrification: high capex and development cycles
- Software: ongoing R&D spend, slower monetization
- Tire capacity: cyclical investment, margin pressure
- Mitigation: platform reuse, portfolio pruning
Policy shocks boost demand for inverters, e-axles and chips; tariffs lengthen homologation timelines
Vehicle demand is cyclical (global LV ~78m, US ~15.5m in 2024) and sensitive to rates (Fed ~5.25–5.50%), employment (~3.7% US) and confidence; R&D €2.6bn, capex €1.7bn strain cash; input and currency swings (EUR/USD, CNY) compress margins; semiconductor lead times ~12–14 weeks and freight down ~70–80% vs 2021–22.
| Metric | 2024 |
|---|---|
| Global LV sales | 78m |
| US sales | 15.5m |
| Fed funds | 5.25–5.50% |
| R&D / Capex | €2.6bn / €1.7bn |
What You See Is What You Get
Continental PESTLE Analysis
The preview shown here is the exact Continental PESTLE Analysis you’ll receive after purchase—fully formatted and ready to use. The content, layout, and structure visible are the final version with no placeholders or surprises. After payment you’ll instantly download this exact, professionally structured file.











