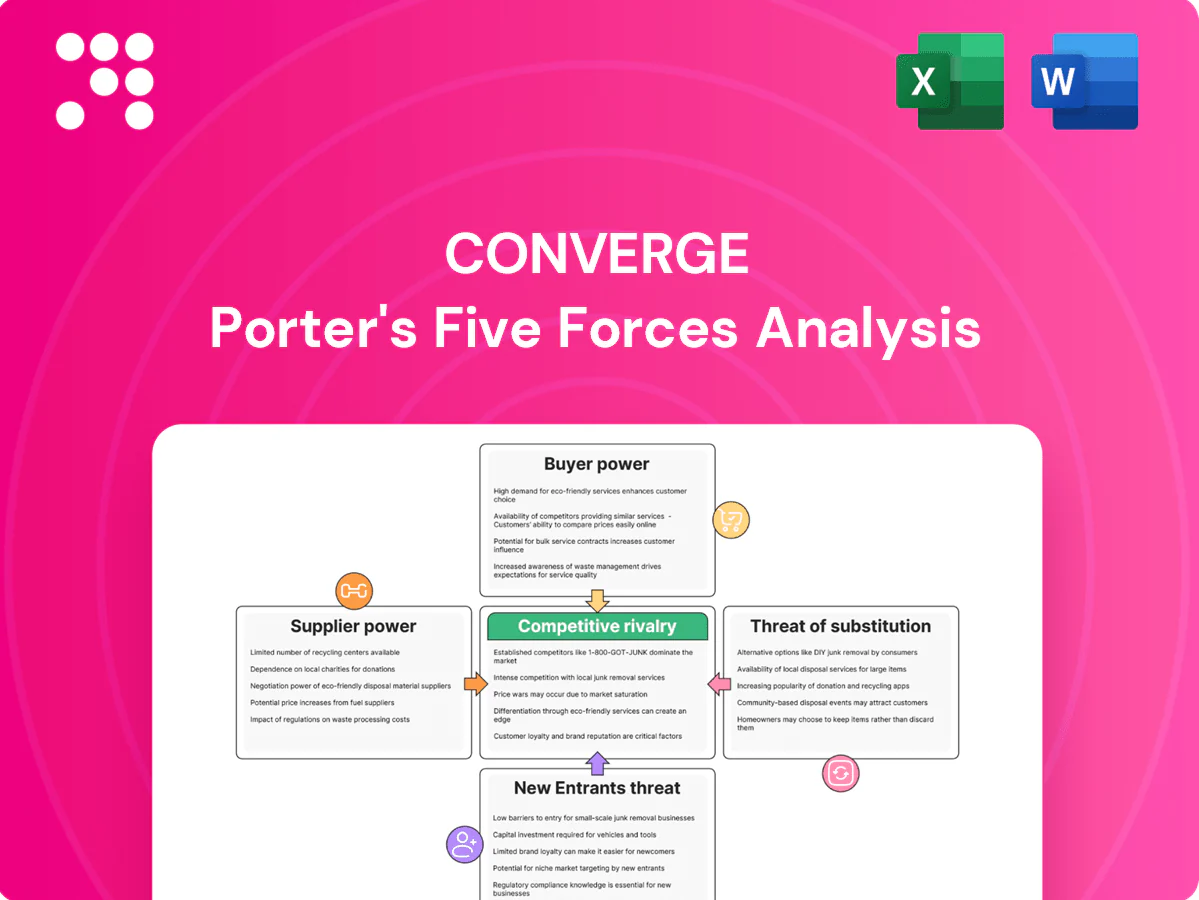
Converge Porter's Five Forces Analysis

Go Beyond the Preview—Access the Full Strategic Report
Converge faces moderate-to-high competitive intensity driven by aggressive pricing, growing broadband demand, and infrastructure scale advantages that shape supplier and buyer power, while substitutes and regulatory shifts present evolving threats. This brief snapshot outlines core dynamics but only scratches the surface. Unlock the full Porter's Five Forces Analysis for force-by-force ratings, visuals, and actionable insights to inform investment and strategy decisions.
Suppliers Bargaining Power

Dependence on fiber and equipment OEMs
Converge depends on a concentrated set of global suppliers such as Huawei, Nokia, ZTE and Cisco for fiber, OLT/ONT, routers and transmission gear, creating supplier concentration risk. Vendor switching is feasible but costly due to interoperability, certifications and network redesign, with typical lead times of 6–12 months. Geopolitical export controls and freight disruptions in 2023–24 constrained availability and pricing. High volume gives Converge negotiating leverage, but OEM differentiation sustains supplier power.
Right-of-way and infrastructure access
Access to poles, ducts, LGU permits and utility easements acts as a quasi-supplier constraint for Converge; municipal or utility hold-ups and higher attachment fees raise build costs and can extend rollout timelines from weeks to over six months. Long-term franchise rights, typically 25 years in the Philippines, mitigate but do not remove dependency. Negotiation leverage varies widely by locality and by project urgency, affecting capex per passing and time-to-revenue.

International bandwidth providers
Transit and subsea cable capacity is sourced from a small set of consortia and carriers, and over 95% of intercontinental data traffic travels via subsea cables (2024), concentrating supplier influence. Contracted capacity and peering mitigate exposure, yet prices can firm during regional bottlenecks. Landing station diversity reduces risk, but upgrades demand multi-party coordination, giving suppliers moderate bargaining power.

Power utilities and energy costs
Network uptime and PoP operations depend on reliable electricity; SLAs commonly target 99.9% uptime. Power tariffs and outages drive opex and can trigger SLA penalties, compressing margins. Backup power reduces outage risk but adds capex/opex. In the Philippines 2024 retail tariff averaged about 14 PHP/kWh, amplifying utilities' indirect supplier power.
- Reliability: SLAs 99.9%
- Cost impact: ~14 PHP/kWh (PH, 2024)
- Mitigation: backup = higher capex/opex
Specialized construction contractors
Specialized outside-plant contractors and splicers are critical for Converge fiber builds; tight labor markets and strict safety/compliance push contractor rates higher, with industry reports in 2024 noting wage premiums of 10-25% for certified fiber crews during peak demand. Multi-year frameworks (Converge capex guidance 2024 ~ PHP 60–70B) lock capacity but reduce flexibility, raising supplier bargaining power in rollout peaks.
- Skilled labor dependence
- Wage premiums 10–25% in 2024
- Multi-year contracts lock capacity
- Supplier power spikes in peak rollout
High OEM concentration, costly 6-12m switches; power ~14 PHP/kWh, labor +10-25%
Converge faces concentrated OEM suppliers (Huawei, Nokia, ZTE, Cisco), causing supplier concentration risk; switching is feasible but costly (6–12 months). Pole/permit variability can extend rollouts to >6 months despite 25-year franchises. Subsea/transit concentration and power costs (~14 PHP/kWh in 2024) plus labor premiums (10–25% in 2024) sustain moderate-to-high supplier power.
| Metric | 2024 |
|---|---|
| OEM concentration | High (top 4) |
| Switching time | 6–12 months |
| Power tariff | ~14 PHP/kWh |
| Labor premium | 10–25% |
| Capex guidance | PHP 60–70B |
What is included in the product
 Detailed Word Document
Uncovers key drivers of competition, customer influence, and market entry risks tailored to Converge, evaluating supplier and buyer power, threat of substitutes, and competitive rivalry to pinpoint strategic vulnerabilities and protective advantages.

 Customizable Excel Spreadsheet
A concise one-sheet Porter's Five Forces tool that visualizes and customizes competitive pressure with an intuitive radar chart—no macros or finance skills required, ready to drop into decks, dashboards, or boardroom reports.
Customers Bargaining Power

Price-sensitive residential base
Households in the Philippines remain highly price-sensitive, routinely comparing speed/price bundles and responding to promos; as of 2024 Converge reported roughly 3.1 million residential subscribers, intensifying comparison shopping. Frequent promotional speed bumps raise customer expectations and bargaining leverage. Churn penalties exist but are largely offset by aggressive acquisition offers and discounting. These dynamics sustain moderate buyer power.
Enterprise and wholesale negotiations
Corporate clients demand bespoke SLAs, redundancy and volume discounts (commonly 10–25%), driving competitive bidding among major carriers and niche players that strengthens buyer leverage. Longer contracts and multi-site deals (typically 3–5 years) trade lower prices for customer stickiness. Heavy customization raises switching costs but invites tighter scrutiny of ROI and SLA performance metrics.

Switching ease among fiber ISPs
Multiple fiber options in urban areas—often 2–4 providers per neighborhood—significantly lower switching barriers for Converge customers. ONT/device return requirements and remaining contract fees create friction but industry churn still occurs, with retail broadband churn commonly reported in the 1–3% monthly range. Bundled services and seamless digital onboarding make the customer experience portable and raise expectations. Net result: buyers can credibly threaten to switch.

Service quality and uptime expectations
Latency, jitter and outage responsiveness are highly visible in 2024, with real-time social media and crowd-sourced outage trackers amplifying customer voice and accelerating issue discovery; poor NPS now quickly translates into cancellations or downgrades, tightening the churn-revenue link; the reputational feedback loop materially empowers buyers and raises switching risk for Converge.
Limited rural alternatives
In less dense rural areas Converge often represents the only available fiber choice, materially reducing buyer bargaining power; alternatives revert to slower DSL, fixed wireless access, or satellite with higher effective costs and usage limits. Lock-in rises where network overlap is absent, so Converge’s geographic mix moderates overall customer leverage.
- Limited alternatives => lower buyer power
- DSL/FWA/satellite = slower/higher effective cost
- High lock-in where overlap absent
- Geographic mix reduces aggregate buyer leverage
Philippine fiber market: price-sensitive households, ~3.1M residential subs, urban 2–4 providers
Philippine households remain price-sensitive; Converge had ~3.1M residential subs in 2024, boosting comparison shopping. Urban neighborhoods typically host 2–4 fiber providers; retail churn runs ~1–3%/month. Corporate deals demand 10–25% volume discounts and 3–5 year SLAs, raising buyer leverage while rural exclusivity lowers it.
| Metric | 2024 |
|---|---|
| Residential subs | 3.1M |
| Urban providers/neighborhood | 2–4 |
| Retail churn | 1–3%/mo |
| Corp discounts | 10–25% |
Same Document Delivered
Converge Porter's Five Forces Analysis
This preview shows the exact Converge Porter's Five Forces Analysis you'll receive immediately after purchase—no placeholders. The document is fully formatted and ready to download and use. You’ll get this complete, professional analysis file instantly upon payment.

Go Beyond the Preview—Access the Full Strategic Report
Converge faces moderate-to-high competitive intensity driven by aggressive pricing, growing broadband demand, and infrastructure scale advantages that shape supplier and buyer power, while substitutes and regulatory shifts present evolving threats. This brief snapshot outlines core dynamics but only scratches the surface. Unlock the full Porter's Five Forces Analysis for force-by-force ratings, visuals, and actionable insights to inform investment and strategy decisions.
Suppliers Bargaining Power
Dependence on fiber and equipment OEMs
Converge depends on a concentrated set of global suppliers such as Huawei, Nokia, ZTE and Cisco for fiber, OLT/ONT, routers and transmission gear, creating supplier concentration risk. Vendor switching is feasible but costly due to interoperability, certifications and network redesign, with typical lead times of 6–12 months. Geopolitical export controls and freight disruptions in 2023–24 constrained availability and pricing. High volume gives Converge negotiating leverage, but OEM differentiation sustains supplier power.
Right-of-way and infrastructure access
Access to poles, ducts, LGU permits and utility easements acts as a quasi-supplier constraint for Converge; municipal or utility hold-ups and higher attachment fees raise build costs and can extend rollout timelines from weeks to over six months. Long-term franchise rights, typically 25 years in the Philippines, mitigate but do not remove dependency. Negotiation leverage varies widely by locality and by project urgency, affecting capex per passing and time-to-revenue.
International bandwidth providers
Transit and subsea cable capacity is sourced from a small set of consortia and carriers, and over 95% of intercontinental data traffic travels via subsea cables (2024), concentrating supplier influence. Contracted capacity and peering mitigate exposure, yet prices can firm during regional bottlenecks. Landing station diversity reduces risk, but upgrades demand multi-party coordination, giving suppliers moderate bargaining power.
Power utilities and energy costs
Network uptime and PoP operations depend on reliable electricity; SLAs commonly target 99.9% uptime. Power tariffs and outages drive opex and can trigger SLA penalties, compressing margins. Backup power reduces outage risk but adds capex/opex. In the Philippines 2024 retail tariff averaged about 14 PHP/kWh, amplifying utilities' indirect supplier power.
- Reliability: SLAs 99.9%
- Cost impact: ~14 PHP/kWh (PH, 2024)
- Mitigation: backup = higher capex/opex
Specialized construction contractors
Specialized outside-plant contractors and splicers are critical for Converge fiber builds; tight labor markets and strict safety/compliance push contractor rates higher, with industry reports in 2024 noting wage premiums of 10-25% for certified fiber crews during peak demand. Multi-year frameworks (Converge capex guidance 2024 ~ PHP 60–70B) lock capacity but reduce flexibility, raising supplier bargaining power in rollout peaks.
- Skilled labor dependence
- Wage premiums 10–25% in 2024
- Multi-year contracts lock capacity
- Supplier power spikes in peak rollout
High OEM concentration, costly 6-12m switches; power ~14 PHP/kWh, labor +10-25%
Converge faces concentrated OEM suppliers (Huawei, Nokia, ZTE, Cisco), causing supplier concentration risk; switching is feasible but costly (6–12 months). Pole/permit variability can extend rollouts to >6 months despite 25-year franchises. Subsea/transit concentration and power costs (~14 PHP/kWh in 2024) plus labor premiums (10–25% in 2024) sustain moderate-to-high supplier power.
| Metric | 2024 |
|---|---|
| OEM concentration | High (top 4) |
| Switching time | 6–12 months |
| Power tariff | ~14 PHP/kWh |
| Labor premium | 10–25% |
| Capex guidance | PHP 60–70B |
What is included in the product
Detailed Word Document
Uncovers key drivers of competition, customer influence, and market entry risks tailored to Converge, evaluating supplier and buyer power, threat of substitutes, and competitive rivalry to pinpoint strategic vulnerabilities and protective advantages.
Customizable Excel Spreadsheet
A concise one-sheet Porter's Five Forces tool that visualizes and customizes competitive pressure with an intuitive radar chart—no macros or finance skills required, ready to drop into decks, dashboards, or boardroom reports.
Customers Bargaining Power
Price-sensitive residential base
Households in the Philippines remain highly price-sensitive, routinely comparing speed/price bundles and responding to promos; as of 2024 Converge reported roughly 3.1 million residential subscribers, intensifying comparison shopping. Frequent promotional speed bumps raise customer expectations and bargaining leverage. Churn penalties exist but are largely offset by aggressive acquisition offers and discounting. These dynamics sustain moderate buyer power.
Enterprise and wholesale negotiations
Corporate clients demand bespoke SLAs, redundancy and volume discounts (commonly 10–25%), driving competitive bidding among major carriers and niche players that strengthens buyer leverage. Longer contracts and multi-site deals (typically 3–5 years) trade lower prices for customer stickiness. Heavy customization raises switching costs but invites tighter scrutiny of ROI and SLA performance metrics.
Switching ease among fiber ISPs
Multiple fiber options in urban areas—often 2–4 providers per neighborhood—significantly lower switching barriers for Converge customers. ONT/device return requirements and remaining contract fees create friction but industry churn still occurs, with retail broadband churn commonly reported in the 1–3% monthly range. Bundled services and seamless digital onboarding make the customer experience portable and raise expectations. Net result: buyers can credibly threaten to switch.
Service quality and uptime expectations
Latency, jitter and outage responsiveness are highly visible in 2024, with real-time social media and crowd-sourced outage trackers amplifying customer voice and accelerating issue discovery; poor NPS now quickly translates into cancellations or downgrades, tightening the churn-revenue link; the reputational feedback loop materially empowers buyers and raises switching risk for Converge.
Limited rural alternatives
In less dense rural areas Converge often represents the only available fiber choice, materially reducing buyer bargaining power; alternatives revert to slower DSL, fixed wireless access, or satellite with higher effective costs and usage limits. Lock-in rises where network overlap is absent, so Converge’s geographic mix moderates overall customer leverage.
- Limited alternatives => lower buyer power
- DSL/FWA/satellite = slower/higher effective cost
- High lock-in where overlap absent
- Geographic mix reduces aggregate buyer leverage
Philippine fiber market: price-sensitive households, ~3.1M residential subs, urban 2–4 providers
Philippine households remain price-sensitive; Converge had ~3.1M residential subs in 2024, boosting comparison shopping. Urban neighborhoods typically host 2–4 fiber providers; retail churn runs ~1–3%/month. Corporate deals demand 10–25% volume discounts and 3–5 year SLAs, raising buyer leverage while rural exclusivity lowers it.
| Metric | 2024 |
|---|---|
| Residential subs | 3.1M |
| Urban providers/neighborhood | 2–4 |
| Retail churn | 1–3%/mo |
| Corp discounts | 10–25% |
Same Document Delivered
Converge Porter's Five Forces Analysis
This preview shows the exact Converge Porter's Five Forces Analysis you'll receive immediately after purchase—no placeholders. The document is fully formatted and ready to download and use. You’ll get this complete, professional analysis file instantly upon payment.
Original: $10.00
-65%$10.00
$3.50Description
Go Beyond the Preview—Access the Full Strategic Report
Converge faces moderate-to-high competitive intensity driven by aggressive pricing, growing broadband demand, and infrastructure scale advantages that shape supplier and buyer power, while substitutes and regulatory shifts present evolving threats. This brief snapshot outlines core dynamics but only scratches the surface. Unlock the full Porter's Five Forces Analysis for force-by-force ratings, visuals, and actionable insights to inform investment and strategy decisions.
Suppliers Bargaining Power
Dependence on fiber and equipment OEMs
Converge depends on a concentrated set of global suppliers such as Huawei, Nokia, ZTE and Cisco for fiber, OLT/ONT, routers and transmission gear, creating supplier concentration risk. Vendor switching is feasible but costly due to interoperability, certifications and network redesign, with typical lead times of 6–12 months. Geopolitical export controls and freight disruptions in 2023–24 constrained availability and pricing. High volume gives Converge negotiating leverage, but OEM differentiation sustains supplier power.
Right-of-way and infrastructure access
Access to poles, ducts, LGU permits and utility easements acts as a quasi-supplier constraint for Converge; municipal or utility hold-ups and higher attachment fees raise build costs and can extend rollout timelines from weeks to over six months. Long-term franchise rights, typically 25 years in the Philippines, mitigate but do not remove dependency. Negotiation leverage varies widely by locality and by project urgency, affecting capex per passing and time-to-revenue.
International bandwidth providers
Transit and subsea cable capacity is sourced from a small set of consortia and carriers, and over 95% of intercontinental data traffic travels via subsea cables (2024), concentrating supplier influence. Contracted capacity and peering mitigate exposure, yet prices can firm during regional bottlenecks. Landing station diversity reduces risk, but upgrades demand multi-party coordination, giving suppliers moderate bargaining power.
Power utilities and energy costs
Network uptime and PoP operations depend on reliable electricity; SLAs commonly target 99.9% uptime. Power tariffs and outages drive opex and can trigger SLA penalties, compressing margins. Backup power reduces outage risk but adds capex/opex. In the Philippines 2024 retail tariff averaged about 14 PHP/kWh, amplifying utilities' indirect supplier power.
- Reliability: SLAs 99.9%
- Cost impact: ~14 PHP/kWh (PH, 2024)
- Mitigation: backup = higher capex/opex
Specialized construction contractors
Specialized outside-plant contractors and splicers are critical for Converge fiber builds; tight labor markets and strict safety/compliance push contractor rates higher, with industry reports in 2024 noting wage premiums of 10-25% for certified fiber crews during peak demand. Multi-year frameworks (Converge capex guidance 2024 ~ PHP 60–70B) lock capacity but reduce flexibility, raising supplier bargaining power in rollout peaks.
- Skilled labor dependence
- Wage premiums 10–25% in 2024
- Multi-year contracts lock capacity
- Supplier power spikes in peak rollout
High OEM concentration, costly 6-12m switches; power ~14 PHP/kWh, labor +10-25%
Converge faces concentrated OEM suppliers (Huawei, Nokia, ZTE, Cisco), causing supplier concentration risk; switching is feasible but costly (6–12 months). Pole/permit variability can extend rollouts to >6 months despite 25-year franchises. Subsea/transit concentration and power costs (~14 PHP/kWh in 2024) plus labor premiums (10–25% in 2024) sustain moderate-to-high supplier power.
| Metric | 2024 |
|---|---|
| OEM concentration | High (top 4) |
| Switching time | 6–12 months |
| Power tariff | ~14 PHP/kWh |
| Labor premium | 10–25% |
| Capex guidance | PHP 60–70B |
What is included in the product
Detailed Word Document
Uncovers key drivers of competition, customer influence, and market entry risks tailored to Converge, evaluating supplier and buyer power, threat of substitutes, and competitive rivalry to pinpoint strategic vulnerabilities and protective advantages.
Customizable Excel Spreadsheet
A concise one-sheet Porter's Five Forces tool that visualizes and customizes competitive pressure with an intuitive radar chart—no macros or finance skills required, ready to drop into decks, dashboards, or boardroom reports.
Customers Bargaining Power
Price-sensitive residential base
Households in the Philippines remain highly price-sensitive, routinely comparing speed/price bundles and responding to promos; as of 2024 Converge reported roughly 3.1 million residential subscribers, intensifying comparison shopping. Frequent promotional speed bumps raise customer expectations and bargaining leverage. Churn penalties exist but are largely offset by aggressive acquisition offers and discounting. These dynamics sustain moderate buyer power.
Enterprise and wholesale negotiations
Corporate clients demand bespoke SLAs, redundancy and volume discounts (commonly 10–25%), driving competitive bidding among major carriers and niche players that strengthens buyer leverage. Longer contracts and multi-site deals (typically 3–5 years) trade lower prices for customer stickiness. Heavy customization raises switching costs but invites tighter scrutiny of ROI and SLA performance metrics.
Switching ease among fiber ISPs
Multiple fiber options in urban areas—often 2–4 providers per neighborhood—significantly lower switching barriers for Converge customers. ONT/device return requirements and remaining contract fees create friction but industry churn still occurs, with retail broadband churn commonly reported in the 1–3% monthly range. Bundled services and seamless digital onboarding make the customer experience portable and raise expectations. Net result: buyers can credibly threaten to switch.
Service quality and uptime expectations
Latency, jitter and outage responsiveness are highly visible in 2024, with real-time social media and crowd-sourced outage trackers amplifying customer voice and accelerating issue discovery; poor NPS now quickly translates into cancellations or downgrades, tightening the churn-revenue link; the reputational feedback loop materially empowers buyers and raises switching risk for Converge.
Limited rural alternatives
In less dense rural areas Converge often represents the only available fiber choice, materially reducing buyer bargaining power; alternatives revert to slower DSL, fixed wireless access, or satellite with higher effective costs and usage limits. Lock-in rises where network overlap is absent, so Converge’s geographic mix moderates overall customer leverage.
- Limited alternatives => lower buyer power
- DSL/FWA/satellite = slower/higher effective cost
- High lock-in where overlap absent
- Geographic mix reduces aggregate buyer leverage
Philippine fiber market: price-sensitive households, ~3.1M residential subs, urban 2–4 providers
Philippine households remain price-sensitive; Converge had ~3.1M residential subs in 2024, boosting comparison shopping. Urban neighborhoods typically host 2–4 fiber providers; retail churn runs ~1–3%/month. Corporate deals demand 10–25% volume discounts and 3–5 year SLAs, raising buyer leverage while rural exclusivity lowers it.
| Metric | 2024 |
|---|---|
| Residential subs | 3.1M |
| Urban providers/neighborhood | 2–4 |
| Retail churn | 1–3%/mo |
| Corp discounts | 10–25% |
Same Document Delivered
Converge Porter's Five Forces Analysis
This preview shows the exact Converge Porter's Five Forces Analysis you'll receive immediately after purchase—no placeholders. The document is fully formatted and ready to download and use. You’ll get this complete, professional analysis file instantly upon payment.











