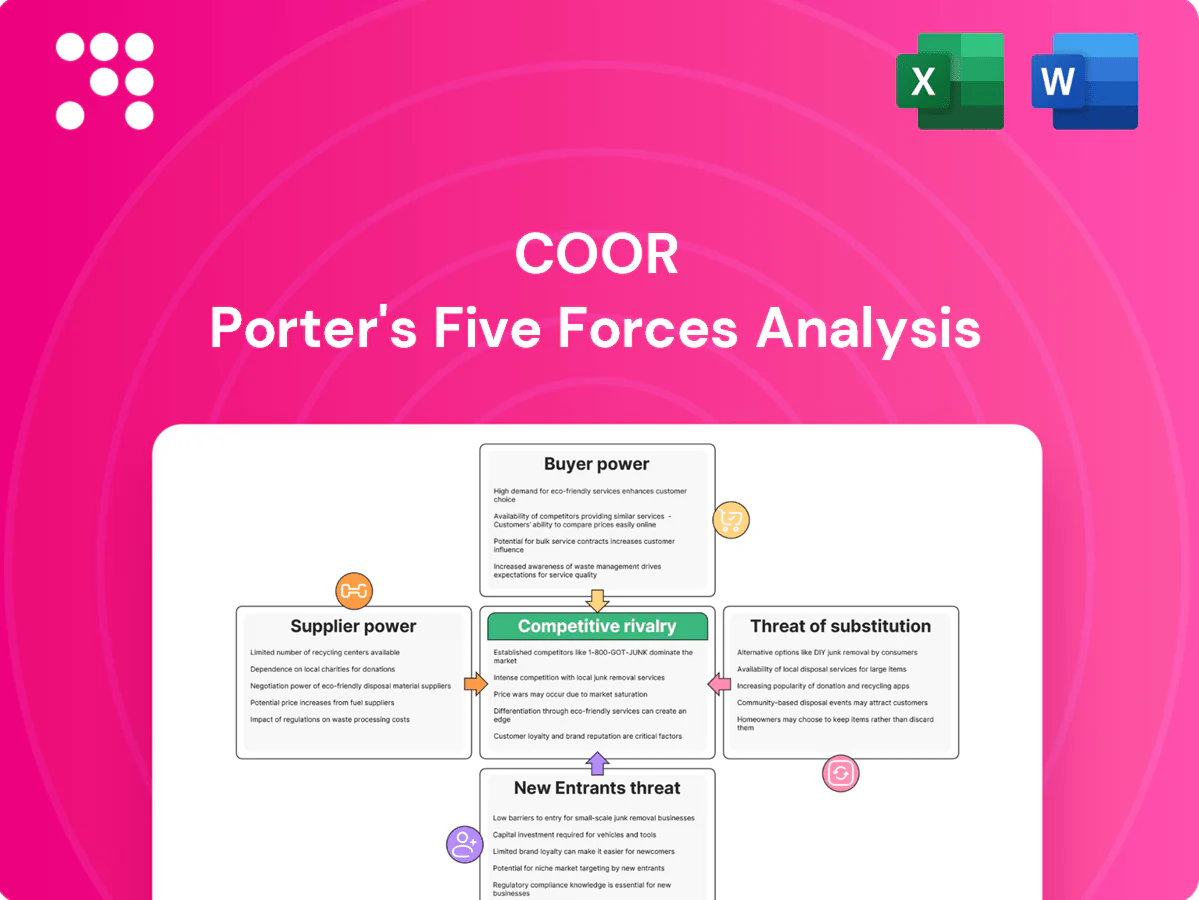
Coor Porter's Five Forces Analysis

Don't Miss the Bigger Picture
Coor faces moderate supplier power, intense buyer negotiation in price-sensitive contracts, and rising competitive rivalry from both regional players and integrated facility service providers. Barriers to entry are moderate due to scale and local networks, while substitute threats come from outsourcing alternatives and insourcing trends. This brief snapshot only scratches the surface. Unlock the full Porter's Five Forces Analysis to explore Coor’s competitive dynamics, market pressures, and strategic advantages in detail.
Suppliers Bargaining Power

Fragmented inputs
Most FM inputs—cleaning supplies, tools, PPE and consumables—are sourced from thousands of small-to-mid suppliers across the Nordics, limiting supplier pricing power. Coor routinely dual-sources and rebids contracts (often quarterly), and scale purchasing agreements in 2024 delivered unit-cost compressions of up to 10% on key SKUs. Substitution across equivalent brands is typically easy, keeping supplier leverage low.
Specialized tech vendors
As of 2024, vendor concentration in CAFM/CMMS, IoT sensors and analytics is notably higher, raising switching costs and enabling integration-driven data lock-in; this gives specialized suppliers commercial leverage. Coor reduces that risk through modular, API-first stacks to ease migration and interoperability. Long-term partnerships are used to trade lower price for guaranteed reliability and joint innovation.

Food and catering supply
Catering at Coor depends on regional wholesalers and fresh-produce networks that have seen consolidation, concentrating bargaining power but allowing framework agreements to secure volume; Coor reported group revenue of about SEK 13.5 billion in 2023, underscoring its purchasing scale.
Price volatility in food and energy can pass through to Coor when contracts are fixed-price, making menu engineering and index-linked clauses important risk tools.
Sustainability sourcing standards (e.g., ecolabels and origin requirements) narrow vendor pools, increasing supplier leverage in specific categories.

Staffing agencies dependence
In tight labor markets (US unemployment ~3.8% in 2024) reliance on temp agencies for peaks can raise labor costs and margins, with firms reporting higher agency markups during shortages and seasonality pressures.
Agencies gain leverage when demand spikes; building internal talent pools, cross-skilling and stable scheduling under union agreements reduces exposure and cost volatility.
- Risk: agency leverage in shortages
- Mitigation: internal pools & cross-skilling
- Stabilizer: unions + predictable schedules
Utilities and waste partners
Utilities and regulated waste handlers hold region-specific dominance with few alternatives, so their tariffs and compliance fees can squeeze margins on bundled FM contracts; Nord Pool system price averaged about 46 EUR/MWh in 2024, illustrating input cost pressure. Coor mitigates impact via pass-through clauses and secures preferential supplier rates through committed long-term volumes.
- Limited alternatives, regional dominance
- Tariffs/compliance pressure margins (Nord Pool ~46 EUR/MWh 2024)
- Pass-through clauses neutralize cost shifts
- Long-term volumes secure preferential rates
Sourcing cuts SKU costs 10%; energy 46 EUR/MWh lifts costs
Most FM inputs come from thousands of small suppliers, keeping supplier power low; scale sourcing cut key SKU unit costs up to 10% in 2024. CAFM/IoT vendor concentration raises switching costs, mitigated by API-first stacks and long-term partnerships. Catering consolidation and utilities pressure margins (Nord Pool ~46 EUR/MWh 2024) despite Coor's SEK 13.5bn revenue (2023); temp agency leverage rises with tight labor (US unemployment ~3.8% 2024).
| Category | 2023/24 Metric | Impact |
|---|---|---|
| Revenue | SEK 13.5bn (2023) | Purchasing scale |
| Energy | Nord Pool ~46 EUR/MWh (2024) | Input cost pressure |
| Labor | US unemployment ~3.8% (2024) | Agency leverage |
| Procurement | Up to 10% SKU cost cuts (2024) | Reduced supplier power |
What is included in the product
 Detailed Word Document
Uncovers key drivers of competition, buyer and supplier power, substitutes, new-entry risks and rivalry tailored to Coor’s service-market position. Provides industry-backed strategic commentary and editable findings for reports or decks.

 Customizable Excel Spreadsheet
A concise Coor Porter's Five Forces one-sheet—visualize and adjust competitive pressures instantly to guide strategic decisions and ease stakeholder communication.
Customers Bargaining Power

Large, sophisticated buyers
Large, sophisticated buyers run formal 2024 tenders with strict KPIs, giving corporate and public-sector clients strong leverage over suppliers. Benchmarking and e-auctions in 2024 intensified price pressure, forcing Coor to shift commercial focus from inputs to measurable outcomes. Referenceability and audited savings remain key defenses against pure price competition, supporting contract retention and margin protection.
Contract scale and duration
Multi-year, multi-site contracts (typically 3–7 years) boost total deal value but buyers commonly trade volume for discounts in the 5–15% range. Long durations can compress provider margins if indexation is weak given 2023 US CPI at 3.4% and ongoing energy price volatility. Robust CPI/energy indexation and gain-share mechanics balance risk, while formal governance cadences preserve scope and contract price.

Switching costs
Transitioning FM providers requires mobilization effort, data migration and operational risk, with 2024 industry surveys showing average mobilization of 4.2 months and migration costs around 7% of annual contract value. These moderate switching costs soften buyer power post-implementation. Strong SLA performance and embedded teams increase stickiness. Poor performance can reverse switching costs rapidly, with transition incidents reported in 12% of cases.

Service bundling
Integrated service bundling reduces buyer coordination costs and often lowers buyer leverage; 2024 procurement surveys showed roughly 60% preference for bundled FM solutions. Cross-service synergies obscure apples-to-apples pricing, raising switching costs for challengers. Buyers still unbundle when contract transparency is low, while clear value attribution supports sustained bundle premiums.
- reduced coordination costs
- 60% buyer preference (2024)
- synergy-driven pricing opacity
- transparency prevents unbundling
ESG and compliance demands
- CSRD scope ~50,000 firms (2024)
- Monetize via green KPIs and shared investments
- Certification (ISO 14001/45001) = margin protection
Tenders/e-auctions drive 5–15% cuts; multi-year deals lock switching costs
Large 2024 buyers use formal tenders and e-auctions, driving 5–15% discounting and shifting focus to outcome KPIs. Multi-year contracts (3–7 yrs) raise switching costs despite 4.2-month average mobilization and ~7% migration cost of ACV. ESG/CSRD (≈50,000 firms in scope 2024) increases compliance leverage; ISO certification protects margins.
| Metric | 2024 value |
|---|---|
| Buyer preference for bundles | 60% |
| Typical discounts | 5–15% |
| Mobilization | 4.2 months |
| Migration cost | ~7% ACV |
| CSRD scope | ≈50,000 firms |
Same Document Delivered
Coor Porter's Five Forces Analysis
This preview shows the exact Coor Porter's Five Forces analysis you'll receive immediately after purchase—fully written, formatted, and ready for use. No mockups or placeholders; the file available for download is precisely this document. Instant access upon payment.

Don't Miss the Bigger Picture
Coor faces moderate supplier power, intense buyer negotiation in price-sensitive contracts, and rising competitive rivalry from both regional players and integrated facility service providers. Barriers to entry are moderate due to scale and local networks, while substitute threats come from outsourcing alternatives and insourcing trends. This brief snapshot only scratches the surface. Unlock the full Porter's Five Forces Analysis to explore Coor’s competitive dynamics, market pressures, and strategic advantages in detail.
Suppliers Bargaining Power
Fragmented inputs
Most FM inputs—cleaning supplies, tools, PPE and consumables—are sourced from thousands of small-to-mid suppliers across the Nordics, limiting supplier pricing power. Coor routinely dual-sources and rebids contracts (often quarterly), and scale purchasing agreements in 2024 delivered unit-cost compressions of up to 10% on key SKUs. Substitution across equivalent brands is typically easy, keeping supplier leverage low.
Specialized tech vendors
As of 2024, vendor concentration in CAFM/CMMS, IoT sensors and analytics is notably higher, raising switching costs and enabling integration-driven data lock-in; this gives specialized suppliers commercial leverage. Coor reduces that risk through modular, API-first stacks to ease migration and interoperability. Long-term partnerships are used to trade lower price for guaranteed reliability and joint innovation.
Food and catering supply
Catering at Coor depends on regional wholesalers and fresh-produce networks that have seen consolidation, concentrating bargaining power but allowing framework agreements to secure volume; Coor reported group revenue of about SEK 13.5 billion in 2023, underscoring its purchasing scale.
Price volatility in food and energy can pass through to Coor when contracts are fixed-price, making menu engineering and index-linked clauses important risk tools.
Sustainability sourcing standards (e.g., ecolabels and origin requirements) narrow vendor pools, increasing supplier leverage in specific categories.
Staffing agencies dependence
In tight labor markets (US unemployment ~3.8% in 2024) reliance on temp agencies for peaks can raise labor costs and margins, with firms reporting higher agency markups during shortages and seasonality pressures.
Agencies gain leverage when demand spikes; building internal talent pools, cross-skilling and stable scheduling under union agreements reduces exposure and cost volatility.
- Risk: agency leverage in shortages
- Mitigation: internal pools & cross-skilling
- Stabilizer: unions + predictable schedules
Utilities and waste partners
Utilities and regulated waste handlers hold region-specific dominance with few alternatives, so their tariffs and compliance fees can squeeze margins on bundled FM contracts; Nord Pool system price averaged about 46 EUR/MWh in 2024, illustrating input cost pressure. Coor mitigates impact via pass-through clauses and secures preferential supplier rates through committed long-term volumes.
- Limited alternatives, regional dominance
- Tariffs/compliance pressure margins (Nord Pool ~46 EUR/MWh 2024)
- Pass-through clauses neutralize cost shifts
- Long-term volumes secure preferential rates
Sourcing cuts SKU costs 10%; energy 46 EUR/MWh lifts costs
Most FM inputs come from thousands of small suppliers, keeping supplier power low; scale sourcing cut key SKU unit costs up to 10% in 2024. CAFM/IoT vendor concentration raises switching costs, mitigated by API-first stacks and long-term partnerships. Catering consolidation and utilities pressure margins (Nord Pool ~46 EUR/MWh 2024) despite Coor's SEK 13.5bn revenue (2023); temp agency leverage rises with tight labor (US unemployment ~3.8% 2024).
| Category | 2023/24 Metric | Impact |
|---|---|---|
| Revenue | SEK 13.5bn (2023) | Purchasing scale |
| Energy | Nord Pool ~46 EUR/MWh (2024) | Input cost pressure |
| Labor | US unemployment ~3.8% (2024) | Agency leverage |
| Procurement | Up to 10% SKU cost cuts (2024) | Reduced supplier power |
What is included in the product
Detailed Word Document
Uncovers key drivers of competition, buyer and supplier power, substitutes, new-entry risks and rivalry tailored to Coor’s service-market position. Provides industry-backed strategic commentary and editable findings for reports or decks.
Customizable Excel Spreadsheet
A concise Coor Porter's Five Forces one-sheet—visualize and adjust competitive pressures instantly to guide strategic decisions and ease stakeholder communication.
Customers Bargaining Power
Large, sophisticated buyers
Large, sophisticated buyers run formal 2024 tenders with strict KPIs, giving corporate and public-sector clients strong leverage over suppliers. Benchmarking and e-auctions in 2024 intensified price pressure, forcing Coor to shift commercial focus from inputs to measurable outcomes. Referenceability and audited savings remain key defenses against pure price competition, supporting contract retention and margin protection.
Contract scale and duration
Multi-year, multi-site contracts (typically 3–7 years) boost total deal value but buyers commonly trade volume for discounts in the 5–15% range. Long durations can compress provider margins if indexation is weak given 2023 US CPI at 3.4% and ongoing energy price volatility. Robust CPI/energy indexation and gain-share mechanics balance risk, while formal governance cadences preserve scope and contract price.
Switching costs
Transitioning FM providers requires mobilization effort, data migration and operational risk, with 2024 industry surveys showing average mobilization of 4.2 months and migration costs around 7% of annual contract value. These moderate switching costs soften buyer power post-implementation. Strong SLA performance and embedded teams increase stickiness. Poor performance can reverse switching costs rapidly, with transition incidents reported in 12% of cases.
Service bundling
Integrated service bundling reduces buyer coordination costs and often lowers buyer leverage; 2024 procurement surveys showed roughly 60% preference for bundled FM solutions. Cross-service synergies obscure apples-to-apples pricing, raising switching costs for challengers. Buyers still unbundle when contract transparency is low, while clear value attribution supports sustained bundle premiums.
- reduced coordination costs
- 60% buyer preference (2024)
- synergy-driven pricing opacity
- transparency prevents unbundling
ESG and compliance demands
- CSRD scope ~50,000 firms (2024)
- Monetize via green KPIs and shared investments
- Certification (ISO 14001/45001) = margin protection
Tenders/e-auctions drive 5–15% cuts; multi-year deals lock switching costs
Large 2024 buyers use formal tenders and e-auctions, driving 5–15% discounting and shifting focus to outcome KPIs. Multi-year contracts (3–7 yrs) raise switching costs despite 4.2-month average mobilization and ~7% migration cost of ACV. ESG/CSRD (≈50,000 firms in scope 2024) increases compliance leverage; ISO certification protects margins.
| Metric | 2024 value |
|---|---|
| Buyer preference for bundles | 60% |
| Typical discounts | 5–15% |
| Mobilization | 4.2 months |
| Migration cost | ~7% ACV |
| CSRD scope | ≈50,000 firms |
Same Document Delivered
Coor Porter's Five Forces Analysis
This preview shows the exact Coor Porter's Five Forces analysis you'll receive immediately after purchase—fully written, formatted, and ready for use. No mockups or placeholders; the file available for download is precisely this document. Instant access upon payment.
Description
Don't Miss the Bigger Picture
Coor faces moderate supplier power, intense buyer negotiation in price-sensitive contracts, and rising competitive rivalry from both regional players and integrated facility service providers. Barriers to entry are moderate due to scale and local networks, while substitute threats come from outsourcing alternatives and insourcing trends. This brief snapshot only scratches the surface. Unlock the full Porter's Five Forces Analysis to explore Coor’s competitive dynamics, market pressures, and strategic advantages in detail.
Suppliers Bargaining Power
Fragmented inputs
Most FM inputs—cleaning supplies, tools, PPE and consumables—are sourced from thousands of small-to-mid suppliers across the Nordics, limiting supplier pricing power. Coor routinely dual-sources and rebids contracts (often quarterly), and scale purchasing agreements in 2024 delivered unit-cost compressions of up to 10% on key SKUs. Substitution across equivalent brands is typically easy, keeping supplier leverage low.
Specialized tech vendors
As of 2024, vendor concentration in CAFM/CMMS, IoT sensors and analytics is notably higher, raising switching costs and enabling integration-driven data lock-in; this gives specialized suppliers commercial leverage. Coor reduces that risk through modular, API-first stacks to ease migration and interoperability. Long-term partnerships are used to trade lower price for guaranteed reliability and joint innovation.
Food and catering supply
Catering at Coor depends on regional wholesalers and fresh-produce networks that have seen consolidation, concentrating bargaining power but allowing framework agreements to secure volume; Coor reported group revenue of about SEK 13.5 billion in 2023, underscoring its purchasing scale.
Price volatility in food and energy can pass through to Coor when contracts are fixed-price, making menu engineering and index-linked clauses important risk tools.
Sustainability sourcing standards (e.g., ecolabels and origin requirements) narrow vendor pools, increasing supplier leverage in specific categories.
Staffing agencies dependence
In tight labor markets (US unemployment ~3.8% in 2024) reliance on temp agencies for peaks can raise labor costs and margins, with firms reporting higher agency markups during shortages and seasonality pressures.
Agencies gain leverage when demand spikes; building internal talent pools, cross-skilling and stable scheduling under union agreements reduces exposure and cost volatility.
- Risk: agency leverage in shortages
- Mitigation: internal pools & cross-skilling
- Stabilizer: unions + predictable schedules
Utilities and waste partners
Utilities and regulated waste handlers hold region-specific dominance with few alternatives, so their tariffs and compliance fees can squeeze margins on bundled FM contracts; Nord Pool system price averaged about 46 EUR/MWh in 2024, illustrating input cost pressure. Coor mitigates impact via pass-through clauses and secures preferential supplier rates through committed long-term volumes.
- Limited alternatives, regional dominance
- Tariffs/compliance pressure margins (Nord Pool ~46 EUR/MWh 2024)
- Pass-through clauses neutralize cost shifts
- Long-term volumes secure preferential rates
Sourcing cuts SKU costs 10%; energy 46 EUR/MWh lifts costs
Most FM inputs come from thousands of small suppliers, keeping supplier power low; scale sourcing cut key SKU unit costs up to 10% in 2024. CAFM/IoT vendor concentration raises switching costs, mitigated by API-first stacks and long-term partnerships. Catering consolidation and utilities pressure margins (Nord Pool ~46 EUR/MWh 2024) despite Coor's SEK 13.5bn revenue (2023); temp agency leverage rises with tight labor (US unemployment ~3.8% 2024).
| Category | 2023/24 Metric | Impact |
|---|---|---|
| Revenue | SEK 13.5bn (2023) | Purchasing scale |
| Energy | Nord Pool ~46 EUR/MWh (2024) | Input cost pressure |
| Labor | US unemployment ~3.8% (2024) | Agency leverage |
| Procurement | Up to 10% SKU cost cuts (2024) | Reduced supplier power |
What is included in the product
Detailed Word Document
Uncovers key drivers of competition, buyer and supplier power, substitutes, new-entry risks and rivalry tailored to Coor’s service-market position. Provides industry-backed strategic commentary and editable findings for reports or decks.
Customizable Excel Spreadsheet
A concise Coor Porter's Five Forces one-sheet—visualize and adjust competitive pressures instantly to guide strategic decisions and ease stakeholder communication.
Customers Bargaining Power
Large, sophisticated buyers
Large, sophisticated buyers run formal 2024 tenders with strict KPIs, giving corporate and public-sector clients strong leverage over suppliers. Benchmarking and e-auctions in 2024 intensified price pressure, forcing Coor to shift commercial focus from inputs to measurable outcomes. Referenceability and audited savings remain key defenses against pure price competition, supporting contract retention and margin protection.
Contract scale and duration
Multi-year, multi-site contracts (typically 3–7 years) boost total deal value but buyers commonly trade volume for discounts in the 5–15% range. Long durations can compress provider margins if indexation is weak given 2023 US CPI at 3.4% and ongoing energy price volatility. Robust CPI/energy indexation and gain-share mechanics balance risk, while formal governance cadences preserve scope and contract price.
Switching costs
Transitioning FM providers requires mobilization effort, data migration and operational risk, with 2024 industry surveys showing average mobilization of 4.2 months and migration costs around 7% of annual contract value. These moderate switching costs soften buyer power post-implementation. Strong SLA performance and embedded teams increase stickiness. Poor performance can reverse switching costs rapidly, with transition incidents reported in 12% of cases.
Service bundling
Integrated service bundling reduces buyer coordination costs and often lowers buyer leverage; 2024 procurement surveys showed roughly 60% preference for bundled FM solutions. Cross-service synergies obscure apples-to-apples pricing, raising switching costs for challengers. Buyers still unbundle when contract transparency is low, while clear value attribution supports sustained bundle premiums.
- reduced coordination costs
- 60% buyer preference (2024)
- synergy-driven pricing opacity
- transparency prevents unbundling
ESG and compliance demands
- CSRD scope ~50,000 firms (2024)
- Monetize via green KPIs and shared investments
- Certification (ISO 14001/45001) = margin protection
Tenders/e-auctions drive 5–15% cuts; multi-year deals lock switching costs
Large 2024 buyers use formal tenders and e-auctions, driving 5–15% discounting and shifting focus to outcome KPIs. Multi-year contracts (3–7 yrs) raise switching costs despite 4.2-month average mobilization and ~7% migration cost of ACV. ESG/CSRD (≈50,000 firms in scope 2024) increases compliance leverage; ISO certification protects margins.
| Metric | 2024 value |
|---|---|
| Buyer preference for bundles | 60% |
| Typical discounts | 5–15% |
| Mobilization | 4.2 months |
| Migration cost | ~7% ACV |
| CSRD scope | ≈50,000 firms |
Same Document Delivered
Coor Porter's Five Forces Analysis
This preview shows the exact Coor Porter's Five Forces analysis you'll receive immediately after purchase—fully written, formatted, and ready for use. No mockups or placeholders; the file available for download is precisely this document. Instant access upon payment.











