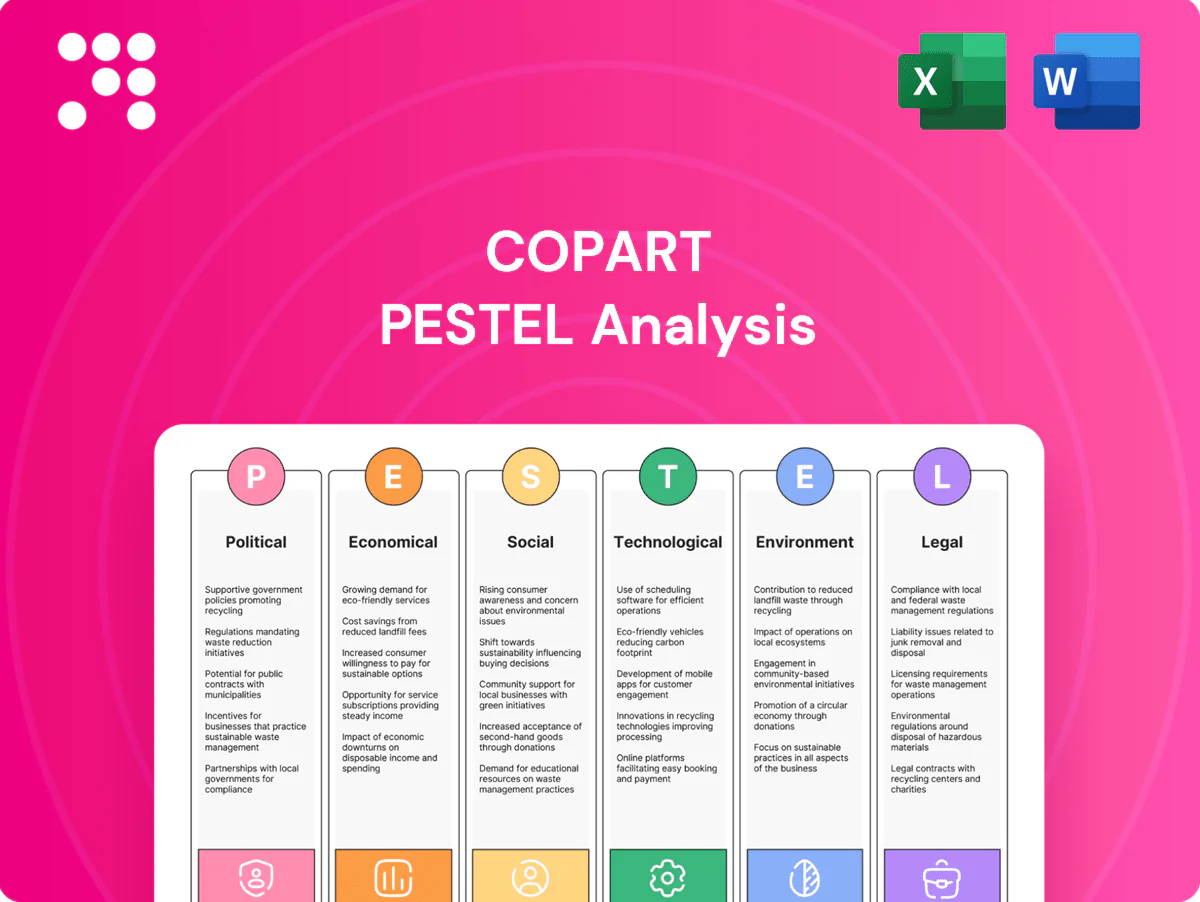
Copart PESTLE Analysis

Your Competitive Advantage Starts with This Report
Discover how political, economic, social, technological, legal, and environmental forces are reshaping Copart’s prospects in our concise PESTLE snapshot—perfect for investors and strategists who need fast, actionable context. Use these insights to anticipate risks, identify growth levers, and refine your competitive plan. Purchase the full PESTLE for a complete, editable breakdown you can apply immediately.
Political factors

Trade and export policies
Changes in import/export rules for used and salvage vehicles directly affect Copart by altering cross-border buyer participation and price discovery; Copart reported FY2024 revenue of about $2.9 billion and operates in 11 countries with 200+ facilities, increasing exposure to regulatory shifts. Tariffs, sanctions and port bottlenecks can slow turnover and raise transaction costs, so Copart must diversify logistics lanes and tailor listings to compliance constraints. Stable trade relations support higher international sell-through rates and improved pricing transparency.
Local zoning and permitting
Yard siting and expansion for Copart, which operates in 11 countries with over 200 facilities and reported about $3.6 billion in revenue in FY2024, depend on municipal and county zoning approvals. Political support for industrial versus residential priorities can accelerate or stall capacity growth, directly affecting throughput at high-volume yards. Copart needs proactive community engagement and site remediation plans to secure permits; delays increase carrying costs and constrain volume growth.

Infrastructure and disaster funding
Federal infrastructure spending under the $1.2 trillion Bipartisan Infrastructure Law and disaster payouts matter for Copart because NOAA recorded 18 separate billion-dollar weather/climate disasters in 2023 totaling about $88 billion, driving higher total-loss volumes and transportation flows.
Post-storm buyback programs can sharply increase supply that Copart processes and auctions, while timely public funding for roads and ports shortens yard cycle times and lowers logistics costs.
Policy uncertainty around disaster funding and repair grants creates volatile supply spikes and troughs that complicate inventory and revenue forecasting for salvage operators.

EV incentives and fleet policies
Government EV subsidies such as the US federal tax credit up to 7,500 USD and the EU 2035 phase-out of new ICE cars are shifting auction inflows toward electrified vehicles; global EV stock surpassed 30 million by 2024, increasing Copart's EV intake and need for high-voltage handling and battery-testing capabilities. Copart must align facility upgrades and technician training with policy timelines, while political reversals could slow EV arrivals and change residual-value trajectories.
- Policy: US tax credit up to 7,500 USD
- Mandate: EU 2035 ICE phase-out
- Scale: global EV stock >30M (2024)
- Risk: policy reversals alter inventory mix
International market entry
Foreign investment rules and political stability directly shape Copart’s international market entry; Copart operates in 11 countries with over 200 facilities, so restrictions on land ownership or digital platforms can materially limit penetration and platform scalability. Forming local partnerships helps mitigate political risk and speeds licensing, while country selection influences growth potential, compliance costs, and buyer liquidity.
Trade rules, EV policy and disasters reshape yards across 11 countries
Trade rules, tariffs and port delays affect cross-border buyer participation and pricing; Copart operates in 11 countries with 200+ facilities and reported about $3.6B revenue in FY2024. Zoning, permits and local political risk shape yard expansion and carrying costs. Disaster funding, infrastructure bills and EV policy (US tax credit up to 7,500 USD; EU 2035 ICE phase-out) drive supply and facility needs.
| Metric | Value |
|---|---|
| Countries / Facilities | 11 / 200+ |
| FY2024 revenue | about 3.6B USD |
| Noaa 2023 disasters | 18 events, 88B USD |
| Global EV stock (2024) | >30M |
What is included in the product
 Detailed Word Document
Explores how Political, Economic, Social, Technological, Environmental and Legal forces uniquely affect Copart, with data-backed trends and region-specific regulatory context; designed for executives and investors, offering forward-looking insights and ready-to-use findings for strategy, risk mitigation, and funding decisions.

 Customizable Excel Spreadsheet
Condenses Copart’s PESTLE into a slide-ready summary that clarifies regulatory, technological, and market risks for fast decision-making, team alignment, and seamless inclusion in reports or presentations.
Economic factors

Used vehicle price cycles
Macro swings in used-car prices directly affect seller recovery values and Copart fee revenue; the Manheim Used Vehicle Value Index fell roughly 25–30% from its Nov 2021 peak through 2023 before stabilizing into 2024–25, compressing recoveries in down cycles.
Tight supply periods lift bids and margins, while gluts drive price compression, making real-time monitoring of wholesale indices essential to adjust fee tiers and remarketing cadence.
Price elasticity differs by segment: economy cars show higher elasticity and faster price swings, while specialty and classic vehicles retain value, supporting differentiated fee and inventory strategies.
Interest rates and credit
Higher rates raise buyer financing costs, tempering bidding intensity; US federal funds at 5.25–5.50% (June 2025) and average used-car loan rates near 11% squeeze demand. Credit availability for rebuilders, exporters and dealers governs sell-through velocity—dealer floorplan stress rose in 2024. Copart offsets via broader buyer reach and flexible payment plans. Rate cycles alter insurers' total-loss economics, impacting volumes and reserves.

Insurance claim frequency
Economy-wide driving patterns and repair-cost inflation have raised total-loss rates; Copart processed about 5.8 million vehicles in FY2024 and generated roughly $3.9B in revenue, so higher parts and labor costs push more vehicles to salvage auctions, benefiting volume but requiring tighter processing capacity and storage management; cyclical downturns in 2024–25 may curb discretionary buyer demand, pressuring per-unit margins.

Fuel prices and mix
Volatile fuel costs shift demand from trucks toward compacts and hybrids; U.S. average regular gasoline in 2024 was about $3.50/gal (EIA), with regional spreads often exceeding $0.80/gal, altering buyer priorities and salvage valuations. Buyers recalibrate bidding strategies, changing relative values across categories while Copart’s broad platform and 2,300+ locations sustain cross-segment liquidity and quick price discovery.
- Fuel-led demand swings: compact/hybrid vs truck
- Bidding shifts change category price differentials
- Platform breadth sustains liquidity and price discovery
- Regional fuel dynamics create localized pricing patterns
Foreign exchange exposure
Global buyers often fund Copart purchases in local currencies, so FX rates directly affect affordability; Copart operates across 11 countries, amplifying exposure. A stronger USD in 2024 reduced purchasing power for many international bidders and compressed cross-border prices. Copart’s hedging and multi-currency settlement options help stabilize participation, while geographic diversification lowers single-currency risk.
- USD strength 2024: reduced international bid volumes
- Presence in 11 countries: diversifies FX risk
- Hedging + multi-currency settlements: stabilize revenues
Trade rules, EV policy and disasters reshape yards across 11 countries
Used-car index fell ~25–30% from Nov 2021 to 2023, compressing recoveries; higher rates (Fed funds 5.25–5.50% Jun 2025) and ~11% average used-car loan rates have damped bidding. Copart processed ~5.8M vehicles and generated ~$3.9B revenue in FY2024; 2,300+ locations across 11 countries sustain liquidity despite USD strength and regional fuel swings (~$3.50/gal 2024).
| Metric | Value |
|---|---|
| Used-vehicle index decline | ~25–30% |
| Fed funds (Jun 2025) | 5.25–5.50% |
| Avg used loan rate | ~11% |
| Vehicles processed FY2024 | ~5.8M |
| Revenue FY2024 | $3.9B |
| Locations | 2,300+ |
| Countries | 11 |
| Avg gas (2024) | $3.50/gal |
What You See Is What You Get
Copart PESTLE Analysis
The preview shown here is the exact Copart PESTLE Analysis you’ll receive after purchase—fully formatted and ready to use. The content, structure, and layout visible now are identical to the downloadable file you’ll get immediately after checkout. No placeholders or teasers—this is the final, professionally structured document you’ll own.

Your Competitive Advantage Starts with This Report
Discover how political, economic, social, technological, legal, and environmental forces are reshaping Copart’s prospects in our concise PESTLE snapshot—perfect for investors and strategists who need fast, actionable context. Use these insights to anticipate risks, identify growth levers, and refine your competitive plan. Purchase the full PESTLE for a complete, editable breakdown you can apply immediately.
Political factors
Trade and export policies
Changes in import/export rules for used and salvage vehicles directly affect Copart by altering cross-border buyer participation and price discovery; Copart reported FY2024 revenue of about $2.9 billion and operates in 11 countries with 200+ facilities, increasing exposure to regulatory shifts. Tariffs, sanctions and port bottlenecks can slow turnover and raise transaction costs, so Copart must diversify logistics lanes and tailor listings to compliance constraints. Stable trade relations support higher international sell-through rates and improved pricing transparency.
Local zoning and permitting
Yard siting and expansion for Copart, which operates in 11 countries with over 200 facilities and reported about $3.6 billion in revenue in FY2024, depend on municipal and county zoning approvals. Political support for industrial versus residential priorities can accelerate or stall capacity growth, directly affecting throughput at high-volume yards. Copart needs proactive community engagement and site remediation plans to secure permits; delays increase carrying costs and constrain volume growth.
Infrastructure and disaster funding
Federal infrastructure spending under the $1.2 trillion Bipartisan Infrastructure Law and disaster payouts matter for Copart because NOAA recorded 18 separate billion-dollar weather/climate disasters in 2023 totaling about $88 billion, driving higher total-loss volumes and transportation flows.
Post-storm buyback programs can sharply increase supply that Copart processes and auctions, while timely public funding for roads and ports shortens yard cycle times and lowers logistics costs.
Policy uncertainty around disaster funding and repair grants creates volatile supply spikes and troughs that complicate inventory and revenue forecasting for salvage operators.
EV incentives and fleet policies
Government EV subsidies such as the US federal tax credit up to 7,500 USD and the EU 2035 phase-out of new ICE cars are shifting auction inflows toward electrified vehicles; global EV stock surpassed 30 million by 2024, increasing Copart's EV intake and need for high-voltage handling and battery-testing capabilities. Copart must align facility upgrades and technician training with policy timelines, while political reversals could slow EV arrivals and change residual-value trajectories.
- Policy: US tax credit up to 7,500 USD
- Mandate: EU 2035 ICE phase-out
- Scale: global EV stock >30M (2024)
- Risk: policy reversals alter inventory mix
International market entry
Foreign investment rules and political stability directly shape Copart’s international market entry; Copart operates in 11 countries with over 200 facilities, so restrictions on land ownership or digital platforms can materially limit penetration and platform scalability. Forming local partnerships helps mitigate political risk and speeds licensing, while country selection influences growth potential, compliance costs, and buyer liquidity.
Trade rules, EV policy and disasters reshape yards across 11 countries
Trade rules, tariffs and port delays affect cross-border buyer participation and pricing; Copart operates in 11 countries with 200+ facilities and reported about $3.6B revenue in FY2024. Zoning, permits and local political risk shape yard expansion and carrying costs. Disaster funding, infrastructure bills and EV policy (US tax credit up to 7,500 USD; EU 2035 ICE phase-out) drive supply and facility needs.
| Metric | Value |
|---|---|
| Countries / Facilities | 11 / 200+ |
| FY2024 revenue | about 3.6B USD |
| Noaa 2023 disasters | 18 events, 88B USD |
| Global EV stock (2024) | >30M |
What is included in the product
Detailed Word Document
Explores how Political, Economic, Social, Technological, Environmental and Legal forces uniquely affect Copart, with data-backed trends and region-specific regulatory context; designed for executives and investors, offering forward-looking insights and ready-to-use findings for strategy, risk mitigation, and funding decisions.
Customizable Excel Spreadsheet
Condenses Copart’s PESTLE into a slide-ready summary that clarifies regulatory, technological, and market risks for fast decision-making, team alignment, and seamless inclusion in reports or presentations.
Economic factors
Used vehicle price cycles
Macro swings in used-car prices directly affect seller recovery values and Copart fee revenue; the Manheim Used Vehicle Value Index fell roughly 25–30% from its Nov 2021 peak through 2023 before stabilizing into 2024–25, compressing recoveries in down cycles.
Tight supply periods lift bids and margins, while gluts drive price compression, making real-time monitoring of wholesale indices essential to adjust fee tiers and remarketing cadence.
Price elasticity differs by segment: economy cars show higher elasticity and faster price swings, while specialty and classic vehicles retain value, supporting differentiated fee and inventory strategies.
Interest rates and credit
Higher rates raise buyer financing costs, tempering bidding intensity; US federal funds at 5.25–5.50% (June 2025) and average used-car loan rates near 11% squeeze demand. Credit availability for rebuilders, exporters and dealers governs sell-through velocity—dealer floorplan stress rose in 2024. Copart offsets via broader buyer reach and flexible payment plans. Rate cycles alter insurers' total-loss economics, impacting volumes and reserves.
Insurance claim frequency
Economy-wide driving patterns and repair-cost inflation have raised total-loss rates; Copart processed about 5.8 million vehicles in FY2024 and generated roughly $3.9B in revenue, so higher parts and labor costs push more vehicles to salvage auctions, benefiting volume but requiring tighter processing capacity and storage management; cyclical downturns in 2024–25 may curb discretionary buyer demand, pressuring per-unit margins.
Fuel prices and mix
Volatile fuel costs shift demand from trucks toward compacts and hybrids; U.S. average regular gasoline in 2024 was about $3.50/gal (EIA), with regional spreads often exceeding $0.80/gal, altering buyer priorities and salvage valuations. Buyers recalibrate bidding strategies, changing relative values across categories while Copart’s broad platform and 2,300+ locations sustain cross-segment liquidity and quick price discovery.
- Fuel-led demand swings: compact/hybrid vs truck
- Bidding shifts change category price differentials
- Platform breadth sustains liquidity and price discovery
- Regional fuel dynamics create localized pricing patterns
Foreign exchange exposure
Global buyers often fund Copart purchases in local currencies, so FX rates directly affect affordability; Copart operates across 11 countries, amplifying exposure. A stronger USD in 2024 reduced purchasing power for many international bidders and compressed cross-border prices. Copart’s hedging and multi-currency settlement options help stabilize participation, while geographic diversification lowers single-currency risk.
- USD strength 2024: reduced international bid volumes
- Presence in 11 countries: diversifies FX risk
- Hedging + multi-currency settlements: stabilize revenues
Trade rules, EV policy and disasters reshape yards across 11 countries
Used-car index fell ~25–30% from Nov 2021 to 2023, compressing recoveries; higher rates (Fed funds 5.25–5.50% Jun 2025) and ~11% average used-car loan rates have damped bidding. Copart processed ~5.8M vehicles and generated ~$3.9B revenue in FY2024; 2,300+ locations across 11 countries sustain liquidity despite USD strength and regional fuel swings (~$3.50/gal 2024).
| Metric | Value |
|---|---|
| Used-vehicle index decline | ~25–30% |
| Fed funds (Jun 2025) | 5.25–5.50% |
| Avg used loan rate | ~11% |
| Vehicles processed FY2024 | ~5.8M |
| Revenue FY2024 | $3.9B |
| Locations | 2,300+ |
| Countries | 11 |
| Avg gas (2024) | $3.50/gal |
What You See Is What You Get
Copart PESTLE Analysis
The preview shown here is the exact Copart PESTLE Analysis you’ll receive after purchase—fully formatted and ready to use. The content, structure, and layout visible now are identical to the downloadable file you’ll get immediately after checkout. No placeholders or teasers—this is the final, professionally structured document you’ll own.
Description
Your Competitive Advantage Starts with This Report
Discover how political, economic, social, technological, legal, and environmental forces are reshaping Copart’s prospects in our concise PESTLE snapshot—perfect for investors and strategists who need fast, actionable context. Use these insights to anticipate risks, identify growth levers, and refine your competitive plan. Purchase the full PESTLE for a complete, editable breakdown you can apply immediately.
Political factors
Trade and export policies
Changes in import/export rules for used and salvage vehicles directly affect Copart by altering cross-border buyer participation and price discovery; Copart reported FY2024 revenue of about $2.9 billion and operates in 11 countries with 200+ facilities, increasing exposure to regulatory shifts. Tariffs, sanctions and port bottlenecks can slow turnover and raise transaction costs, so Copart must diversify logistics lanes and tailor listings to compliance constraints. Stable trade relations support higher international sell-through rates and improved pricing transparency.
Local zoning and permitting
Yard siting and expansion for Copart, which operates in 11 countries with over 200 facilities and reported about $3.6 billion in revenue in FY2024, depend on municipal and county zoning approvals. Political support for industrial versus residential priorities can accelerate or stall capacity growth, directly affecting throughput at high-volume yards. Copart needs proactive community engagement and site remediation plans to secure permits; delays increase carrying costs and constrain volume growth.
Infrastructure and disaster funding
Federal infrastructure spending under the $1.2 trillion Bipartisan Infrastructure Law and disaster payouts matter for Copart because NOAA recorded 18 separate billion-dollar weather/climate disasters in 2023 totaling about $88 billion, driving higher total-loss volumes and transportation flows.
Post-storm buyback programs can sharply increase supply that Copart processes and auctions, while timely public funding for roads and ports shortens yard cycle times and lowers logistics costs.
Policy uncertainty around disaster funding and repair grants creates volatile supply spikes and troughs that complicate inventory and revenue forecasting for salvage operators.
EV incentives and fleet policies
Government EV subsidies such as the US federal tax credit up to 7,500 USD and the EU 2035 phase-out of new ICE cars are shifting auction inflows toward electrified vehicles; global EV stock surpassed 30 million by 2024, increasing Copart's EV intake and need for high-voltage handling and battery-testing capabilities. Copart must align facility upgrades and technician training with policy timelines, while political reversals could slow EV arrivals and change residual-value trajectories.
- Policy: US tax credit up to 7,500 USD
- Mandate: EU 2035 ICE phase-out
- Scale: global EV stock >30M (2024)
- Risk: policy reversals alter inventory mix
International market entry
Foreign investment rules and political stability directly shape Copart’s international market entry; Copart operates in 11 countries with over 200 facilities, so restrictions on land ownership or digital platforms can materially limit penetration and platform scalability. Forming local partnerships helps mitigate political risk and speeds licensing, while country selection influences growth potential, compliance costs, and buyer liquidity.
Trade rules, EV policy and disasters reshape yards across 11 countries
Trade rules, tariffs and port delays affect cross-border buyer participation and pricing; Copart operates in 11 countries with 200+ facilities and reported about $3.6B revenue in FY2024. Zoning, permits and local political risk shape yard expansion and carrying costs. Disaster funding, infrastructure bills and EV policy (US tax credit up to 7,500 USD; EU 2035 ICE phase-out) drive supply and facility needs.
| Metric | Value |
|---|---|
| Countries / Facilities | 11 / 200+ |
| FY2024 revenue | about 3.6B USD |
| Noaa 2023 disasters | 18 events, 88B USD |
| Global EV stock (2024) | >30M |
What is included in the product
Detailed Word Document
Explores how Political, Economic, Social, Technological, Environmental and Legal forces uniquely affect Copart, with data-backed trends and region-specific regulatory context; designed for executives and investors, offering forward-looking insights and ready-to-use findings for strategy, risk mitigation, and funding decisions.
Customizable Excel Spreadsheet
Condenses Copart’s PESTLE into a slide-ready summary that clarifies regulatory, technological, and market risks for fast decision-making, team alignment, and seamless inclusion in reports or presentations.
Economic factors
Used vehicle price cycles
Macro swings in used-car prices directly affect seller recovery values and Copart fee revenue; the Manheim Used Vehicle Value Index fell roughly 25–30% from its Nov 2021 peak through 2023 before stabilizing into 2024–25, compressing recoveries in down cycles.
Tight supply periods lift bids and margins, while gluts drive price compression, making real-time monitoring of wholesale indices essential to adjust fee tiers and remarketing cadence.
Price elasticity differs by segment: economy cars show higher elasticity and faster price swings, while specialty and classic vehicles retain value, supporting differentiated fee and inventory strategies.
Interest rates and credit
Higher rates raise buyer financing costs, tempering bidding intensity; US federal funds at 5.25–5.50% (June 2025) and average used-car loan rates near 11% squeeze demand. Credit availability for rebuilders, exporters and dealers governs sell-through velocity—dealer floorplan stress rose in 2024. Copart offsets via broader buyer reach and flexible payment plans. Rate cycles alter insurers' total-loss economics, impacting volumes and reserves.
Insurance claim frequency
Economy-wide driving patterns and repair-cost inflation have raised total-loss rates; Copart processed about 5.8 million vehicles in FY2024 and generated roughly $3.9B in revenue, so higher parts and labor costs push more vehicles to salvage auctions, benefiting volume but requiring tighter processing capacity and storage management; cyclical downturns in 2024–25 may curb discretionary buyer demand, pressuring per-unit margins.
Fuel prices and mix
Volatile fuel costs shift demand from trucks toward compacts and hybrids; U.S. average regular gasoline in 2024 was about $3.50/gal (EIA), with regional spreads often exceeding $0.80/gal, altering buyer priorities and salvage valuations. Buyers recalibrate bidding strategies, changing relative values across categories while Copart’s broad platform and 2,300+ locations sustain cross-segment liquidity and quick price discovery.
- Fuel-led demand swings: compact/hybrid vs truck
- Bidding shifts change category price differentials
- Platform breadth sustains liquidity and price discovery
- Regional fuel dynamics create localized pricing patterns
Foreign exchange exposure
Global buyers often fund Copart purchases in local currencies, so FX rates directly affect affordability; Copart operates across 11 countries, amplifying exposure. A stronger USD in 2024 reduced purchasing power for many international bidders and compressed cross-border prices. Copart’s hedging and multi-currency settlement options help stabilize participation, while geographic diversification lowers single-currency risk.
- USD strength 2024: reduced international bid volumes
- Presence in 11 countries: diversifies FX risk
- Hedging + multi-currency settlements: stabilize revenues
Trade rules, EV policy and disasters reshape yards across 11 countries
Used-car index fell ~25–30% from Nov 2021 to 2023, compressing recoveries; higher rates (Fed funds 5.25–5.50% Jun 2025) and ~11% average used-car loan rates have damped bidding. Copart processed ~5.8M vehicles and generated ~$3.9B revenue in FY2024; 2,300+ locations across 11 countries sustain liquidity despite USD strength and regional fuel swings (~$3.50/gal 2024).
| Metric | Value |
|---|---|
| Used-vehicle index decline | ~25–30% |
| Fed funds (Jun 2025) | 5.25–5.50% |
| Avg used loan rate | ~11% |
| Vehicles processed FY2024 | ~5.8M |
| Revenue FY2024 | $3.9B |
| Locations | 2,300+ |
| Countries | 11 |
| Avg gas (2024) | $3.50/gal |
What You See Is What You Get
Copart PESTLE Analysis
The preview shown here is the exact Copart PESTLE Analysis you’ll receive after purchase—fully formatted and ready to use. The content, structure, and layout visible now are identical to the downloadable file you’ll get immediately after checkout. No placeholders or teasers—this is the final, professionally structured document you’ll own.











