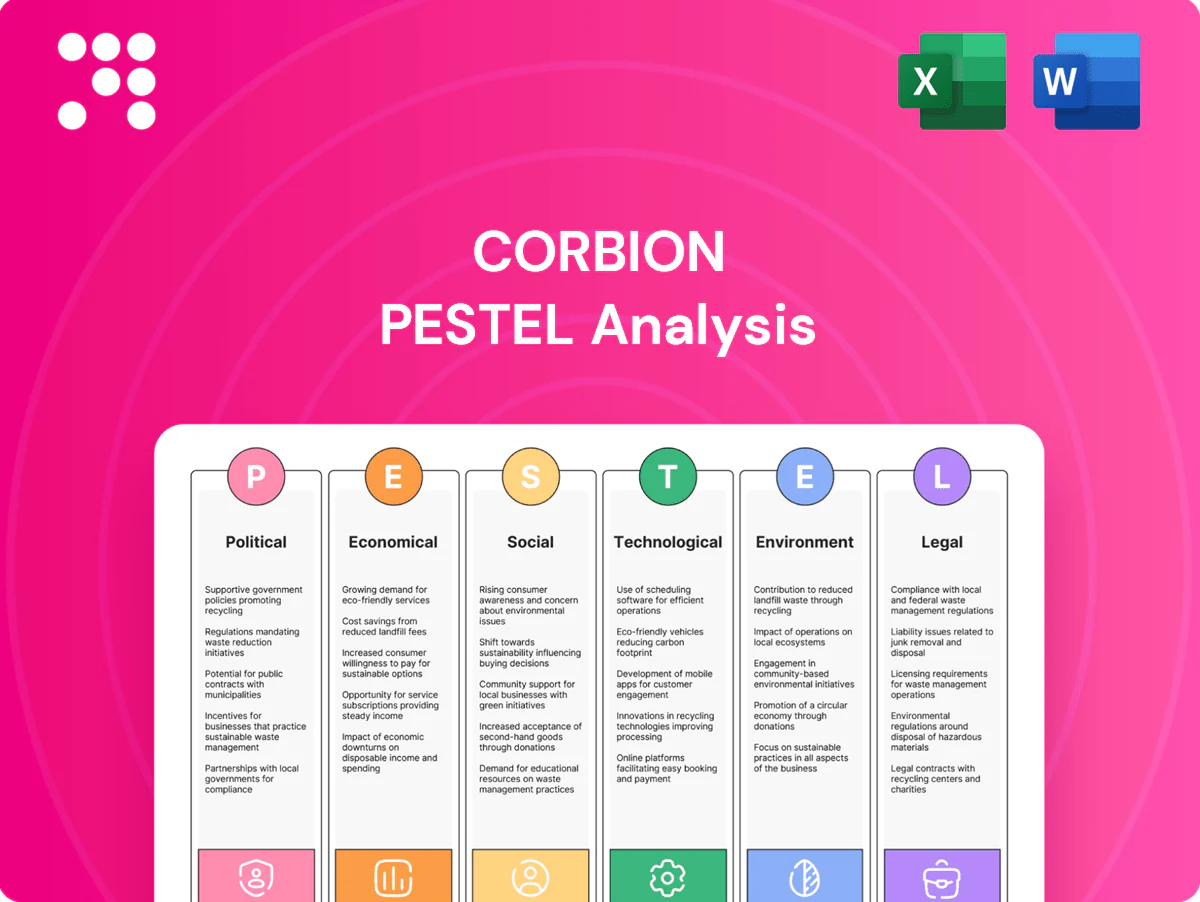
Corbion PESTLE Analysis

Plan Smarter. Present Sharper. Compete Stronger.
Discover how macro forces shape Corbion's strategy with our concise PESTLE snapshot—covering regulatory risks, sustainability drivers, economic trends and tech shifts. Ideal for investors and strategists, it pinpoints threats and opportunities quickly. Purchase the full PESTLE for a complete, actionable roadmap you can use now.
Political factors

Bioeconomy incentives
Governments boost bio-based materials with subsidies, tax credits and green public procurement that favor low-carbon inputs, directly supporting lactic acid and bioplastic markets. The EU Green Deal aims to mobilize at least €1 trillion and NextGenerationEU totals €723.8 billion, while U.S. bioeconomy strategies and national circular policies raise demand. Stable incentives de‑risk long‑horizon fermentation capex; policy reversals or funding gaps could stall adoption curves.
Trade tariffs and market access
Corbion’s global supply chains for sugars, chemicals and finished ingredients face tariffs, quotas and non-tariff barriers that raise landed costs (global average applied MFN tariff ~2.9% in 2024) and can disrupt delivery reliability; shifts in trade agreements and geopolitical tensions have driven regional cost swings. Localizing production at its >10 sites spreads risk but often requires capital outlays (single-plant investments commonly exceed EUR 50m). Export controls on biotech tools, tightened since 2023, could slow innovation and access to critical equipment.

Food and agriculture policies
Agricultural policies on sugar, corn and land use directly affect Corbion’s feedstock availability and pricing; EU Common Agricultural Policy budget for 2021–27 is €386.6 billion, shaping EU supply. Global maize production was ~1.18 billion tonnes in 2023 (USDA), influencing global corn feedstock markets. Food security priorities can divert crops from bio-based uses in tight years, tightening margins. Public funding for sustainable farming supports certified supply chains and traceability adoption.

Plastic regulation momentum
Rising plastic bans and expanding EPR schemes (more than 50 countries) plus EU/US packaging targets are accelerating interest in bioplastics and PLA routes tied to lactic acid; PLA demand was ~0.5 Mt in 2023 and is projected to exceed 1.0 Mt by 2030, boosting Corbion's upstream feedstock opportunities. Divergent national standards increase compliance costs and slow scale; stronger mandates raise price premiums, while delays reduce conversion rates. Government labeling rules in major markets are tightening claims on biodegradable and compostable labels, reshaping consumer trust and uptake.
- Plastic bans drive PLA demand
- EPR in 50+ countries raises costs
- PLA ~0.5 Mt (2023) → >1.0 Mt (2030 proj.)
- Fragmented standards = higher compliance
- Tighter labels affect consumer perception
Emerging market regulatory variability
Operating across Americas, Europe and Asia-Pacific increases permitting, licensing and compliance complexity for Corbion, with local content and investment rules frequently conditioning market entry and capital allocation. Political stability in host countries influences plant uptime and logistics, while proactive stakeholder engagement has accelerated approvals in recent projects. Corbion is listed on Euronext Amsterdam (CRBN).
- Permitting complexity
- Local content rules
- Stability affects uptime
- Stakeholder engagement cuts approval time
EU green funding boosts PLA growth but trade and feedstock policy risk project timelines
Policy support (EU Green Deal mobilizing ≥€1tn; NextGenerationEU €723.8bn) and 2024 incentives lower bio‑investment risk but funding shifts can stall projects. Trade barriers (avg applied MFN tariff ~2.9% in 2024) and export controls raise costs and delay tech access. Feedstock policy (EU CAP €386.6bn 2021–27; global maize ~1.18bn t in 2023) affects margins. PLA demand ~0.5 Mt (2023) → >1.0 Mt (2030).
| Metric | Value |
|---|---|
| EU funding | ≥€1tn |
| NextGenerationEU | €723.8bn |
| Avg MFN tariff (2024) | 2.9% |
| Global maize (2023) | 1.18bn t |
| PLA (2023) | 0.5 Mt |
What is included in the product
 Detailed Word Document
Explores how macro-environmental factors uniquely affect Corbion across Political, Economic, Social, Technological, Environmental and Legal dimensions, with data-backed trends, sector-specific subpoints and forward-looking insights designed for executives, investors and strategists and formatted for direct use in plans and decks.

 Customizable Excel Spreadsheet
A concise, visually segmented PESTLE of Corbion that's easy to drop into presentations or share across teams, enabling quick alignment on external risks and market positioning while allowing users to add notes for regional or business-line context.
Economic factors

Feedstock price volatility
Volatility in sugar and corn—raw sugar futures swung roughly 0.13–0.22 USD/lb and US corn futures about 4.5–7.0 USD/bu in 2023–24—drives margin variability across Corbion’s fermentation chains. Weather shocks, rising biofuel demand (US ethanol output ~1.0–1.1 mbpd in 2024) and trade policy shifts amplify cycles. Long-term contracts and certification premiums add stability but raise costs, while process yield gains reduce feedstock sensitivity.
End-market cyclicality
End-market cyclicality at Corbion shows food and HPC acting defensively while bioplastics and industrials remain more cyclical; macro slowdowns in 2024 pressured discretionary food formats and delayed capital projects in industrials. Diversification across sectors smooths revenue streams, and a shift toward value-added blends and ingredient solutions has strengthened margin resilience and reduced volatility.

FX and global footprint
Corbion’s multi-currency sales and input costs expose earnings to FX moves, with global sales around €1.25bn in 2024 and roughly 60% generated outside Europe increasing USD/BRL/CNY sensitivity. Local production and sourcing provide natural hedges—around half of manufacturing footprint is regional—reducing pass-through risk. Contractual FX clauses and dynamic pricing help protect margins, while treasury strategies (hedging, netting, cash pooling) remain critical amid 2024–25 rate and currency volatility.

Inflation and pricing power
Input, energy and logistics inflation have pressured Corbion margins, though euro‑area inflation eased to about 2.4% in 2024; differentiated functionality and sustainability credentials enable mid‑single digit price realisations and contract pass‑throughs protect profitability. Ongoing efficiency programs and diversified energy sourcing (notably reduced exposure to spot gas) mitigate cost pressure.
- input inflation
- price realisation
- contract pass‑throughs
- efficiency & energy sourcing
Scale, M&A, and capacity utilization
Fermentation and polymer assets need high utilization (typically >75%) to deliver returns; Corbion reported FY 2023 revenue of €1,345m, highlighting scale sensitivity. Consolidation or partnerships expand technology, markets and feedstock access while phased debottlenecking limits capex and execution risk. Clear demand visibility and offtake agreements are key to justify capacity expansion.
- Utilization >75%
- Corbion FY2023 revenue €1,345m
- Phased debottlenecking reduces capex risk
- Offtake agreements underpin expansions
EU green funding boosts PLA growth but trade and feedstock policy risk project timelines
Raw-material swings (sugar 0.13–0.22 USD/lb; corn 4.5–7.0 USD/bu in 2023–24) and biofuel demand (US ethanol ~1.05 mbpd in 2024) drive margin variability; long‑term contracts, yield gains and product mix reduce sensitivity. FX exposure is material—~60% sales outside Europe with ~€1.25bn sales in 2024—while efficiency and energy sourcing mitigate input inflation (~2.4% euro area 2024).
| Metric | Value |
|---|---|
| FY2023 revenue | €1,345m |
| 2024 sales | ~€1.25bn |
| Utilization | >75% |
| Euro area inflation 2024 | 2.4% |
What You See Is What You Get
Corbion PESTLE Analysis
The preview shown here is the exact Corbion PESTLE Analysis you’ll receive after purchase—fully formatted, professionally structured, and ready to use. The layout, content, and structure visible are identical to the downloadable final file, with no placeholders or surprises.

Plan Smarter. Present Sharper. Compete Stronger.
Discover how macro forces shape Corbion's strategy with our concise PESTLE snapshot—covering regulatory risks, sustainability drivers, economic trends and tech shifts. Ideal for investors and strategists, it pinpoints threats and opportunities quickly. Purchase the full PESTLE for a complete, actionable roadmap you can use now.
Political factors
Bioeconomy incentives
Governments boost bio-based materials with subsidies, tax credits and green public procurement that favor low-carbon inputs, directly supporting lactic acid and bioplastic markets. The EU Green Deal aims to mobilize at least €1 trillion and NextGenerationEU totals €723.8 billion, while U.S. bioeconomy strategies and national circular policies raise demand. Stable incentives de‑risk long‑horizon fermentation capex; policy reversals or funding gaps could stall adoption curves.
Trade tariffs and market access
Corbion’s global supply chains for sugars, chemicals and finished ingredients face tariffs, quotas and non-tariff barriers that raise landed costs (global average applied MFN tariff ~2.9% in 2024) and can disrupt delivery reliability; shifts in trade agreements and geopolitical tensions have driven regional cost swings. Localizing production at its >10 sites spreads risk but often requires capital outlays (single-plant investments commonly exceed EUR 50m). Export controls on biotech tools, tightened since 2023, could slow innovation and access to critical equipment.
Food and agriculture policies
Agricultural policies on sugar, corn and land use directly affect Corbion’s feedstock availability and pricing; EU Common Agricultural Policy budget for 2021–27 is €386.6 billion, shaping EU supply. Global maize production was ~1.18 billion tonnes in 2023 (USDA), influencing global corn feedstock markets. Food security priorities can divert crops from bio-based uses in tight years, tightening margins. Public funding for sustainable farming supports certified supply chains and traceability adoption.
Plastic regulation momentum
Rising plastic bans and expanding EPR schemes (more than 50 countries) plus EU/US packaging targets are accelerating interest in bioplastics and PLA routes tied to lactic acid; PLA demand was ~0.5 Mt in 2023 and is projected to exceed 1.0 Mt by 2030, boosting Corbion's upstream feedstock opportunities. Divergent national standards increase compliance costs and slow scale; stronger mandates raise price premiums, while delays reduce conversion rates. Government labeling rules in major markets are tightening claims on biodegradable and compostable labels, reshaping consumer trust and uptake.
- Plastic bans drive PLA demand
- EPR in 50+ countries raises costs
- PLA ~0.5 Mt (2023) → >1.0 Mt (2030 proj.)
- Fragmented standards = higher compliance
- Tighter labels affect consumer perception
Emerging market regulatory variability
Operating across Americas, Europe and Asia-Pacific increases permitting, licensing and compliance complexity for Corbion, with local content and investment rules frequently conditioning market entry and capital allocation. Political stability in host countries influences plant uptime and logistics, while proactive stakeholder engagement has accelerated approvals in recent projects. Corbion is listed on Euronext Amsterdam (CRBN).
- Permitting complexity
- Local content rules
- Stability affects uptime
- Stakeholder engagement cuts approval time
EU green funding boosts PLA growth but trade and feedstock policy risk project timelines
Policy support (EU Green Deal mobilizing ≥€1tn; NextGenerationEU €723.8bn) and 2024 incentives lower bio‑investment risk but funding shifts can stall projects. Trade barriers (avg applied MFN tariff ~2.9% in 2024) and export controls raise costs and delay tech access. Feedstock policy (EU CAP €386.6bn 2021–27; global maize ~1.18bn t in 2023) affects margins. PLA demand ~0.5 Mt (2023) → >1.0 Mt (2030).
| Metric | Value |
|---|---|
| EU funding | ≥€1tn |
| NextGenerationEU | €723.8bn |
| Avg MFN tariff (2024) | 2.9% |
| Global maize (2023) | 1.18bn t |
| PLA (2023) | 0.5 Mt |
What is included in the product
Detailed Word Document
Explores how macro-environmental factors uniquely affect Corbion across Political, Economic, Social, Technological, Environmental and Legal dimensions, with data-backed trends, sector-specific subpoints and forward-looking insights designed for executives, investors and strategists and formatted for direct use in plans and decks.
Customizable Excel Spreadsheet
A concise, visually segmented PESTLE of Corbion that's easy to drop into presentations or share across teams, enabling quick alignment on external risks and market positioning while allowing users to add notes for regional or business-line context.
Economic factors
Feedstock price volatility
Volatility in sugar and corn—raw sugar futures swung roughly 0.13–0.22 USD/lb and US corn futures about 4.5–7.0 USD/bu in 2023–24—drives margin variability across Corbion’s fermentation chains. Weather shocks, rising biofuel demand (US ethanol output ~1.0–1.1 mbpd in 2024) and trade policy shifts amplify cycles. Long-term contracts and certification premiums add stability but raise costs, while process yield gains reduce feedstock sensitivity.
End-market cyclicality
End-market cyclicality at Corbion shows food and HPC acting defensively while bioplastics and industrials remain more cyclical; macro slowdowns in 2024 pressured discretionary food formats and delayed capital projects in industrials. Diversification across sectors smooths revenue streams, and a shift toward value-added blends and ingredient solutions has strengthened margin resilience and reduced volatility.
FX and global footprint
Corbion’s multi-currency sales and input costs expose earnings to FX moves, with global sales around €1.25bn in 2024 and roughly 60% generated outside Europe increasing USD/BRL/CNY sensitivity. Local production and sourcing provide natural hedges—around half of manufacturing footprint is regional—reducing pass-through risk. Contractual FX clauses and dynamic pricing help protect margins, while treasury strategies (hedging, netting, cash pooling) remain critical amid 2024–25 rate and currency volatility.
Inflation and pricing power
Input, energy and logistics inflation have pressured Corbion margins, though euro‑area inflation eased to about 2.4% in 2024; differentiated functionality and sustainability credentials enable mid‑single digit price realisations and contract pass‑throughs protect profitability. Ongoing efficiency programs and diversified energy sourcing (notably reduced exposure to spot gas) mitigate cost pressure.
- input inflation
- price realisation
- contract pass‑throughs
- efficiency & energy sourcing
Scale, M&A, and capacity utilization
Fermentation and polymer assets need high utilization (typically >75%) to deliver returns; Corbion reported FY 2023 revenue of €1,345m, highlighting scale sensitivity. Consolidation or partnerships expand technology, markets and feedstock access while phased debottlenecking limits capex and execution risk. Clear demand visibility and offtake agreements are key to justify capacity expansion.
- Utilization >75%
- Corbion FY2023 revenue €1,345m
- Phased debottlenecking reduces capex risk
- Offtake agreements underpin expansions
EU green funding boosts PLA growth but trade and feedstock policy risk project timelines
Raw-material swings (sugar 0.13–0.22 USD/lb; corn 4.5–7.0 USD/bu in 2023–24) and biofuel demand (US ethanol ~1.05 mbpd in 2024) drive margin variability; long‑term contracts, yield gains and product mix reduce sensitivity. FX exposure is material—~60% sales outside Europe with ~€1.25bn sales in 2024—while efficiency and energy sourcing mitigate input inflation (~2.4% euro area 2024).
| Metric | Value |
|---|---|
| FY2023 revenue | €1,345m |
| 2024 sales | ~€1.25bn |
| Utilization | >75% |
| Euro area inflation 2024 | 2.4% |
What You See Is What You Get
Corbion PESTLE Analysis
The preview shown here is the exact Corbion PESTLE Analysis you’ll receive after purchase—fully formatted, professionally structured, and ready to use. The layout, content, and structure visible are identical to the downloadable final file, with no placeholders or surprises.
Original: $10.00
-65%$10.00
$3.50Description
Plan Smarter. Present Sharper. Compete Stronger.
Discover how macro forces shape Corbion's strategy with our concise PESTLE snapshot—covering regulatory risks, sustainability drivers, economic trends and tech shifts. Ideal for investors and strategists, it pinpoints threats and opportunities quickly. Purchase the full PESTLE for a complete, actionable roadmap you can use now.
Political factors
Bioeconomy incentives
Governments boost bio-based materials with subsidies, tax credits and green public procurement that favor low-carbon inputs, directly supporting lactic acid and bioplastic markets. The EU Green Deal aims to mobilize at least €1 trillion and NextGenerationEU totals €723.8 billion, while U.S. bioeconomy strategies and national circular policies raise demand. Stable incentives de‑risk long‑horizon fermentation capex; policy reversals or funding gaps could stall adoption curves.
Trade tariffs and market access
Corbion’s global supply chains for sugars, chemicals and finished ingredients face tariffs, quotas and non-tariff barriers that raise landed costs (global average applied MFN tariff ~2.9% in 2024) and can disrupt delivery reliability; shifts in trade agreements and geopolitical tensions have driven regional cost swings. Localizing production at its >10 sites spreads risk but often requires capital outlays (single-plant investments commonly exceed EUR 50m). Export controls on biotech tools, tightened since 2023, could slow innovation and access to critical equipment.
Food and agriculture policies
Agricultural policies on sugar, corn and land use directly affect Corbion’s feedstock availability and pricing; EU Common Agricultural Policy budget for 2021–27 is €386.6 billion, shaping EU supply. Global maize production was ~1.18 billion tonnes in 2023 (USDA), influencing global corn feedstock markets. Food security priorities can divert crops from bio-based uses in tight years, tightening margins. Public funding for sustainable farming supports certified supply chains and traceability adoption.
Plastic regulation momentum
Rising plastic bans and expanding EPR schemes (more than 50 countries) plus EU/US packaging targets are accelerating interest in bioplastics and PLA routes tied to lactic acid; PLA demand was ~0.5 Mt in 2023 and is projected to exceed 1.0 Mt by 2030, boosting Corbion's upstream feedstock opportunities. Divergent national standards increase compliance costs and slow scale; stronger mandates raise price premiums, while delays reduce conversion rates. Government labeling rules in major markets are tightening claims on biodegradable and compostable labels, reshaping consumer trust and uptake.
- Plastic bans drive PLA demand
- EPR in 50+ countries raises costs
- PLA ~0.5 Mt (2023) → >1.0 Mt (2030 proj.)
- Fragmented standards = higher compliance
- Tighter labels affect consumer perception
Emerging market regulatory variability
Operating across Americas, Europe and Asia-Pacific increases permitting, licensing and compliance complexity for Corbion, with local content and investment rules frequently conditioning market entry and capital allocation. Political stability in host countries influences plant uptime and logistics, while proactive stakeholder engagement has accelerated approvals in recent projects. Corbion is listed on Euronext Amsterdam (CRBN).
- Permitting complexity
- Local content rules
- Stability affects uptime
- Stakeholder engagement cuts approval time
EU green funding boosts PLA growth but trade and feedstock policy risk project timelines
Policy support (EU Green Deal mobilizing ≥€1tn; NextGenerationEU €723.8bn) and 2024 incentives lower bio‑investment risk but funding shifts can stall projects. Trade barriers (avg applied MFN tariff ~2.9% in 2024) and export controls raise costs and delay tech access. Feedstock policy (EU CAP €386.6bn 2021–27; global maize ~1.18bn t in 2023) affects margins. PLA demand ~0.5 Mt (2023) → >1.0 Mt (2030).
| Metric | Value |
|---|---|
| EU funding | ≥€1tn |
| NextGenerationEU | €723.8bn |
| Avg MFN tariff (2024) | 2.9% |
| Global maize (2023) | 1.18bn t |
| PLA (2023) | 0.5 Mt |
What is included in the product
Detailed Word Document
Explores how macro-environmental factors uniquely affect Corbion across Political, Economic, Social, Technological, Environmental and Legal dimensions, with data-backed trends, sector-specific subpoints and forward-looking insights designed for executives, investors and strategists and formatted for direct use in plans and decks.
Customizable Excel Spreadsheet
A concise, visually segmented PESTLE of Corbion that's easy to drop into presentations or share across teams, enabling quick alignment on external risks and market positioning while allowing users to add notes for regional or business-line context.
Economic factors
Feedstock price volatility
Volatility in sugar and corn—raw sugar futures swung roughly 0.13–0.22 USD/lb and US corn futures about 4.5–7.0 USD/bu in 2023–24—drives margin variability across Corbion’s fermentation chains. Weather shocks, rising biofuel demand (US ethanol output ~1.0–1.1 mbpd in 2024) and trade policy shifts amplify cycles. Long-term contracts and certification premiums add stability but raise costs, while process yield gains reduce feedstock sensitivity.
End-market cyclicality
End-market cyclicality at Corbion shows food and HPC acting defensively while bioplastics and industrials remain more cyclical; macro slowdowns in 2024 pressured discretionary food formats and delayed capital projects in industrials. Diversification across sectors smooths revenue streams, and a shift toward value-added blends and ingredient solutions has strengthened margin resilience and reduced volatility.
FX and global footprint
Corbion’s multi-currency sales and input costs expose earnings to FX moves, with global sales around €1.25bn in 2024 and roughly 60% generated outside Europe increasing USD/BRL/CNY sensitivity. Local production and sourcing provide natural hedges—around half of manufacturing footprint is regional—reducing pass-through risk. Contractual FX clauses and dynamic pricing help protect margins, while treasury strategies (hedging, netting, cash pooling) remain critical amid 2024–25 rate and currency volatility.
Inflation and pricing power
Input, energy and logistics inflation have pressured Corbion margins, though euro‑area inflation eased to about 2.4% in 2024; differentiated functionality and sustainability credentials enable mid‑single digit price realisations and contract pass‑throughs protect profitability. Ongoing efficiency programs and diversified energy sourcing (notably reduced exposure to spot gas) mitigate cost pressure.
- input inflation
- price realisation
- contract pass‑throughs
- efficiency & energy sourcing
Scale, M&A, and capacity utilization
Fermentation and polymer assets need high utilization (typically >75%) to deliver returns; Corbion reported FY 2023 revenue of €1,345m, highlighting scale sensitivity. Consolidation or partnerships expand technology, markets and feedstock access while phased debottlenecking limits capex and execution risk. Clear demand visibility and offtake agreements are key to justify capacity expansion.
- Utilization >75%
- Corbion FY2023 revenue €1,345m
- Phased debottlenecking reduces capex risk
- Offtake agreements underpin expansions
EU green funding boosts PLA growth but trade and feedstock policy risk project timelines
Raw-material swings (sugar 0.13–0.22 USD/lb; corn 4.5–7.0 USD/bu in 2023–24) and biofuel demand (US ethanol ~1.05 mbpd in 2024) drive margin variability; long‑term contracts, yield gains and product mix reduce sensitivity. FX exposure is material—~60% sales outside Europe with ~€1.25bn sales in 2024—while efficiency and energy sourcing mitigate input inflation (~2.4% euro area 2024).
| Metric | Value |
|---|---|
| FY2023 revenue | €1,345m |
| 2024 sales | ~€1.25bn |
| Utilization | >75% |
| Euro area inflation 2024 | 2.4% |
What You See Is What You Get
Corbion PESTLE Analysis
The preview shown here is the exact Corbion PESTLE Analysis you’ll receive after purchase—fully formatted, professionally structured, and ready to use. The layout, content, and structure visible are identical to the downloadable final file, with no placeholders or surprises.











