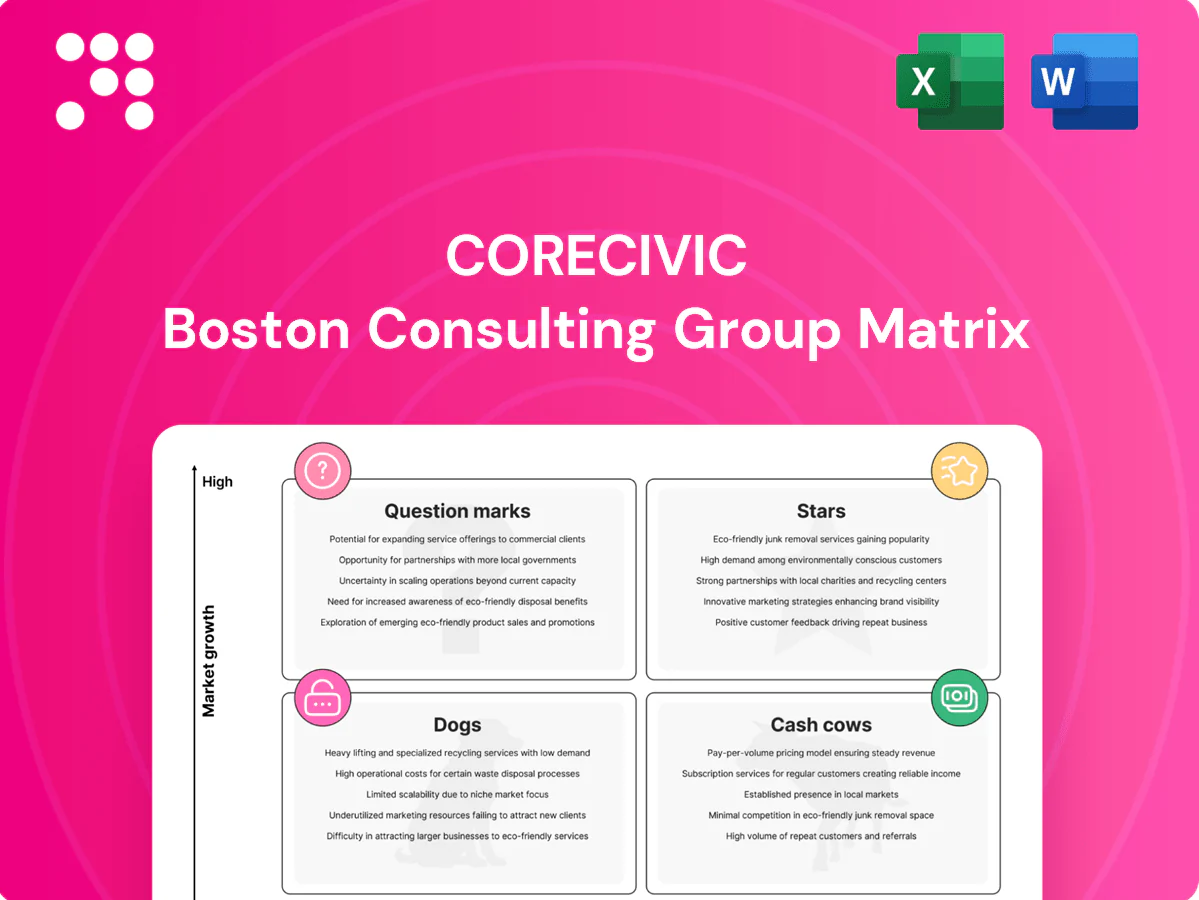
CoreCivic Boston Consulting Group Matrix

See the Bigger Picture
Curious where CoreCivic’s assets sit—market leaders, steady earners, or resource drains? This CoreCivic BCG Matrix preview maps the high-level moves; the full report gives quadrant-by-quadrant placements, data-backed recommendations, and a ready-to-use strategy. Buy the complete BCG Matrix for a detailed Word report plus an editable Excel summary and start reallocating capital with confidence. Purchase now and skip the guesswork.
Stars

ICE detention network in high-demand regions
High share across key Southwestern corridors, with CoreCivic operating numerous ICE-contracted facilities that governments lean on during surges; ICE average daily population exceeded 30,000 in 2024, pushing demand above standard prison trends. Growth has outpaced traditional corrections demand, though choppy; continue investing in readiness, compliance, and speed-to-activate. Hold share now; contracts and stable utilization can mature into dependable cash flow.
Company-owned, large-scale prisons with rapid activation
Company-owned, large-scale prisons are CoreCivic’s flagship assets: modern, scalable, and already financed, with CoreCivic operating as a public company (NYSE: CXW). Agencies prioritize capacity that can be turned on quickly, and CoreCivic is frequently the go-to provider in surge situations. Growth persists in select states facing crowding pressure such as Texas and Florida. Maintaining uptime and robust staffing pipelines is essential to defend its lead.

Federal and state surge-capacity partnerships
When populations spike governments call first-movers, and CoreCivic’s national footprint and logistics network secure a disproportionate share of urgent federal and state surge awards. Growth cycles for these surge-capacity contracts are sharp and capital-intensive, creating heavy short-term cash needs while delivering outsized contract wins. The strategy pays off when response speed and compliance drive renewals and premium pricing, so keeping the bench and regulatory controls tight is essential.

High-security facility management in growth states
State-level incarceration is broadly flat, but growth corridors in Texas, Florida and parts of the Southwest show rising demand; CoreCivic held a leading presence in these states and operated roughly 60,000 beds nationwide in 2024, giving it strong share where new public beds are constrained. These star contracts require heavy onsite support and oversight, so protecting wins hinges on KPI leadership and maintaining low incident rates to secure renewals and premium pricing.
- Focus: high-security growth corridors (TX, FL, AZ)
- Asset: ~60,000 beds nationwide (2024)
- Risk: high operational support and oversight
- Protect: KPI leadership, low incidents, contract renewals
Integrated detention services bundle (housing + care + ops)
Integrated detention services bundle (housing + care + ops) positions CoreCivic as a Star in the BCG matrix by winning complex RFPs and crowding out specialists; government buyers prefer fewer vendors when stakes are high. Execution costs are tangible, so cash inflows often track outflows during growth spikes; investment secures multi-year (5–15 year) terms and pricing power.
- End-to-end wins: complex RFPs
- Buyer preference: fewer vendors
- Cash flow: growth spikes ≈ matched inflow/outflow
- Invest: lock 5–15 year terms, pricing power
SW growth corridors: ~60,000 beds, ICE ADP >30,000 — ops-heavy path to durable cash flow
CoreCivic is a Star in SW growth corridors (TX, FL, AZ) with ~60,000 beds nationwide in 2024 and strong ICE exposure as ICE ADP exceeded 30,000 in 2024. Rapid surge wins and 5–15 year contracts drive growth but require heavy ops spend, KPI focus, and low incident rates to convert to durable cash flow.
| Metric | 2024 | Note |
|---|---|---|
| Beds | ~60,000 | Company-owned |
| ICE ADP | >30,000 | Federal demand spike |
| Contract length | 5–15 yrs | Pricing power |
What is included in the product
 Detailed Word Document
CoreCivic BCG Matrix review identifying Stars, Cash Cows, Question Marks and Dogs with targeted invest, hold or divest guidance.

 Customizable Excel Spreadsheet
One-page CoreCivic BCG Matrix highlighting problem units and quick fixes for executive decisions
Cash Cows

Long-term state prison O&M contracts in mature markets
Long-term state prison O&M contracts in mature markets deliver stable populations, known standards and predictable per-diem economics, positioning these assets as cash cows for CoreCivic in 2024. CoreCivic already holds a leading share of state O&M contracts and relies on minimal promotional spend, with performance-driven renewals sustaining revenue streams. Focus on optimizing staffing, maintenance cycles and utilities will widen margins and protect cash flow.
CoreCivic Properties: lease-only government arrangements
CoreCivic Properties leases facilities to government customers while third parties operate them, producing steady, rent-like cash flows with low organic growth and high reliability.
Capex is concentrated on maintenance and compliance rather than expansion, yielding predictable returns that resemble lease income and support conservative dividend and debt strategies.
Management should focus on extracting free cash from the asset base, refinancing at lower rates when available, and structuring tight occupancy guarantees to preserve cash visibility and downside protection.

Per-diem beds with minimum guarantees
Per-diem beds with minimum guarantees provide a revenue floor that reduces volatility and boosts free cash flow; CoreCivic reported roughly $1.8B revenue in 2023, and guaranteed-occupancy contracts typically lock in 85–95% of beds. Market growth is modest but CoreCivic’s share remains strong due to long-term public contracts. Once contracts are set, promotion needs are limited and incremental efficiency gains flow straight to cash.

Mature detention facilities with stable occupancy
Mature detention facilities operate like clockwork, with CoreCivic reporting stabilized site occupancy near 92% in 2024 and delivering consistent margins as high-share, low-growth assets. These sites generate dependable cashflow and require tight compliance management to keep incidents minimal. Management focuses on shaving cost per inmate while preserving service quality and contractual performance.
Ancillary in-facility services tied to existing contracts
Ancillary in-facility services ride the core contract (e.g., basic programs, commissary logistics), generating recurring high-margin revenue with limited upside; CoreCivic reported ancillary-related sales contributing about 10% of contract revenue in 2024, yielding mid-teens EBITDA margins.
Once embedded minimal selling is needed; standardizing delivery (checklists, regional hubs) reduces overhead and preserves margins while growth remains low-single-digit annually.
- Revenue mix: ancillary ≈10% of contract revenue (2024)
- Profitability: mid-teens EBITDA margin (2024)
- Growth: low-single-digit CAGR
- Strategy: standardize delivery, regional logistics hubs, minimal sales effort
O&M contracts: steady per-diem cash, low capex, annuity revenue and high occupancy
Long-term state O&M contracts yield stable per-diem cash flows; CoreCivic reported $1.8B revenue in 2023 and ~92% stabilized occupancy in 2024. Ancillaries ≈10% of contract revenue with mid-teens EBITDA margins. Capex limited to maintenance, preserving free cash for dividends and debt paydown.
| Metric | 2023/2024 |
|---|---|
| Revenue | $1.8B (2023) |
| Occupancy | 92% (2024) |
| Ancillary | ≈10% |
| EBITDA margin | Mid-teens |
Full Transparency, Always
CoreCivic BCG Matrix
The file you're previewing is the exact CoreCivic BCG Matrix you'll receive after purchase. No watermarks, no demo copy—just the fully formatted strategic report ready for immediate use. It's editable, printable, and presentation-ready for your team or board. Delivered instantly after checkout with clear, market-backed analysis. No surprises—just plug-and-play strategy.

See the Bigger Picture
Curious where CoreCivic’s assets sit—market leaders, steady earners, or resource drains? This CoreCivic BCG Matrix preview maps the high-level moves; the full report gives quadrant-by-quadrant placements, data-backed recommendations, and a ready-to-use strategy. Buy the complete BCG Matrix for a detailed Word report plus an editable Excel summary and start reallocating capital with confidence. Purchase now and skip the guesswork.
Stars
ICE detention network in high-demand regions
High share across key Southwestern corridors, with CoreCivic operating numerous ICE-contracted facilities that governments lean on during surges; ICE average daily population exceeded 30,000 in 2024, pushing demand above standard prison trends. Growth has outpaced traditional corrections demand, though choppy; continue investing in readiness, compliance, and speed-to-activate. Hold share now; contracts and stable utilization can mature into dependable cash flow.
Company-owned, large-scale prisons with rapid activation
Company-owned, large-scale prisons are CoreCivic’s flagship assets: modern, scalable, and already financed, with CoreCivic operating as a public company (NYSE: CXW). Agencies prioritize capacity that can be turned on quickly, and CoreCivic is frequently the go-to provider in surge situations. Growth persists in select states facing crowding pressure such as Texas and Florida. Maintaining uptime and robust staffing pipelines is essential to defend its lead.
Federal and state surge-capacity partnerships
When populations spike governments call first-movers, and CoreCivic’s national footprint and logistics network secure a disproportionate share of urgent federal and state surge awards. Growth cycles for these surge-capacity contracts are sharp and capital-intensive, creating heavy short-term cash needs while delivering outsized contract wins. The strategy pays off when response speed and compliance drive renewals and premium pricing, so keeping the bench and regulatory controls tight is essential.
High-security facility management in growth states
State-level incarceration is broadly flat, but growth corridors in Texas, Florida and parts of the Southwest show rising demand; CoreCivic held a leading presence in these states and operated roughly 60,000 beds nationwide in 2024, giving it strong share where new public beds are constrained. These star contracts require heavy onsite support and oversight, so protecting wins hinges on KPI leadership and maintaining low incident rates to secure renewals and premium pricing.
- Focus: high-security growth corridors (TX, FL, AZ)
- Asset: ~60,000 beds nationwide (2024)
- Risk: high operational support and oversight
- Protect: KPI leadership, low incidents, contract renewals
Integrated detention services bundle (housing + care + ops)
Integrated detention services bundle (housing + care + ops) positions CoreCivic as a Star in the BCG matrix by winning complex RFPs and crowding out specialists; government buyers prefer fewer vendors when stakes are high. Execution costs are tangible, so cash inflows often track outflows during growth spikes; investment secures multi-year (5–15 year) terms and pricing power.
- End-to-end wins: complex RFPs
- Buyer preference: fewer vendors
- Cash flow: growth spikes ≈ matched inflow/outflow
- Invest: lock 5–15 year terms, pricing power
SW growth corridors: ~60,000 beds, ICE ADP >30,000 — ops-heavy path to durable cash flow
CoreCivic is a Star in SW growth corridors (TX, FL, AZ) with ~60,000 beds nationwide in 2024 and strong ICE exposure as ICE ADP exceeded 30,000 in 2024. Rapid surge wins and 5–15 year contracts drive growth but require heavy ops spend, KPI focus, and low incident rates to convert to durable cash flow.
| Metric | 2024 | Note |
|---|---|---|
| Beds | ~60,000 | Company-owned |
| ICE ADP | >30,000 | Federal demand spike |
| Contract length | 5–15 yrs | Pricing power |
What is included in the product
Detailed Word Document
CoreCivic BCG Matrix review identifying Stars, Cash Cows, Question Marks and Dogs with targeted invest, hold or divest guidance.
Customizable Excel Spreadsheet
One-page CoreCivic BCG Matrix highlighting problem units and quick fixes for executive decisions
Cash Cows
Long-term state prison O&M contracts in mature markets
Long-term state prison O&M contracts in mature markets deliver stable populations, known standards and predictable per-diem economics, positioning these assets as cash cows for CoreCivic in 2024. CoreCivic already holds a leading share of state O&M contracts and relies on minimal promotional spend, with performance-driven renewals sustaining revenue streams. Focus on optimizing staffing, maintenance cycles and utilities will widen margins and protect cash flow.
CoreCivic Properties: lease-only government arrangements
CoreCivic Properties leases facilities to government customers while third parties operate them, producing steady, rent-like cash flows with low organic growth and high reliability.
Capex is concentrated on maintenance and compliance rather than expansion, yielding predictable returns that resemble lease income and support conservative dividend and debt strategies.
Management should focus on extracting free cash from the asset base, refinancing at lower rates when available, and structuring tight occupancy guarantees to preserve cash visibility and downside protection.
Per-diem beds with minimum guarantees
Per-diem beds with minimum guarantees provide a revenue floor that reduces volatility and boosts free cash flow; CoreCivic reported roughly $1.8B revenue in 2023, and guaranteed-occupancy contracts typically lock in 85–95% of beds. Market growth is modest but CoreCivic’s share remains strong due to long-term public contracts. Once contracts are set, promotion needs are limited and incremental efficiency gains flow straight to cash.
Mature detention facilities with stable occupancy
Mature detention facilities operate like clockwork, with CoreCivic reporting stabilized site occupancy near 92% in 2024 and delivering consistent margins as high-share, low-growth assets. These sites generate dependable cashflow and require tight compliance management to keep incidents minimal. Management focuses on shaving cost per inmate while preserving service quality and contractual performance.
Ancillary in-facility services tied to existing contracts
Ancillary in-facility services ride the core contract (e.g., basic programs, commissary logistics), generating recurring high-margin revenue with limited upside; CoreCivic reported ancillary-related sales contributing about 10% of contract revenue in 2024, yielding mid-teens EBITDA margins.
Once embedded minimal selling is needed; standardizing delivery (checklists, regional hubs) reduces overhead and preserves margins while growth remains low-single-digit annually.
- Revenue mix: ancillary ≈10% of contract revenue (2024)
- Profitability: mid-teens EBITDA margin (2024)
- Growth: low-single-digit CAGR
- Strategy: standardize delivery, regional logistics hubs, minimal sales effort
O&M contracts: steady per-diem cash, low capex, annuity revenue and high occupancy
Long-term state O&M contracts yield stable per-diem cash flows; CoreCivic reported $1.8B revenue in 2023 and ~92% stabilized occupancy in 2024. Ancillaries ≈10% of contract revenue with mid-teens EBITDA margins. Capex limited to maintenance, preserving free cash for dividends and debt paydown.
| Metric | 2023/2024 |
|---|---|
| Revenue | $1.8B (2023) |
| Occupancy | 92% (2024) |
| Ancillary | ≈10% |
| EBITDA margin | Mid-teens |
Full Transparency, Always
CoreCivic BCG Matrix
The file you're previewing is the exact CoreCivic BCG Matrix you'll receive after purchase. No watermarks, no demo copy—just the fully formatted strategic report ready for immediate use. It's editable, printable, and presentation-ready for your team or board. Delivered instantly after checkout with clear, market-backed analysis. No surprises—just plug-and-play strategy.
Original: $10.00
-65%$10.00
$3.50Description
See the Bigger Picture
Curious where CoreCivic’s assets sit—market leaders, steady earners, or resource drains? This CoreCivic BCG Matrix preview maps the high-level moves; the full report gives quadrant-by-quadrant placements, data-backed recommendations, and a ready-to-use strategy. Buy the complete BCG Matrix for a detailed Word report plus an editable Excel summary and start reallocating capital with confidence. Purchase now and skip the guesswork.
Stars
ICE detention network in high-demand regions
High share across key Southwestern corridors, with CoreCivic operating numerous ICE-contracted facilities that governments lean on during surges; ICE average daily population exceeded 30,000 in 2024, pushing demand above standard prison trends. Growth has outpaced traditional corrections demand, though choppy; continue investing in readiness, compliance, and speed-to-activate. Hold share now; contracts and stable utilization can mature into dependable cash flow.
Company-owned, large-scale prisons with rapid activation
Company-owned, large-scale prisons are CoreCivic’s flagship assets: modern, scalable, and already financed, with CoreCivic operating as a public company (NYSE: CXW). Agencies prioritize capacity that can be turned on quickly, and CoreCivic is frequently the go-to provider in surge situations. Growth persists in select states facing crowding pressure such as Texas and Florida. Maintaining uptime and robust staffing pipelines is essential to defend its lead.
Federal and state surge-capacity partnerships
When populations spike governments call first-movers, and CoreCivic’s national footprint and logistics network secure a disproportionate share of urgent federal and state surge awards. Growth cycles for these surge-capacity contracts are sharp and capital-intensive, creating heavy short-term cash needs while delivering outsized contract wins. The strategy pays off when response speed and compliance drive renewals and premium pricing, so keeping the bench and regulatory controls tight is essential.
High-security facility management in growth states
State-level incarceration is broadly flat, but growth corridors in Texas, Florida and parts of the Southwest show rising demand; CoreCivic held a leading presence in these states and operated roughly 60,000 beds nationwide in 2024, giving it strong share where new public beds are constrained. These star contracts require heavy onsite support and oversight, so protecting wins hinges on KPI leadership and maintaining low incident rates to secure renewals and premium pricing.
- Focus: high-security growth corridors (TX, FL, AZ)
- Asset: ~60,000 beds nationwide (2024)
- Risk: high operational support and oversight
- Protect: KPI leadership, low incidents, contract renewals
Integrated detention services bundle (housing + care + ops)
Integrated detention services bundle (housing + care + ops) positions CoreCivic as a Star in the BCG matrix by winning complex RFPs and crowding out specialists; government buyers prefer fewer vendors when stakes are high. Execution costs are tangible, so cash inflows often track outflows during growth spikes; investment secures multi-year (5–15 year) terms and pricing power.
- End-to-end wins: complex RFPs
- Buyer preference: fewer vendors
- Cash flow: growth spikes ≈ matched inflow/outflow
- Invest: lock 5–15 year terms, pricing power
SW growth corridors: ~60,000 beds, ICE ADP >30,000 — ops-heavy path to durable cash flow
CoreCivic is a Star in SW growth corridors (TX, FL, AZ) with ~60,000 beds nationwide in 2024 and strong ICE exposure as ICE ADP exceeded 30,000 in 2024. Rapid surge wins and 5–15 year contracts drive growth but require heavy ops spend, KPI focus, and low incident rates to convert to durable cash flow.
| Metric | 2024 | Note |
|---|---|---|
| Beds | ~60,000 | Company-owned |
| ICE ADP | >30,000 | Federal demand spike |
| Contract length | 5–15 yrs | Pricing power |
What is included in the product
Detailed Word Document
CoreCivic BCG Matrix review identifying Stars, Cash Cows, Question Marks and Dogs with targeted invest, hold or divest guidance.
Customizable Excel Spreadsheet
One-page CoreCivic BCG Matrix highlighting problem units and quick fixes for executive decisions
Cash Cows
Long-term state prison O&M contracts in mature markets
Long-term state prison O&M contracts in mature markets deliver stable populations, known standards and predictable per-diem economics, positioning these assets as cash cows for CoreCivic in 2024. CoreCivic already holds a leading share of state O&M contracts and relies on minimal promotional spend, with performance-driven renewals sustaining revenue streams. Focus on optimizing staffing, maintenance cycles and utilities will widen margins and protect cash flow.
CoreCivic Properties: lease-only government arrangements
CoreCivic Properties leases facilities to government customers while third parties operate them, producing steady, rent-like cash flows with low organic growth and high reliability.
Capex is concentrated on maintenance and compliance rather than expansion, yielding predictable returns that resemble lease income and support conservative dividend and debt strategies.
Management should focus on extracting free cash from the asset base, refinancing at lower rates when available, and structuring tight occupancy guarantees to preserve cash visibility and downside protection.
Per-diem beds with minimum guarantees
Per-diem beds with minimum guarantees provide a revenue floor that reduces volatility and boosts free cash flow; CoreCivic reported roughly $1.8B revenue in 2023, and guaranteed-occupancy contracts typically lock in 85–95% of beds. Market growth is modest but CoreCivic’s share remains strong due to long-term public contracts. Once contracts are set, promotion needs are limited and incremental efficiency gains flow straight to cash.
Mature detention facilities with stable occupancy
Mature detention facilities operate like clockwork, with CoreCivic reporting stabilized site occupancy near 92% in 2024 and delivering consistent margins as high-share, low-growth assets. These sites generate dependable cashflow and require tight compliance management to keep incidents minimal. Management focuses on shaving cost per inmate while preserving service quality and contractual performance.
Ancillary in-facility services tied to existing contracts
Ancillary in-facility services ride the core contract (e.g., basic programs, commissary logistics), generating recurring high-margin revenue with limited upside; CoreCivic reported ancillary-related sales contributing about 10% of contract revenue in 2024, yielding mid-teens EBITDA margins.
Once embedded minimal selling is needed; standardizing delivery (checklists, regional hubs) reduces overhead and preserves margins while growth remains low-single-digit annually.
- Revenue mix: ancillary ≈10% of contract revenue (2024)
- Profitability: mid-teens EBITDA margin (2024)
- Growth: low-single-digit CAGR
- Strategy: standardize delivery, regional logistics hubs, minimal sales effort
O&M contracts: steady per-diem cash, low capex, annuity revenue and high occupancy
Long-term state O&M contracts yield stable per-diem cash flows; CoreCivic reported $1.8B revenue in 2023 and ~92% stabilized occupancy in 2024. Ancillaries ≈10% of contract revenue with mid-teens EBITDA margins. Capex limited to maintenance, preserving free cash for dividends and debt paydown.
| Metric | 2023/2024 |
|---|---|
| Revenue | $1.8B (2023) |
| Occupancy | 92% (2024) |
| Ancillary | ≈10% |
| EBITDA margin | Mid-teens |
Full Transparency, Always
CoreCivic BCG Matrix
The file you're previewing is the exact CoreCivic BCG Matrix you'll receive after purchase. No watermarks, no demo copy—just the fully formatted strategic report ready for immediate use. It's editable, printable, and presentation-ready for your team or board. Delivered instantly after checkout with clear, market-backed analysis. No surprises—just plug-and-play strategy.











