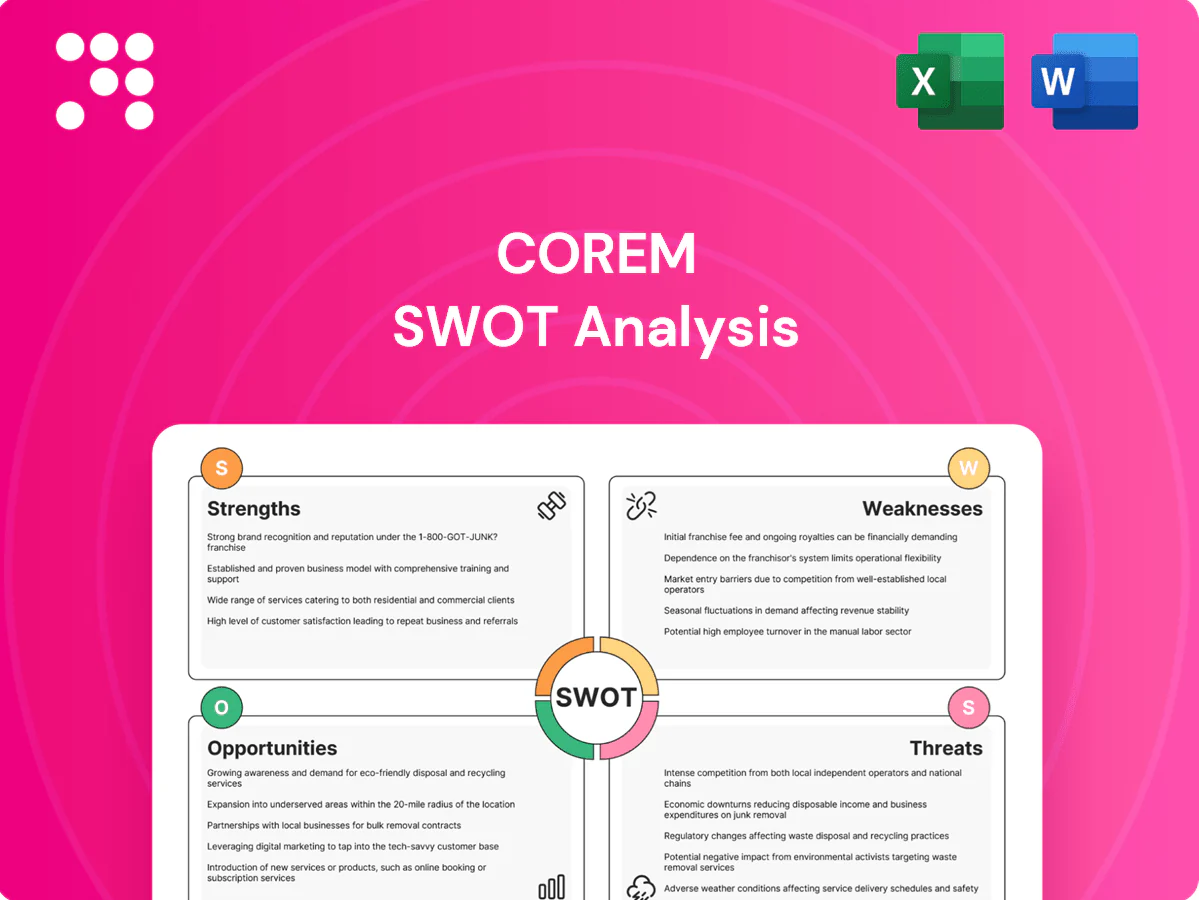
Corem SWOT Analysis

Elevate Your Analysis with the Complete SWOT Report
Explore Corem’s competitive edge and risk profile with our focused SWOT snapshot—highlighting portfolio strengths, market exposures, and growth levers. Want the full strategic picture? Purchase the complete SWOT analysis for a research-backed, editable Word and Excel package to support investment, planning, and presentation needs.
Strengths

Prime logistics footprint
Assets clustered near major transport hubs reduce last‑mile costs and improve tenant productivity by shortening delivery distances and turnaround times. This locational advantage supports resilient occupancy and premium rent potential through stronger tenant demand. It also enhances re‑leasing velocity in downturns and proximity to infrastructure underpins long‑term asset relevance.
Focused industrial portfolio
Corem’s specialization in logistics, warehouse and retail-for-business concentrates operating expertise, enabling standardized asset management that streamlines maintenance, leasing and capital allocation. This focused industrial portfolio improves underwriting accuracy and risk control through repeatable cash-flow profiles. The concentration strengthens brand credibility with industrial tenants, supporting longer leases and operational partnerships.

Active property management
Hands-on leasing and targeted capex unlocked NOI growth of 6.2% y/y in 2024, outpacing local market rent drift; portfolio occupancy stood at 93% mid‑2025. Tenant mix curation and space optimization shortened downtime, cutting average vacancy periods by nearly 20%. Data‑driven maintenance reduced lifecycle costs and improved asset yields, a discipline that compounds value creation over time.

Development and repositioning capability
Corem's in-house development enables build-to-suit and value-add projects closely aligned with tenant demand, while active repositioning of older assets preserves competitiveness and advances ESG compliance; a controlled pipeline provides disciplined growth and optionality across cycles, avoiding the need to overpay for already-stabilized properties.
Tenant base serving B2B needs
Tenant base focused on industrial and business services prioritizes functionality and reliability, creating sticky occupancy and lower churn; leases commonly include indexation or contractual step-ups, supporting predictable cash flows. Mission-critical site selection reduces relocation risk and underpins stable, recurring revenue for Corem.
- Sticky occupancy from B2B tenants
- Leases with indexation/step-ups
- Mission-critical locations lower churn
Logistics portfolio drives predictable cash flow: +6.2% NOI, 93% occ.
Corem’s strategically located logistics and industrial portfolio drove NOI +6.2% y/y in 2024 and 93% occupancy mid-2025, with vacancy durations down ~20%. Focused asset management and in-house build-to-suit support predictable, indexed cash flows and faster reletting. Controlled pipeline and active repositioning preserve yield and ESG alignment.
| Metric | Value |
|---|---|
| NOI growth 2024 | +6.2% |
| Occupancy mid-2025 | 93% |
| Vacancy reduction | ~20% |
What is included in the product
 Detailed Word Document
Delivers a strategic overview of Corem’s internal and external business factors, outlining strengths, weaknesses, opportunities and threats to assess its competitive position and the risks shaping future growth.

 Customizable Excel Spreadsheet
Corem SWOT Analysis delivers a concise, visual matrix that accelerates strategic alignment and streamlines stakeholder communication; its editable format lets teams quickly update insights to reflect shifting priorities, reducing friction in planning and decision-making.
Weaknesses

Sector concentration risk
Corem's heavy exposure to logistics and industrial properties magnifies cyclical shocks in that segment, so demand shifts or supply gluts can disproportionately depress rents and asset values. Limited diversification reduces natural shock absorbers across the portfolio, keeping downside correlated. As a result, the portfolio's beta to industrial cycles remains elevated, increasing earnings and valuation volatility.
Capital intensity
Corem's warehouses and logistics assets are capital intensive, with a portfolio exceeding 1 million sqm requiring ongoing capex to maintain specifications. Upgrades for automation and ESG compliance can run into millions per site, and multi-year development programs tie up capital for extended periods. In soft markets this raises funding pressure and can push LTVs toward or above the c.50% range, straining liquidity.

Exposure to macro interest rates
As a property owner, Corem remains sensitive to macro interest rates: Sweden's 10-year government yield near 3.5% and a Riksbank repo rate around 4.0% in 2025 push up financing costs, compress investment spreads and can reduce valuations. Rising yields and tighter credit raise refinancing risk on maturing debt. Debt repricing may increase earnings volatility quarter-to-quarter.

Tenant concentration by node
Logistics clusters create local tenant concentration in specific hubs, so a default or relocation in one node can affect several Corem assets simultaneously. Regional vacancy spikes make re-leasing competitive, pressuring rents and void periods. Cash flows across clustered assets become geographically correlated, increasing portfolio volatility and downside risk.
- Tenant-concentration risk
- Node-level default contagion
- Competitive re-leasing if regional vacancy rises
- Geographically correlated cash flows
Retail-adjacent risks
Concentrated logistics portfolio: high beta, heavy capex and refinancing risk as LTV nears 50%
Corem's concentrated logistics/industrial portfolio (1.0M+ sqm) magnifies cyclical downside, keeping portfolio beta high and earnings volatile. High capex for automation/ESG and reconfiguration raises funding needs, risking LTV creep toward c.50% in weak markets. Higher rates (Sweden 10y ~3.5%, Riksbank repo ~4.0% in 2025) increase refinancing pressure. E-commerce (PostNord online ~20% in 2023) strains retail-adjacent assets.
| Metric | Value |
|---|---|
| Portfolio area | 1.0M+ sqm |
| Approx LTV pressure | c.50% |
| Sweden 10y (2025) | ~3.5% |
| Riksbank repo (2025) | ~4.0% |
| Online retail (PostNord 2023) | ~20% |
Full Version Awaits
Corem SWOT Analysis
This is the actual Corem SWOT analysis document you’ll receive upon purchase—no surprises, just professional quality. The preview below is taken directly from the full report you'll get. Buy now to unlock the complete, editable version.

Elevate Your Analysis with the Complete SWOT Report
Explore Corem’s competitive edge and risk profile with our focused SWOT snapshot—highlighting portfolio strengths, market exposures, and growth levers. Want the full strategic picture? Purchase the complete SWOT analysis for a research-backed, editable Word and Excel package to support investment, planning, and presentation needs.
Strengths
Prime logistics footprint
Assets clustered near major transport hubs reduce last‑mile costs and improve tenant productivity by shortening delivery distances and turnaround times. This locational advantage supports resilient occupancy and premium rent potential through stronger tenant demand. It also enhances re‑leasing velocity in downturns and proximity to infrastructure underpins long‑term asset relevance.
Focused industrial portfolio
Corem’s specialization in logistics, warehouse and retail-for-business concentrates operating expertise, enabling standardized asset management that streamlines maintenance, leasing and capital allocation. This focused industrial portfolio improves underwriting accuracy and risk control through repeatable cash-flow profiles. The concentration strengthens brand credibility with industrial tenants, supporting longer leases and operational partnerships.
Active property management
Hands-on leasing and targeted capex unlocked NOI growth of 6.2% y/y in 2024, outpacing local market rent drift; portfolio occupancy stood at 93% mid‑2025. Tenant mix curation and space optimization shortened downtime, cutting average vacancy periods by nearly 20%. Data‑driven maintenance reduced lifecycle costs and improved asset yields, a discipline that compounds value creation over time.
Development and repositioning capability
Corem's in-house development enables build-to-suit and value-add projects closely aligned with tenant demand, while active repositioning of older assets preserves competitiveness and advances ESG compliance; a controlled pipeline provides disciplined growth and optionality across cycles, avoiding the need to overpay for already-stabilized properties.
Tenant base serving B2B needs
Tenant base focused on industrial and business services prioritizes functionality and reliability, creating sticky occupancy and lower churn; leases commonly include indexation or contractual step-ups, supporting predictable cash flows. Mission-critical site selection reduces relocation risk and underpins stable, recurring revenue for Corem.
- Sticky occupancy from B2B tenants
- Leases with indexation/step-ups
- Mission-critical locations lower churn
Logistics portfolio drives predictable cash flow: +6.2% NOI, 93% occ.
Corem’s strategically located logistics and industrial portfolio drove NOI +6.2% y/y in 2024 and 93% occupancy mid-2025, with vacancy durations down ~20%. Focused asset management and in-house build-to-suit support predictable, indexed cash flows and faster reletting. Controlled pipeline and active repositioning preserve yield and ESG alignment.
| Metric | Value |
|---|---|
| NOI growth 2024 | +6.2% |
| Occupancy mid-2025 | 93% |
| Vacancy reduction | ~20% |
What is included in the product
Detailed Word Document
Delivers a strategic overview of Corem’s internal and external business factors, outlining strengths, weaknesses, opportunities and threats to assess its competitive position and the risks shaping future growth.
Customizable Excel Spreadsheet
Corem SWOT Analysis delivers a concise, visual matrix that accelerates strategic alignment and streamlines stakeholder communication; its editable format lets teams quickly update insights to reflect shifting priorities, reducing friction in planning and decision-making.
Weaknesses
Sector concentration risk
Corem's heavy exposure to logistics and industrial properties magnifies cyclical shocks in that segment, so demand shifts or supply gluts can disproportionately depress rents and asset values. Limited diversification reduces natural shock absorbers across the portfolio, keeping downside correlated. As a result, the portfolio's beta to industrial cycles remains elevated, increasing earnings and valuation volatility.
Capital intensity
Corem's warehouses and logistics assets are capital intensive, with a portfolio exceeding 1 million sqm requiring ongoing capex to maintain specifications. Upgrades for automation and ESG compliance can run into millions per site, and multi-year development programs tie up capital for extended periods. In soft markets this raises funding pressure and can push LTVs toward or above the c.50% range, straining liquidity.
Exposure to macro interest rates
As a property owner, Corem remains sensitive to macro interest rates: Sweden's 10-year government yield near 3.5% and a Riksbank repo rate around 4.0% in 2025 push up financing costs, compress investment spreads and can reduce valuations. Rising yields and tighter credit raise refinancing risk on maturing debt. Debt repricing may increase earnings volatility quarter-to-quarter.
Tenant concentration by node
Logistics clusters create local tenant concentration in specific hubs, so a default or relocation in one node can affect several Corem assets simultaneously. Regional vacancy spikes make re-leasing competitive, pressuring rents and void periods. Cash flows across clustered assets become geographically correlated, increasing portfolio volatility and downside risk.
- Tenant-concentration risk
- Node-level default contagion
- Competitive re-leasing if regional vacancy rises
- Geographically correlated cash flows
Retail-adjacent risks
Concentrated logistics portfolio: high beta, heavy capex and refinancing risk as LTV nears 50%
Corem's concentrated logistics/industrial portfolio (1.0M+ sqm) magnifies cyclical downside, keeping portfolio beta high and earnings volatile. High capex for automation/ESG and reconfiguration raises funding needs, risking LTV creep toward c.50% in weak markets. Higher rates (Sweden 10y ~3.5%, Riksbank repo ~4.0% in 2025) increase refinancing pressure. E-commerce (PostNord online ~20% in 2023) strains retail-adjacent assets.
| Metric | Value |
|---|---|
| Portfolio area | 1.0M+ sqm |
| Approx LTV pressure | c.50% |
| Sweden 10y (2025) | ~3.5% |
| Riksbank repo (2025) | ~4.0% |
| Online retail (PostNord 2023) | ~20% |
Full Version Awaits
Corem SWOT Analysis
This is the actual Corem SWOT analysis document you’ll receive upon purchase—no surprises, just professional quality. The preview below is taken directly from the full report you'll get. Buy now to unlock the complete, editable version.
Description
Elevate Your Analysis with the Complete SWOT Report
Explore Corem’s competitive edge and risk profile with our focused SWOT snapshot—highlighting portfolio strengths, market exposures, and growth levers. Want the full strategic picture? Purchase the complete SWOT analysis for a research-backed, editable Word and Excel package to support investment, planning, and presentation needs.
Strengths
Prime logistics footprint
Assets clustered near major transport hubs reduce last‑mile costs and improve tenant productivity by shortening delivery distances and turnaround times. This locational advantage supports resilient occupancy and premium rent potential through stronger tenant demand. It also enhances re‑leasing velocity in downturns and proximity to infrastructure underpins long‑term asset relevance.
Focused industrial portfolio
Corem’s specialization in logistics, warehouse and retail-for-business concentrates operating expertise, enabling standardized asset management that streamlines maintenance, leasing and capital allocation. This focused industrial portfolio improves underwriting accuracy and risk control through repeatable cash-flow profiles. The concentration strengthens brand credibility with industrial tenants, supporting longer leases and operational partnerships.
Active property management
Hands-on leasing and targeted capex unlocked NOI growth of 6.2% y/y in 2024, outpacing local market rent drift; portfolio occupancy stood at 93% mid‑2025. Tenant mix curation and space optimization shortened downtime, cutting average vacancy periods by nearly 20%. Data‑driven maintenance reduced lifecycle costs and improved asset yields, a discipline that compounds value creation over time.
Development and repositioning capability
Corem's in-house development enables build-to-suit and value-add projects closely aligned with tenant demand, while active repositioning of older assets preserves competitiveness and advances ESG compliance; a controlled pipeline provides disciplined growth and optionality across cycles, avoiding the need to overpay for already-stabilized properties.
Tenant base serving B2B needs
Tenant base focused on industrial and business services prioritizes functionality and reliability, creating sticky occupancy and lower churn; leases commonly include indexation or contractual step-ups, supporting predictable cash flows. Mission-critical site selection reduces relocation risk and underpins stable, recurring revenue for Corem.
- Sticky occupancy from B2B tenants
- Leases with indexation/step-ups
- Mission-critical locations lower churn
Logistics portfolio drives predictable cash flow: +6.2% NOI, 93% occ.
Corem’s strategically located logistics and industrial portfolio drove NOI +6.2% y/y in 2024 and 93% occupancy mid-2025, with vacancy durations down ~20%. Focused asset management and in-house build-to-suit support predictable, indexed cash flows and faster reletting. Controlled pipeline and active repositioning preserve yield and ESG alignment.
| Metric | Value |
|---|---|
| NOI growth 2024 | +6.2% |
| Occupancy mid-2025 | 93% |
| Vacancy reduction | ~20% |
What is included in the product
Detailed Word Document
Delivers a strategic overview of Corem’s internal and external business factors, outlining strengths, weaknesses, opportunities and threats to assess its competitive position and the risks shaping future growth.
Customizable Excel Spreadsheet
Corem SWOT Analysis delivers a concise, visual matrix that accelerates strategic alignment and streamlines stakeholder communication; its editable format lets teams quickly update insights to reflect shifting priorities, reducing friction in planning and decision-making.
Weaknesses
Sector concentration risk
Corem's heavy exposure to logistics and industrial properties magnifies cyclical shocks in that segment, so demand shifts or supply gluts can disproportionately depress rents and asset values. Limited diversification reduces natural shock absorbers across the portfolio, keeping downside correlated. As a result, the portfolio's beta to industrial cycles remains elevated, increasing earnings and valuation volatility.
Capital intensity
Corem's warehouses and logistics assets are capital intensive, with a portfolio exceeding 1 million sqm requiring ongoing capex to maintain specifications. Upgrades for automation and ESG compliance can run into millions per site, and multi-year development programs tie up capital for extended periods. In soft markets this raises funding pressure and can push LTVs toward or above the c.50% range, straining liquidity.
Exposure to macro interest rates
As a property owner, Corem remains sensitive to macro interest rates: Sweden's 10-year government yield near 3.5% and a Riksbank repo rate around 4.0% in 2025 push up financing costs, compress investment spreads and can reduce valuations. Rising yields and tighter credit raise refinancing risk on maturing debt. Debt repricing may increase earnings volatility quarter-to-quarter.
Tenant concentration by node
Logistics clusters create local tenant concentration in specific hubs, so a default or relocation in one node can affect several Corem assets simultaneously. Regional vacancy spikes make re-leasing competitive, pressuring rents and void periods. Cash flows across clustered assets become geographically correlated, increasing portfolio volatility and downside risk.
- Tenant-concentration risk
- Node-level default contagion
- Competitive re-leasing if regional vacancy rises
- Geographically correlated cash flows
Retail-adjacent risks
Concentrated logistics portfolio: high beta, heavy capex and refinancing risk as LTV nears 50%
Corem's concentrated logistics/industrial portfolio (1.0M+ sqm) magnifies cyclical downside, keeping portfolio beta high and earnings volatile. High capex for automation/ESG and reconfiguration raises funding needs, risking LTV creep toward c.50% in weak markets. Higher rates (Sweden 10y ~3.5%, Riksbank repo ~4.0% in 2025) increase refinancing pressure. E-commerce (PostNord online ~20% in 2023) strains retail-adjacent assets.
| Metric | Value |
|---|---|
| Portfolio area | 1.0M+ sqm |
| Approx LTV pressure | c.50% |
| Sweden 10y (2025) | ~3.5% |
| Riksbank repo (2025) | ~4.0% |
| Online retail (PostNord 2023) | ~20% |
Full Version Awaits
Corem SWOT Analysis
This is the actual Corem SWOT analysis document you’ll receive upon purchase—no surprises, just professional quality. The preview below is taken directly from the full report you'll get. Buy now to unlock the complete, editable version.











