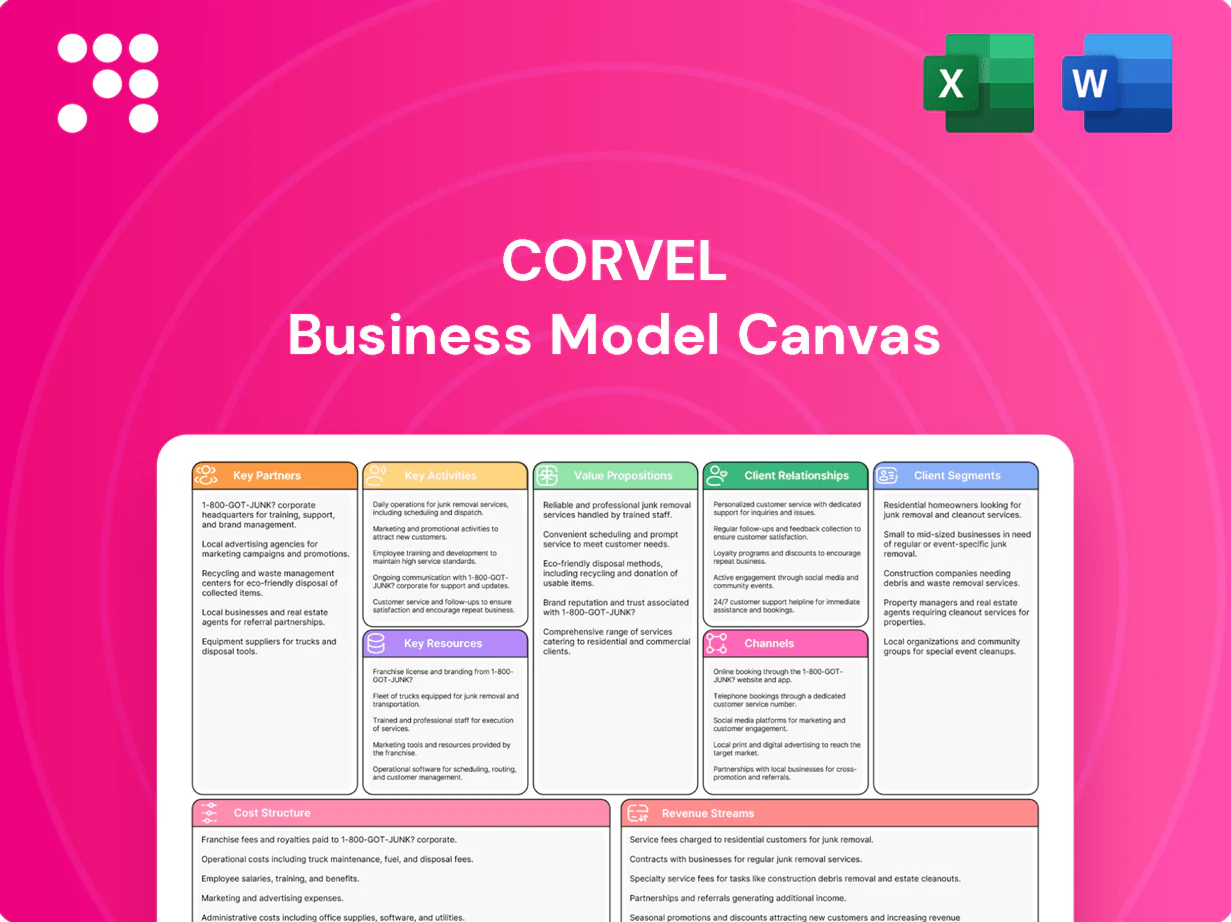
CorVel Business Model Canvas

Unlock the strategic playbook for workers' comp and risk management leaders
Unlock CorVel’s strategic playbook with a concise Business Model Canvas that maps customer segments, core activities, partnerships, revenue streams and cost drivers. This actionable snapshot reveals how CorVel creates and captures value in workers’ comp and risk management. Ideal for investors, consultants, and executives seeking competitive advantage—download the full, editable Canvas to benchmark and implement proven strategies.
Partnerships

Provider networks
CorVel partners with broad medical provider networks covering occupational health, hospitals, specialty care and diagnostics to secure negotiated rates and access. Preferred relationships support faster scheduling and lower costs, and the networks enable national client coverage across all 50 states. These provider ties underpin CorVel’s managed care offerings and claim cost containment strategies.
Insurers & TPAs
Collaborations with carriers and TPAs align workflows and data, supporting CorVel’s platform that helped drive approximately $1.1 billion in revenue in 2023. Shared protocols streamline intake, adjudication, and payment, cutting administrative friction and reducing cycle times. Co-selling and referral programs expand reach across workers’ comp and auto lines, increasing channel penetration and client retention. Integration lowers operational costs and accelerates claim resolution.

Telehealth & PBMs
Alliances with telemedicine platforms and PBMs enable care-at-first-notice and tighter drug cost control; in 2024 telehealth stabilized at about 15% of US outpatient encounters while PBMs process roughly 90% of prescription claims. Real-time authorization and formulary checks curb leakage at the point of care. Virtual visits accelerate return-to-work decisions and shared data strengthens utilization management and cost containment.

Data & tech vendors
Data and tech vendors supply claims, clinical, and benchmarking datasets plus cloud and AI tooling, enabling CorVel to integrate external inputs into care and cost workflows. Secure hosting, APIs, and interoperability raise scalability across platforms. Vendor SLAs commonly guarantee 99.9–99.99% uptime and regulatory compliance, while datasets span tens of millions of claims to improve predictive modeling.
- Datasets: tens of millions of claims
- Uptime: 99.9–99.99% SLA
- APIs: interoperability for scale
- Impact: external data boosts predictive models
Regulatory & compliance
Engagement with regulators and standards bodies ensures CorVel aligns policy across 50 state jurisdictions and federal guidance, with continuous rule scans in 2024 to prevent service disruption. State-specific compliance advisors interpret variable workers’ comp statutes to minimize claims delays. Audit-ready processes reduce penalties and disputes and support faster resolution timelines.
- 50 states coverage
- Quarterly regulatory scans (2024)
- State-focused compliance advisors
- Audit-ready controls to cut disputes
Managed-care networks enable cost containment and $1.1B revenue
CorVel secures broad provider networks for negotiated rates and national access, underpinning managed care and cost containment. Carrier and TPA alliances align workflows and supported roughly $1.1B revenue in 2023, improving cycle times. Telemedicine and PBM partnerships (telehealth ~15% of outpatient visits in 2024; PBMs ~90% claim share) plus tech vendors (tens of millions claims; SLA 99.9–99.99%) enable scale and compliance.
| Metric | Value |
|---|---|
| Revenue 2023 | $1.1B |
| Telehealth 2024 | ~15% |
| PBM claim share | ~90% |
| Claims dataset | tens of millions |
| SLA | 99.9–99.99% |
| State coverage | 50 |
What is included in the product
 Detailed Word Document
A comprehensive, pre-written Business Model Canvas for CorVel outlining customer segments, channels, value propositions, revenue streams, key partners, activities, resources, cost structure and customer relationships in full narrative detail. Ideal for presentations, investor discussions and strategic planning, it links SWOT insights and competitive advantages to each BMC block to support data-driven decisions.

 Customizable Excel Spreadsheet
Condenses CorVel’s healthcare and risk-management strategy into a digestible one-page snapshot, saving hours of structuring while providing an editable, shareable canvas for fast team collaboration and executive decision-making.
Activities

Claims optimization
Design workflows to triage, route, and resolve claims with automation that cuts manual touch points and errors, while monitoring KPIs such as cycle time and severity to drive continuous improvement; processes are iterated using outcomes data and A/B testing to lower cost per claim and improve resolution speed.
Clinical case mgmt
Clinical case management coordinates nurse-led case management and return-to-work plans, enforcing evidence-based care pathways; CorVel supported these functions across its $1.08 billion 2024 platform. It centralizes communication among providers, employers, and adjusters to speed decisions and vocational planning. Complex cases are flagged and escalated proactively to specialty teams to limit medical spend and lost-time.

Analytics & modeling
Building predictive and prescriptive models to detect risk, fraud, and utilization drives cost containment across CorVel’s $1.05B 2024 managed spend; models feed dashboards and sub‑hour alerts for payers, employers, and clinicians, generating actionable interventions that cut claim leakage and utilization. Continuous validation ties model signals to real‑world outcomes to refine accuracy and improve ROI.

Platform development
Platform development advances CorVel's modular stack—intake, bill review, PPO, and payments—prioritizing secure, interoperable, and scalable architectures. Teams deliver RESTful APIs and UI enhancements while upholding 99.9%+ uptime and performance SLAs to ensure continuous claims processing and revenue cycle stability.
- modules: intake, bill review, PPO, payments
- focus: security, interoperability, scalability
- deliverables: APIs, UI enhancements
- ops: 99.9%+ uptime SLAs
Compliance & QA
Compliance & QA audits workflows against state and federal regulations, manages documentation and certifications, and trains staff on policy and privacy to sustain regulatory readiness; CorVel reported approximately $1.03 billion revenue in 2024, underscoring scale where robust QA prevents costly defects and fines.
- Audits: regulatory alignment
- Docs: certifications & records
- Training: policy & privacy
- QI: continuous defect prevention
Automated claims, nurse-led care and predictive billing reducing costs across $1B+ platform
Design and automate claims workflows to reduce manual touches and cycle time, iterating via A/B tests to cut cost per claim. Clinical case management coordinates nurse-led care and RTW plans across a $1.08B 2024 platform, escalating complex cases. Predictive models and bill-review platform (99.9%+ uptime) manage $1.05B spend and support compliance for $1.03B 2024 revenue.
| Metric | 2024 |
|---|---|
| Revenue | $1.03B |
| Platform managed | $1.08B |
| Managed spend | $1.05B |
| Uptime SLA | 99.9%+ |
Delivered as Displayed
Business Model Canvas
The document you're previewing is the exact Business Model Canvas you'll receive after purchase. It's not a mockup or sample—what you see is a live extract of the final file. After buying, you'll instantly download the complete, editable document in Word and Excel formats.

Unlock the strategic playbook for workers' comp and risk management leaders
Unlock CorVel’s strategic playbook with a concise Business Model Canvas that maps customer segments, core activities, partnerships, revenue streams and cost drivers. This actionable snapshot reveals how CorVel creates and captures value in workers’ comp and risk management. Ideal for investors, consultants, and executives seeking competitive advantage—download the full, editable Canvas to benchmark and implement proven strategies.
Partnerships
Provider networks
CorVel partners with broad medical provider networks covering occupational health, hospitals, specialty care and diagnostics to secure negotiated rates and access. Preferred relationships support faster scheduling and lower costs, and the networks enable national client coverage across all 50 states. These provider ties underpin CorVel’s managed care offerings and claim cost containment strategies.
Insurers & TPAs
Collaborations with carriers and TPAs align workflows and data, supporting CorVel’s platform that helped drive approximately $1.1 billion in revenue in 2023. Shared protocols streamline intake, adjudication, and payment, cutting administrative friction and reducing cycle times. Co-selling and referral programs expand reach across workers’ comp and auto lines, increasing channel penetration and client retention. Integration lowers operational costs and accelerates claim resolution.
Telehealth & PBMs
Alliances with telemedicine platforms and PBMs enable care-at-first-notice and tighter drug cost control; in 2024 telehealth stabilized at about 15% of US outpatient encounters while PBMs process roughly 90% of prescription claims. Real-time authorization and formulary checks curb leakage at the point of care. Virtual visits accelerate return-to-work decisions and shared data strengthens utilization management and cost containment.
Data & tech vendors
Data and tech vendors supply claims, clinical, and benchmarking datasets plus cloud and AI tooling, enabling CorVel to integrate external inputs into care and cost workflows. Secure hosting, APIs, and interoperability raise scalability across platforms. Vendor SLAs commonly guarantee 99.9–99.99% uptime and regulatory compliance, while datasets span tens of millions of claims to improve predictive modeling.
- Datasets: tens of millions of claims
- Uptime: 99.9–99.99% SLA
- APIs: interoperability for scale
- Impact: external data boosts predictive models
Regulatory & compliance
Engagement with regulators and standards bodies ensures CorVel aligns policy across 50 state jurisdictions and federal guidance, with continuous rule scans in 2024 to prevent service disruption. State-specific compliance advisors interpret variable workers’ comp statutes to minimize claims delays. Audit-ready processes reduce penalties and disputes and support faster resolution timelines.
- 50 states coverage
- Quarterly regulatory scans (2024)
- State-focused compliance advisors
- Audit-ready controls to cut disputes
Managed-care networks enable cost containment and $1.1B revenue
CorVel secures broad provider networks for negotiated rates and national access, underpinning managed care and cost containment. Carrier and TPA alliances align workflows and supported roughly $1.1B revenue in 2023, improving cycle times. Telemedicine and PBM partnerships (telehealth ~15% of outpatient visits in 2024; PBMs ~90% claim share) plus tech vendors (tens of millions claims; SLA 99.9–99.99%) enable scale and compliance.
| Metric | Value |
|---|---|
| Revenue 2023 | $1.1B |
| Telehealth 2024 | ~15% |
| PBM claim share | ~90% |
| Claims dataset | tens of millions |
| SLA | 99.9–99.99% |
| State coverage | 50 |
What is included in the product
Detailed Word Document
A comprehensive, pre-written Business Model Canvas for CorVel outlining customer segments, channels, value propositions, revenue streams, key partners, activities, resources, cost structure and customer relationships in full narrative detail. Ideal for presentations, investor discussions and strategic planning, it links SWOT insights and competitive advantages to each BMC block to support data-driven decisions.
Customizable Excel Spreadsheet
Condenses CorVel’s healthcare and risk-management strategy into a digestible one-page snapshot, saving hours of structuring while providing an editable, shareable canvas for fast team collaboration and executive decision-making.
Activities
Claims optimization
Design workflows to triage, route, and resolve claims with automation that cuts manual touch points and errors, while monitoring KPIs such as cycle time and severity to drive continuous improvement; processes are iterated using outcomes data and A/B testing to lower cost per claim and improve resolution speed.
Clinical case mgmt
Clinical case management coordinates nurse-led case management and return-to-work plans, enforcing evidence-based care pathways; CorVel supported these functions across its $1.08 billion 2024 platform. It centralizes communication among providers, employers, and adjusters to speed decisions and vocational planning. Complex cases are flagged and escalated proactively to specialty teams to limit medical spend and lost-time.
Analytics & modeling
Building predictive and prescriptive models to detect risk, fraud, and utilization drives cost containment across CorVel’s $1.05B 2024 managed spend; models feed dashboards and sub‑hour alerts for payers, employers, and clinicians, generating actionable interventions that cut claim leakage and utilization. Continuous validation ties model signals to real‑world outcomes to refine accuracy and improve ROI.
Platform development
Platform development advances CorVel's modular stack—intake, bill review, PPO, and payments—prioritizing secure, interoperable, and scalable architectures. Teams deliver RESTful APIs and UI enhancements while upholding 99.9%+ uptime and performance SLAs to ensure continuous claims processing and revenue cycle stability.
- modules: intake, bill review, PPO, payments
- focus: security, interoperability, scalability
- deliverables: APIs, UI enhancements
- ops: 99.9%+ uptime SLAs
Compliance & QA
Compliance & QA audits workflows against state and federal regulations, manages documentation and certifications, and trains staff on policy and privacy to sustain regulatory readiness; CorVel reported approximately $1.03 billion revenue in 2024, underscoring scale where robust QA prevents costly defects and fines.
- Audits: regulatory alignment
- Docs: certifications & records
- Training: policy & privacy
- QI: continuous defect prevention
Automated claims, nurse-led care and predictive billing reducing costs across $1B+ platform
Design and automate claims workflows to reduce manual touches and cycle time, iterating via A/B tests to cut cost per claim. Clinical case management coordinates nurse-led care and RTW plans across a $1.08B 2024 platform, escalating complex cases. Predictive models and bill-review platform (99.9%+ uptime) manage $1.05B spend and support compliance for $1.03B 2024 revenue.
| Metric | 2024 |
|---|---|
| Revenue | $1.03B |
| Platform managed | $1.08B |
| Managed spend | $1.05B |
| Uptime SLA | 99.9%+ |
Delivered as Displayed
Business Model Canvas
The document you're previewing is the exact Business Model Canvas you'll receive after purchase. It's not a mockup or sample—what you see is a live extract of the final file. After buying, you'll instantly download the complete, editable document in Word and Excel formats.
Description
Unlock the strategic playbook for workers' comp and risk management leaders
Unlock CorVel’s strategic playbook with a concise Business Model Canvas that maps customer segments, core activities, partnerships, revenue streams and cost drivers. This actionable snapshot reveals how CorVel creates and captures value in workers’ comp and risk management. Ideal for investors, consultants, and executives seeking competitive advantage—download the full, editable Canvas to benchmark and implement proven strategies.
Partnerships
Provider networks
CorVel partners with broad medical provider networks covering occupational health, hospitals, specialty care and diagnostics to secure negotiated rates and access. Preferred relationships support faster scheduling and lower costs, and the networks enable national client coverage across all 50 states. These provider ties underpin CorVel’s managed care offerings and claim cost containment strategies.
Insurers & TPAs
Collaborations with carriers and TPAs align workflows and data, supporting CorVel’s platform that helped drive approximately $1.1 billion in revenue in 2023. Shared protocols streamline intake, adjudication, and payment, cutting administrative friction and reducing cycle times. Co-selling and referral programs expand reach across workers’ comp and auto lines, increasing channel penetration and client retention. Integration lowers operational costs and accelerates claim resolution.
Telehealth & PBMs
Alliances with telemedicine platforms and PBMs enable care-at-first-notice and tighter drug cost control; in 2024 telehealth stabilized at about 15% of US outpatient encounters while PBMs process roughly 90% of prescription claims. Real-time authorization and formulary checks curb leakage at the point of care. Virtual visits accelerate return-to-work decisions and shared data strengthens utilization management and cost containment.
Data & tech vendors
Data and tech vendors supply claims, clinical, and benchmarking datasets plus cloud and AI tooling, enabling CorVel to integrate external inputs into care and cost workflows. Secure hosting, APIs, and interoperability raise scalability across platforms. Vendor SLAs commonly guarantee 99.9–99.99% uptime and regulatory compliance, while datasets span tens of millions of claims to improve predictive modeling.
- Datasets: tens of millions of claims
- Uptime: 99.9–99.99% SLA
- APIs: interoperability for scale
- Impact: external data boosts predictive models
Regulatory & compliance
Engagement with regulators and standards bodies ensures CorVel aligns policy across 50 state jurisdictions and federal guidance, with continuous rule scans in 2024 to prevent service disruption. State-specific compliance advisors interpret variable workers’ comp statutes to minimize claims delays. Audit-ready processes reduce penalties and disputes and support faster resolution timelines.
- 50 states coverage
- Quarterly regulatory scans (2024)
- State-focused compliance advisors
- Audit-ready controls to cut disputes
Managed-care networks enable cost containment and $1.1B revenue
CorVel secures broad provider networks for negotiated rates and national access, underpinning managed care and cost containment. Carrier and TPA alliances align workflows and supported roughly $1.1B revenue in 2023, improving cycle times. Telemedicine and PBM partnerships (telehealth ~15% of outpatient visits in 2024; PBMs ~90% claim share) plus tech vendors (tens of millions claims; SLA 99.9–99.99%) enable scale and compliance.
| Metric | Value |
|---|---|
| Revenue 2023 | $1.1B |
| Telehealth 2024 | ~15% |
| PBM claim share | ~90% |
| Claims dataset | tens of millions |
| SLA | 99.9–99.99% |
| State coverage | 50 |
What is included in the product
Detailed Word Document
A comprehensive, pre-written Business Model Canvas for CorVel outlining customer segments, channels, value propositions, revenue streams, key partners, activities, resources, cost structure and customer relationships in full narrative detail. Ideal for presentations, investor discussions and strategic planning, it links SWOT insights and competitive advantages to each BMC block to support data-driven decisions.
Customizable Excel Spreadsheet
Condenses CorVel’s healthcare and risk-management strategy into a digestible one-page snapshot, saving hours of structuring while providing an editable, shareable canvas for fast team collaboration and executive decision-making.
Activities
Claims optimization
Design workflows to triage, route, and resolve claims with automation that cuts manual touch points and errors, while monitoring KPIs such as cycle time and severity to drive continuous improvement; processes are iterated using outcomes data and A/B testing to lower cost per claim and improve resolution speed.
Clinical case mgmt
Clinical case management coordinates nurse-led case management and return-to-work plans, enforcing evidence-based care pathways; CorVel supported these functions across its $1.08 billion 2024 platform. It centralizes communication among providers, employers, and adjusters to speed decisions and vocational planning. Complex cases are flagged and escalated proactively to specialty teams to limit medical spend and lost-time.
Analytics & modeling
Building predictive and prescriptive models to detect risk, fraud, and utilization drives cost containment across CorVel’s $1.05B 2024 managed spend; models feed dashboards and sub‑hour alerts for payers, employers, and clinicians, generating actionable interventions that cut claim leakage and utilization. Continuous validation ties model signals to real‑world outcomes to refine accuracy and improve ROI.
Platform development
Platform development advances CorVel's modular stack—intake, bill review, PPO, and payments—prioritizing secure, interoperable, and scalable architectures. Teams deliver RESTful APIs and UI enhancements while upholding 99.9%+ uptime and performance SLAs to ensure continuous claims processing and revenue cycle stability.
- modules: intake, bill review, PPO, payments
- focus: security, interoperability, scalability
- deliverables: APIs, UI enhancements
- ops: 99.9%+ uptime SLAs
Compliance & QA
Compliance & QA audits workflows against state and federal regulations, manages documentation and certifications, and trains staff on policy and privacy to sustain regulatory readiness; CorVel reported approximately $1.03 billion revenue in 2024, underscoring scale where robust QA prevents costly defects and fines.
- Audits: regulatory alignment
- Docs: certifications & records
- Training: policy & privacy
- QI: continuous defect prevention
Automated claims, nurse-led care and predictive billing reducing costs across $1B+ platform
Design and automate claims workflows to reduce manual touches and cycle time, iterating via A/B tests to cut cost per claim. Clinical case management coordinates nurse-led care and RTW plans across a $1.08B 2024 platform, escalating complex cases. Predictive models and bill-review platform (99.9%+ uptime) manage $1.05B spend and support compliance for $1.03B 2024 revenue.
| Metric | 2024 |
|---|---|
| Revenue | $1.03B |
| Platform managed | $1.08B |
| Managed spend | $1.05B |
| Uptime SLA | 99.9%+ |
Delivered as Displayed
Business Model Canvas
The document you're previewing is the exact Business Model Canvas you'll receive after purchase. It's not a mockup or sample—what you see is a live extract of the final file. After buying, you'll instantly download the complete, editable document in Word and Excel formats.











