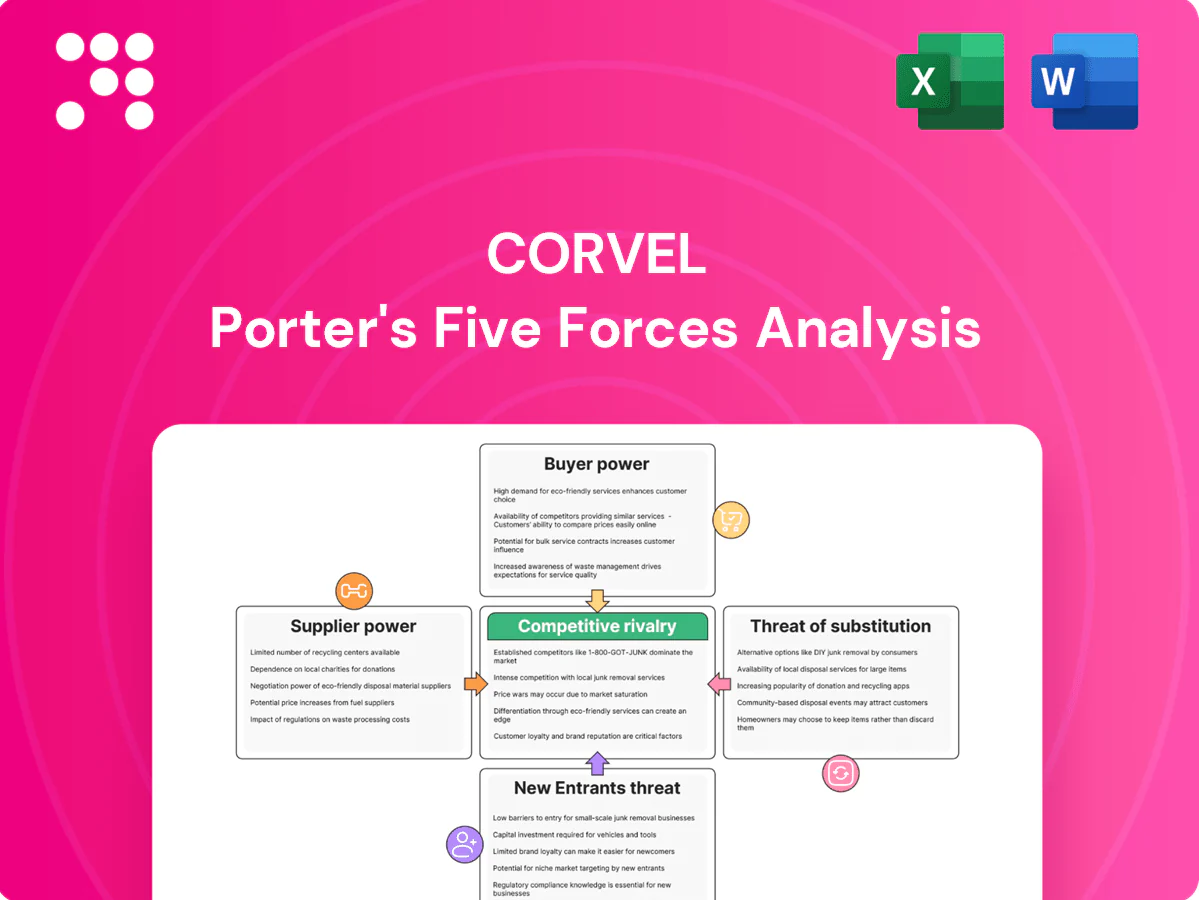
CorVel Porter's Five Forces Analysis

Go Beyond the Preview—Access the Full Strategic Report
CorVel operates in a specialized healthcare claims and risk management market where buyer power, supplier relationships, regulatory pressures, and tech-driven substitutes shape margins and growth. Our snapshot highlights key competitive tensions and strategic levers CorVel can exploit. This brief only scratches the surface. Unlock the full Porter's Five Forces Analysis to explore CorVel’s competitive dynamics in detail.
Suppliers Bargaining Power

Specialty clinical networks
CorVel relies on physician, therapy, imaging and pharmacy networks for cost-effective access, with specialized providers able to command premium rates or exclusivity that raise supplier bargaining power.
Multi-source contracting and broad national networks limit that leverage by enabling alternative routing and price pressure.
Rigorous credentialing and outcomes reporting increase switching options and impose performance pressure on specialty suppliers.
Data and software vendors
Claims data, eligibility feeds, and third-party analytics materially enrich CorVel’s platforms, creating dependence on data and software vendors whose proprietary datasets and unique APIs increase supplier pricing power and switching costs. Standard data formats, open APIs, and growing alternative vendors lessen lock-in and enable negotiation leverage. Long-term contracts with SLAs preserve continuity and shift some risk back to suppliers.

Cloud and infrastructure providers
Cloud hosting, AI compute and security services underpin CorVel’s scalability and compliance, with hyperscalers like AWS (≈32% 2024), Azure (≈23%) and Google Cloud (≈11%) holding pricing power but offering tiered discounts and Savings Plans up to ~72% off. Multi-cloud is used by ~81% of enterprises in 2024 and reserved instances mitigate cost risk. Vendor SOC 2, ISO 27001 and HIPAA certifications narrow viable supplier choices.

Clinical labor and UR professionals
Nurses, case managers and UR clinicians remained scarce in 2024, pushing supplier leverage higher as wage inflation lifted RN and clinician pay (roughly 10% cumulative growth 2021–24) and vacancy rates stayed in double digits. CorVel uses targeted training, workflow tools and hybrid staffing to blunt pressure and control costs. Automation and AI-driven triage cut reliance on peak human capacity and improve throughput.
- Labor scarcity: double-digit vacancy pressure in 2024
- Wage inflation: ~10% cumulative RN/clinician pay growth 2021–24
- CorVel offsets: training, workflow tools, hybrid staffing
- Automation: reduces peak human capacity needs
Regulatory and guideline bodies
- 2024 regulatory updates: implementation cost impact ~10-20%
- Limited supplier timeline control increases audit and workflow risk
- Mitigation: continuous monitoring and configurable rules engines
Moderate supplier power: hyperscalers dominate; RN pay +10%; regs add 10–20% cost
Supplier power is moderate: specialty providers and data vendors can demand premiums, but national networks and multi-source contracts limit leverage.
Hyperscalers (AWS 32%, Azure 23%, GCP 11% in 2024) and certified vendors hold pricing power for cloud and security.
Labor scarcity (double-digit vacancies) and ~10% RN pay growth 2021–24 increase wage pressure; automation and training mitigate.
2024 regulatory patches raised vendor implementation costs ~10–20%, boosting supplier influence on timelines.
| Metric | 2024 |
|---|---|
| AWS share | ≈32% |
| RN pay growth | ~10% |
| Regulatory cost impact | 10–20% |
What is included in the product
 Detailed Word Document
Uncovers key drivers of competition, customer influence, and market entry risks tailored exclusively for CorVel, assessing supplier and buyer power, substitute threats, and industry rivalry. Detailed, actionable insights highlight disruptive forces, barriers protecting incumbents, and strategic levers to defend and grow CorVel’s market position.

 Customizable Excel Spreadsheet
A concise CorVel Porter's Five Forces one-sheet that visualizes competitive pressure with a spider chart, lets you customize force levels for evolving claims, regulation or new entrants, and drops cleanly into decks or Excel dashboards—no macros, simple for non‑finance users.
Customers Bargaining Power

Large insurers and TPAs
Large national insurers and TPAs consolidate claims volume and negotiate aggressively with vendors, driving RFP-driven procurement that compresses provider margins; multi-year contracts for vendors like CorVel increasingly hinge on KPIs and outcomes guarantees tied to cost containment and clinical metrics. Strong referenceability and multi-line coverage across medical, disability, and managed care services bolster CorVel’s negotiating position and renewal prospects.
Self-insured employers
Fortune 1000 self-insured employers, with over 90% of large firms self-funding health costs, benchmark vendors on total cost of risk and measurable employee outcomes. Consolidated spend across national accounts gives them leverage to demand price concessions and deep customization. Vendors that show documented ROI and rapid implementations face lower price sensitivity. Real-time dashboards and transparency create operational stickiness.

Government and quasi-public plans
State funds and municipal programs are highly price-sensitive and process-heavy; government payers accounted for roughly 49% of US health spending in 2023 (CMS), pressuring rates and discounts. Strict compliance requirements raise switching barriers—multi-year procurements and auditability favor incumbents while capping pricing power. Long procurement cycles (often many quarters) reward vendors with proven audit trails; budget shortfalls amplify discount demands and margin compression for providers like CorVel (CorVel 2023 revenue ~$1.06B).

Ease of switching and integration
Integration of CorVel into claims systems and HRIS raises switching costs because data migration, retraining, and provider re‑certification slow churn; industry 2024 surveys found integration complexity cited by roughly 60% of buyers as a primary retention factor.
Open APIs reduce friction and empower buyer leverage by enabling quicker connectors, but performance dips or security incidents prompt competitive rebids and spike churn risk.
- High switching cost: data migration, retraining, re‑certification
- 2024 stat: ~60% cite integration complexity
- Open APIs = lower friction, higher buyer power
- Performance/security failures trigger rebids
Outcome-based pricing expectations
Buyers increasingly demand pay-for-performance and shared-savings models, shifting downside risk onto CorVel and strengthening buyer bargaining power; this trend has driven higher contract scrutiny and price pressure. CorVel’s defense rests on its analytics, validated benchmarks and outcomes track record, which justify premium pricing and limit churn. Transparent methodologies and audited results sustain trust and improve renewal rates.
- Trend: rising buyer demand for outcomes
- Risk: pricing pressure on CorVel
- Defense: analytics + validated benchmarks
- Retention: transparency drives renewals
Buyers drive pressure: insurers/KPIs, employers 90% self‑insured, gov 49% spend
Buyers hold strong leverage: national insurers drive RFPs and KPI-based contracts, compressing margins; large employers (90%+ self‑insured) demand ROI and customization; government payers (49% of US health spend in 2023) force price sensitivity. Integration complexity (60% cite 2024) raises switching costs but open APIs and pay‑for‑performance increase buyer power.
| Buyer | Leverage metric | Impact |
|---|---|---|
| National insurers | RFPs, KPIs | Higher price pressure |
| Fortune 1000 | 90%+ self‑insured | Demand ROI/customization |
| Government | 49% US spend (2023) | Procurement/discounts |
| Integration | 60% cite (2024) | Switching costs |
Preview the Actual Deliverable
CorVel Porter's Five Forces Analysis
This preview shows the CorVel Porter's Five Forces Analysis exactly as delivered—no placeholders or excerpts. The full, professionally formatted document you see here is the same file you’ll receive instantly after purchase. It’s ready for immediate download and use, fully complete and accurate.

Go Beyond the Preview—Access the Full Strategic Report
CorVel operates in a specialized healthcare claims and risk management market where buyer power, supplier relationships, regulatory pressures, and tech-driven substitutes shape margins and growth. Our snapshot highlights key competitive tensions and strategic levers CorVel can exploit. This brief only scratches the surface. Unlock the full Porter's Five Forces Analysis to explore CorVel’s competitive dynamics in detail.
Suppliers Bargaining Power
Specialty clinical networks
CorVel relies on physician, therapy, imaging and pharmacy networks for cost-effective access, with specialized providers able to command premium rates or exclusivity that raise supplier bargaining power.
Multi-source contracting and broad national networks limit that leverage by enabling alternative routing and price pressure.
Rigorous credentialing and outcomes reporting increase switching options and impose performance pressure on specialty suppliers.
Data and software vendors
Claims data, eligibility feeds, and third-party analytics materially enrich CorVel’s platforms, creating dependence on data and software vendors whose proprietary datasets and unique APIs increase supplier pricing power and switching costs. Standard data formats, open APIs, and growing alternative vendors lessen lock-in and enable negotiation leverage. Long-term contracts with SLAs preserve continuity and shift some risk back to suppliers.
Cloud and infrastructure providers
Cloud hosting, AI compute and security services underpin CorVel’s scalability and compliance, with hyperscalers like AWS (≈32% 2024), Azure (≈23%) and Google Cloud (≈11%) holding pricing power but offering tiered discounts and Savings Plans up to ~72% off. Multi-cloud is used by ~81% of enterprises in 2024 and reserved instances mitigate cost risk. Vendor SOC 2, ISO 27001 and HIPAA certifications narrow viable supplier choices.
Clinical labor and UR professionals
Nurses, case managers and UR clinicians remained scarce in 2024, pushing supplier leverage higher as wage inflation lifted RN and clinician pay (roughly 10% cumulative growth 2021–24) and vacancy rates stayed in double digits. CorVel uses targeted training, workflow tools and hybrid staffing to blunt pressure and control costs. Automation and AI-driven triage cut reliance on peak human capacity and improve throughput.
- Labor scarcity: double-digit vacancy pressure in 2024
- Wage inflation: ~10% cumulative RN/clinician pay growth 2021–24
- CorVel offsets: training, workflow tools, hybrid staffing
- Automation: reduces peak human capacity needs
Regulatory and guideline bodies
- 2024 regulatory updates: implementation cost impact ~10-20%
- Limited supplier timeline control increases audit and workflow risk
- Mitigation: continuous monitoring and configurable rules engines
Moderate supplier power: hyperscalers dominate; RN pay +10%; regs add 10–20% cost
Supplier power is moderate: specialty providers and data vendors can demand premiums, but national networks and multi-source contracts limit leverage.
Hyperscalers (AWS 32%, Azure 23%, GCP 11% in 2024) and certified vendors hold pricing power for cloud and security.
Labor scarcity (double-digit vacancies) and ~10% RN pay growth 2021–24 increase wage pressure; automation and training mitigate.
2024 regulatory patches raised vendor implementation costs ~10–20%, boosting supplier influence on timelines.
| Metric | 2024 |
|---|---|
| AWS share | ≈32% |
| RN pay growth | ~10% |
| Regulatory cost impact | 10–20% |
What is included in the product
Detailed Word Document
Uncovers key drivers of competition, customer influence, and market entry risks tailored exclusively for CorVel, assessing supplier and buyer power, substitute threats, and industry rivalry. Detailed, actionable insights highlight disruptive forces, barriers protecting incumbents, and strategic levers to defend and grow CorVel’s market position.
Customizable Excel Spreadsheet
A concise CorVel Porter's Five Forces one-sheet that visualizes competitive pressure with a spider chart, lets you customize force levels for evolving claims, regulation or new entrants, and drops cleanly into decks or Excel dashboards—no macros, simple for non‑finance users.
Customers Bargaining Power
Large insurers and TPAs
Large national insurers and TPAs consolidate claims volume and negotiate aggressively with vendors, driving RFP-driven procurement that compresses provider margins; multi-year contracts for vendors like CorVel increasingly hinge on KPIs and outcomes guarantees tied to cost containment and clinical metrics. Strong referenceability and multi-line coverage across medical, disability, and managed care services bolster CorVel’s negotiating position and renewal prospects.
Self-insured employers
Fortune 1000 self-insured employers, with over 90% of large firms self-funding health costs, benchmark vendors on total cost of risk and measurable employee outcomes. Consolidated spend across national accounts gives them leverage to demand price concessions and deep customization. Vendors that show documented ROI and rapid implementations face lower price sensitivity. Real-time dashboards and transparency create operational stickiness.
Government and quasi-public plans
State funds and municipal programs are highly price-sensitive and process-heavy; government payers accounted for roughly 49% of US health spending in 2023 (CMS), pressuring rates and discounts. Strict compliance requirements raise switching barriers—multi-year procurements and auditability favor incumbents while capping pricing power. Long procurement cycles (often many quarters) reward vendors with proven audit trails; budget shortfalls amplify discount demands and margin compression for providers like CorVel (CorVel 2023 revenue ~$1.06B).
Ease of switching and integration
Integration of CorVel into claims systems and HRIS raises switching costs because data migration, retraining, and provider re‑certification slow churn; industry 2024 surveys found integration complexity cited by roughly 60% of buyers as a primary retention factor.
Open APIs reduce friction and empower buyer leverage by enabling quicker connectors, but performance dips or security incidents prompt competitive rebids and spike churn risk.
- High switching cost: data migration, retraining, re‑certification
- 2024 stat: ~60% cite integration complexity
- Open APIs = lower friction, higher buyer power
- Performance/security failures trigger rebids
Outcome-based pricing expectations
Buyers increasingly demand pay-for-performance and shared-savings models, shifting downside risk onto CorVel and strengthening buyer bargaining power; this trend has driven higher contract scrutiny and price pressure. CorVel’s defense rests on its analytics, validated benchmarks and outcomes track record, which justify premium pricing and limit churn. Transparent methodologies and audited results sustain trust and improve renewal rates.
- Trend: rising buyer demand for outcomes
- Risk: pricing pressure on CorVel
- Defense: analytics + validated benchmarks
- Retention: transparency drives renewals
Buyers drive pressure: insurers/KPIs, employers 90% self‑insured, gov 49% spend
Buyers hold strong leverage: national insurers drive RFPs and KPI-based contracts, compressing margins; large employers (90%+ self‑insured) demand ROI and customization; government payers (49% of US health spend in 2023) force price sensitivity. Integration complexity (60% cite 2024) raises switching costs but open APIs and pay‑for‑performance increase buyer power.
| Buyer | Leverage metric | Impact |
|---|---|---|
| National insurers | RFPs, KPIs | Higher price pressure |
| Fortune 1000 | 90%+ self‑insured | Demand ROI/customization |
| Government | 49% US spend (2023) | Procurement/discounts |
| Integration | 60% cite (2024) | Switching costs |
Preview the Actual Deliverable
CorVel Porter's Five Forces Analysis
This preview shows the CorVel Porter's Five Forces Analysis exactly as delivered—no placeholders or excerpts. The full, professionally formatted document you see here is the same file you’ll receive instantly after purchase. It’s ready for immediate download and use, fully complete and accurate.
Description
Go Beyond the Preview—Access the Full Strategic Report
CorVel operates in a specialized healthcare claims and risk management market where buyer power, supplier relationships, regulatory pressures, and tech-driven substitutes shape margins and growth. Our snapshot highlights key competitive tensions and strategic levers CorVel can exploit. This brief only scratches the surface. Unlock the full Porter's Five Forces Analysis to explore CorVel’s competitive dynamics in detail.
Suppliers Bargaining Power
Specialty clinical networks
CorVel relies on physician, therapy, imaging and pharmacy networks for cost-effective access, with specialized providers able to command premium rates or exclusivity that raise supplier bargaining power.
Multi-source contracting and broad national networks limit that leverage by enabling alternative routing and price pressure.
Rigorous credentialing and outcomes reporting increase switching options and impose performance pressure on specialty suppliers.
Data and software vendors
Claims data, eligibility feeds, and third-party analytics materially enrich CorVel’s platforms, creating dependence on data and software vendors whose proprietary datasets and unique APIs increase supplier pricing power and switching costs. Standard data formats, open APIs, and growing alternative vendors lessen lock-in and enable negotiation leverage. Long-term contracts with SLAs preserve continuity and shift some risk back to suppliers.
Cloud and infrastructure providers
Cloud hosting, AI compute and security services underpin CorVel’s scalability and compliance, with hyperscalers like AWS (≈32% 2024), Azure (≈23%) and Google Cloud (≈11%) holding pricing power but offering tiered discounts and Savings Plans up to ~72% off. Multi-cloud is used by ~81% of enterprises in 2024 and reserved instances mitigate cost risk. Vendor SOC 2, ISO 27001 and HIPAA certifications narrow viable supplier choices.
Clinical labor and UR professionals
Nurses, case managers and UR clinicians remained scarce in 2024, pushing supplier leverage higher as wage inflation lifted RN and clinician pay (roughly 10% cumulative growth 2021–24) and vacancy rates stayed in double digits. CorVel uses targeted training, workflow tools and hybrid staffing to blunt pressure and control costs. Automation and AI-driven triage cut reliance on peak human capacity and improve throughput.
- Labor scarcity: double-digit vacancy pressure in 2024
- Wage inflation: ~10% cumulative RN/clinician pay growth 2021–24
- CorVel offsets: training, workflow tools, hybrid staffing
- Automation: reduces peak human capacity needs
Regulatory and guideline bodies
- 2024 regulatory updates: implementation cost impact ~10-20%
- Limited supplier timeline control increases audit and workflow risk
- Mitigation: continuous monitoring and configurable rules engines
Moderate supplier power: hyperscalers dominate; RN pay +10%; regs add 10–20% cost
Supplier power is moderate: specialty providers and data vendors can demand premiums, but national networks and multi-source contracts limit leverage.
Hyperscalers (AWS 32%, Azure 23%, GCP 11% in 2024) and certified vendors hold pricing power for cloud and security.
Labor scarcity (double-digit vacancies) and ~10% RN pay growth 2021–24 increase wage pressure; automation and training mitigate.
2024 regulatory patches raised vendor implementation costs ~10–20%, boosting supplier influence on timelines.
| Metric | 2024 |
|---|---|
| AWS share | ≈32% |
| RN pay growth | ~10% |
| Regulatory cost impact | 10–20% |
What is included in the product
Detailed Word Document
Uncovers key drivers of competition, customer influence, and market entry risks tailored exclusively for CorVel, assessing supplier and buyer power, substitute threats, and industry rivalry. Detailed, actionable insights highlight disruptive forces, barriers protecting incumbents, and strategic levers to defend and grow CorVel’s market position.
Customizable Excel Spreadsheet
A concise CorVel Porter's Five Forces one-sheet that visualizes competitive pressure with a spider chart, lets you customize force levels for evolving claims, regulation or new entrants, and drops cleanly into decks or Excel dashboards—no macros, simple for non‑finance users.
Customers Bargaining Power
Large insurers and TPAs
Large national insurers and TPAs consolidate claims volume and negotiate aggressively with vendors, driving RFP-driven procurement that compresses provider margins; multi-year contracts for vendors like CorVel increasingly hinge on KPIs and outcomes guarantees tied to cost containment and clinical metrics. Strong referenceability and multi-line coverage across medical, disability, and managed care services bolster CorVel’s negotiating position and renewal prospects.
Self-insured employers
Fortune 1000 self-insured employers, with over 90% of large firms self-funding health costs, benchmark vendors on total cost of risk and measurable employee outcomes. Consolidated spend across national accounts gives them leverage to demand price concessions and deep customization. Vendors that show documented ROI and rapid implementations face lower price sensitivity. Real-time dashboards and transparency create operational stickiness.
Government and quasi-public plans
State funds and municipal programs are highly price-sensitive and process-heavy; government payers accounted for roughly 49% of US health spending in 2023 (CMS), pressuring rates and discounts. Strict compliance requirements raise switching barriers—multi-year procurements and auditability favor incumbents while capping pricing power. Long procurement cycles (often many quarters) reward vendors with proven audit trails; budget shortfalls amplify discount demands and margin compression for providers like CorVel (CorVel 2023 revenue ~$1.06B).
Ease of switching and integration
Integration of CorVel into claims systems and HRIS raises switching costs because data migration, retraining, and provider re‑certification slow churn; industry 2024 surveys found integration complexity cited by roughly 60% of buyers as a primary retention factor.
Open APIs reduce friction and empower buyer leverage by enabling quicker connectors, but performance dips or security incidents prompt competitive rebids and spike churn risk.
- High switching cost: data migration, retraining, re‑certification
- 2024 stat: ~60% cite integration complexity
- Open APIs = lower friction, higher buyer power
- Performance/security failures trigger rebids
Outcome-based pricing expectations
Buyers increasingly demand pay-for-performance and shared-savings models, shifting downside risk onto CorVel and strengthening buyer bargaining power; this trend has driven higher contract scrutiny and price pressure. CorVel’s defense rests on its analytics, validated benchmarks and outcomes track record, which justify premium pricing and limit churn. Transparent methodologies and audited results sustain trust and improve renewal rates.
- Trend: rising buyer demand for outcomes
- Risk: pricing pressure on CorVel
- Defense: analytics + validated benchmarks
- Retention: transparency drives renewals
Buyers drive pressure: insurers/KPIs, employers 90% self‑insured, gov 49% spend
Buyers hold strong leverage: national insurers drive RFPs and KPI-based contracts, compressing margins; large employers (90%+ self‑insured) demand ROI and customization; government payers (49% of US health spend in 2023) force price sensitivity. Integration complexity (60% cite 2024) raises switching costs but open APIs and pay‑for‑performance increase buyer power.
| Buyer | Leverage metric | Impact |
|---|---|---|
| National insurers | RFPs, KPIs | Higher price pressure |
| Fortune 1000 | 90%+ self‑insured | Demand ROI/customization |
| Government | 49% US spend (2023) | Procurement/discounts |
| Integration | 60% cite (2024) | Switching costs |
Preview the Actual Deliverable
CorVel Porter's Five Forces Analysis
This preview shows the CorVel Porter's Five Forces Analysis exactly as delivered—no placeholders or excerpts. The full, professionally formatted document you see here is the same file you’ll receive instantly after purchase. It’s ready for immediate download and use, fully complete and accurate.











