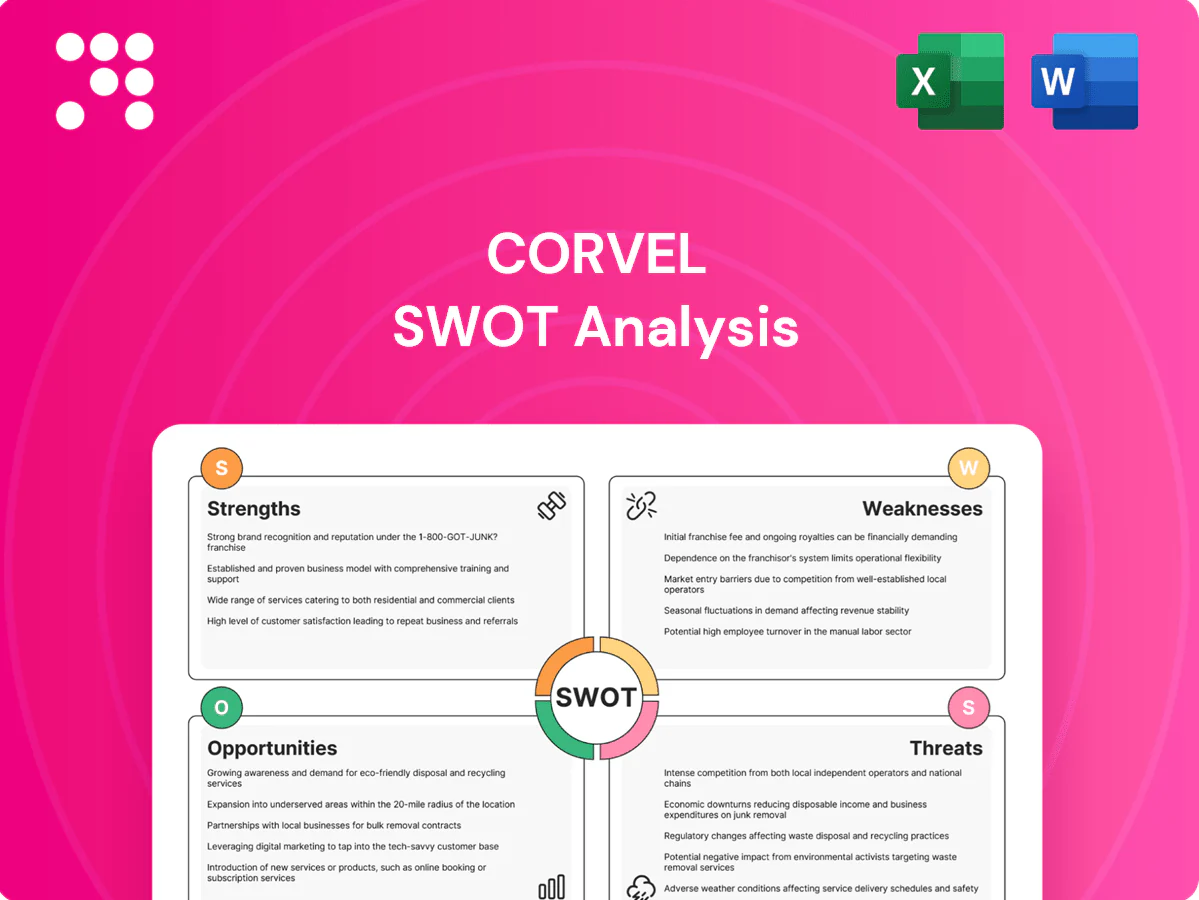
CorVel SWOT Analysis

Your Strategic Toolkit Starts Here
Explore CorVel's strategic strengths, market risks, and growth levers with this SWOT preview—then get the full analysis for actionable, research-backed insights. Purchase the complete report (editable Word + Excel) to support investment decisions, strategic planning, or competitive analysis.
Strengths

Integrated tech platform
CorVel’s integrated tech platform delivers end-to-end software and services that streamline claims, utilization review, and bill review, enabling clients to manage over 2 million claims annually with centralized workflows.
A unified stack reduces handoffs and error rates, with client implementations reporting up to 30% fewer manual interventions and measurable drops in adjudication errors.
Clients gain real-time visibility across workflows, supporting more consistent clinical and financial outcomes and lowering administrative costs—often by double-digit percentages in pilot studies.
Data-driven cost control
CorVel leverages advanced analytics to detect leakage, outliers, and fraud by integrating claims, clinical and payment data across its platform, improving detection rates and case prioritization. Benchmarking and predictive models focus resources on high-impact interventions, reducing avoidable spend and utilization variability. Actionable insights enable timely adjustments to care plans, driving measurable, repeatable savings through continuous monitoring and feedback loops.

Domain expertise in workers’ comp
Deep domain expertise since founding in 1987 gives CorVel credibility in a regulated niche; the company operates nationwide across all 50 states and manages millions of workers’ comp claims annually. Clinical and regulatory know-how accelerates approvals and reduces denials, while proven return-to-work playbooks improve outcomes and lower claim duration. This specialization raises switching costs and supports recurring revenue.

Diversified payer end-markets
CorVel's exposure across workers' comp, auto, health and disability spreads risk and supported FY2024 revenue of $1.03B, reducing dependency on any single payer and smoothing cyclical volatility. Multi-line capabilities enable cross-sell of claims, bill review and care management, increasing customer stickiness and lifetime value. Scale across 50 states improves procurement leverage and network rates, lowering unit costs and enhancing margins.
- Multi-line cross-sell
- Diversified revenue base
- FY2024 revenue: $1.03B
- Nationwide scale → better rates
Process automation and scalability
CorVel (NASDAQ: CRVL) leverages digitized workflows to cut manual touches and shorten cycle times in claims and care-management processes.
Automation enforces consistent quality across volumes, supporting scalable delivery in workers' compensation and risk-management services.
Variable-cost leverage from automation helps margins as case volumes rise, yielding faster client decisions and lower total claim spend.
- NASDAQ: CRVL
- Digitized workflows reduce manual touches
- Consistent quality at scale
- Variable-cost leverage improves margins
- Faster decisions, reduced client spend
Integrated claims platform: 2M+ claims, 30% fewer manual interventions, $1.03B revenue
CorVel’s integrated platform processes over 2M claims annually, cutting manual interventions by up to 30% and delivering double-digit administrative savings in pilots.
FY2024 revenue reached $1.03B; nationwide scale across 50 states enables procurement leverage and multi-line cross-sell (workers’ comp, auto, health, disability).
NASDAQ: CRVL; analytics-driven leakage detection and automation improve margins via variable-cost leverage.
| Metric | Value |
|---|---|
| FY2024 Revenue | $1.03B |
| Claims Managed | 2M+ |
| Geographic Reach | 50 states |
What is included in the product
 Detailed Word Document
Provides a concise SWOT overview of CorVel, outlining its operational strengths in claims automation and network services, internal weaknesses like scale constraints, external opportunities in digital health and managed care expansion, and threats from regulatory shifts and competitive pricing pressures.

 Customizable Excel Spreadsheet
Provides a concise CorVel SWOT matrix for fast, visual strategy alignment, helping stakeholders quickly identify strengths in claims management, mitigate weaknesses, and prioritize opportunities and threats across workers' compensation and risk solutions.
Weaknesses

Concentration in workers’ comp
Regulatory and volume swings in workers’ comp, which accounted for the majority of CorVel’s revenue in recent filings through 2024, can materially impact top-line performance. State-by-state variability increases operational complexity and compliance costs. Diversification into medical management and absence services reduces risk but core exposure remains meaningful, pressuring growth during soft claim cycles.
Brand versus larger incumbents
CorVel competes against national insurers, PBMs and TPAs whose bundled footprints and client relationships often shorten sales cycles versus CorVel’s more targeted reach. CorVel’s 2024 revenue of about $1.17 billion underscores scale but remains small compared with national incumbents, limiting marketing scale and procurement clout. That dynamic forces occasional pricing concessions to secure large accounts.

Integration with legacy client systems
Client IT heterogeneity complicates deployments, forcing CorVel to map dozens of legacy interfaces and bespoke EHR/workers compensation systems across accounts. Data quality and interoperability issues can delay value realization, increasing project timelines and obscuring ROI. Custom integrations raise implementation cost and resource needs, and longer timelines may slow bookings-to-revenue conversion.

Labor and provider cost sensitivity
Clinical staffing and provider networks drive CorVel’s cost of service and exposure to market wage pressure; BLS reports roughly 20 million healthcare workers in 2024, keeping labor tight. Wage inflation and tougher payer/provider rate negotiations can compress margins. Tight labor markets strain service levels, and scaling while maintaining quality adds operational complexity.
- Labor intensity: high dependency on clinical staff
- Wage pressure: national healthcare labor scarcity (2024)
- Scaling risk: quality control vs. margin compression
Limited international presence
CorVel remains primarily U.S.-centric, with the company deriving the majority of revenue from domestic workers' compensation and healthcare claims processing per public filings.
Its growth is closely tied to U.S. market dynamics and regulatory shifts, constraining diversification-driven upside.
Meaningful international entry would demand foreign compliance, distribution networks, and product localization.
- US-focused revenue concentration
- Regulatory-dependent growth
- Untapped global diversification
- High entry costs: compliance, networks, localization
Workers' comp focus $1.17B and staffing strain threaten margins
CorVel's 2024 revenue concentration in workers' comp (about $1.17B) makes topline sensitive to state regulatory and volume swings. Scale lags national insurers and PBMs, limiting pricing leverage and client wins. Client IT heterogeneity and custom integrations extend implementation timelines and raise costs. Clinical staffing pressure amid ~20M US healthcare workers (BLS 2024) risks margin compression.
| Metric | 2024 / Source |
|---|---|
| Revenue | $1.17B (2024 filings) |
| US healthcare workforce | ~20M (BLS 2024) |
| Geographic concentration | Primarily US (company filings) |
Full Version Awaits
CorVel SWOT Analysis
This CorVel SWOT Analysis preview is the actual document you’ll receive upon purchase — no placeholders or samples, just the finished, professional file. The excerpt below is taken directly from the full, editable report and reflects the same structure, data and insights included in the download. Buy now to unlock the complete, detailed version ready for use in presentations or analysis.

Your Strategic Toolkit Starts Here
Explore CorVel's strategic strengths, market risks, and growth levers with this SWOT preview—then get the full analysis for actionable, research-backed insights. Purchase the complete report (editable Word + Excel) to support investment decisions, strategic planning, or competitive analysis.
Strengths
Integrated tech platform
CorVel’s integrated tech platform delivers end-to-end software and services that streamline claims, utilization review, and bill review, enabling clients to manage over 2 million claims annually with centralized workflows.
A unified stack reduces handoffs and error rates, with client implementations reporting up to 30% fewer manual interventions and measurable drops in adjudication errors.
Clients gain real-time visibility across workflows, supporting more consistent clinical and financial outcomes and lowering administrative costs—often by double-digit percentages in pilot studies.
Data-driven cost control
CorVel leverages advanced analytics to detect leakage, outliers, and fraud by integrating claims, clinical and payment data across its platform, improving detection rates and case prioritization. Benchmarking and predictive models focus resources on high-impact interventions, reducing avoidable spend and utilization variability. Actionable insights enable timely adjustments to care plans, driving measurable, repeatable savings through continuous monitoring and feedback loops.
Domain expertise in workers’ comp
Deep domain expertise since founding in 1987 gives CorVel credibility in a regulated niche; the company operates nationwide across all 50 states and manages millions of workers’ comp claims annually. Clinical and regulatory know-how accelerates approvals and reduces denials, while proven return-to-work playbooks improve outcomes and lower claim duration. This specialization raises switching costs and supports recurring revenue.
Diversified payer end-markets
CorVel's exposure across workers' comp, auto, health and disability spreads risk and supported FY2024 revenue of $1.03B, reducing dependency on any single payer and smoothing cyclical volatility. Multi-line capabilities enable cross-sell of claims, bill review and care management, increasing customer stickiness and lifetime value. Scale across 50 states improves procurement leverage and network rates, lowering unit costs and enhancing margins.
- Multi-line cross-sell
- Diversified revenue base
- FY2024 revenue: $1.03B
- Nationwide scale → better rates
Process automation and scalability
CorVel (NASDAQ: CRVL) leverages digitized workflows to cut manual touches and shorten cycle times in claims and care-management processes.
Automation enforces consistent quality across volumes, supporting scalable delivery in workers' compensation and risk-management services.
Variable-cost leverage from automation helps margins as case volumes rise, yielding faster client decisions and lower total claim spend.
- NASDAQ: CRVL
- Digitized workflows reduce manual touches
- Consistent quality at scale
- Variable-cost leverage improves margins
- Faster decisions, reduced client spend
Integrated claims platform: 2M+ claims, 30% fewer manual interventions, $1.03B revenue
CorVel’s integrated platform processes over 2M claims annually, cutting manual interventions by up to 30% and delivering double-digit administrative savings in pilots.
FY2024 revenue reached $1.03B; nationwide scale across 50 states enables procurement leverage and multi-line cross-sell (workers’ comp, auto, health, disability).
NASDAQ: CRVL; analytics-driven leakage detection and automation improve margins via variable-cost leverage.
| Metric | Value |
|---|---|
| FY2024 Revenue | $1.03B |
| Claims Managed | 2M+ |
| Geographic Reach | 50 states |
What is included in the product
Detailed Word Document
Provides a concise SWOT overview of CorVel, outlining its operational strengths in claims automation and network services, internal weaknesses like scale constraints, external opportunities in digital health and managed care expansion, and threats from regulatory shifts and competitive pricing pressures.
Customizable Excel Spreadsheet
Provides a concise CorVel SWOT matrix for fast, visual strategy alignment, helping stakeholders quickly identify strengths in claims management, mitigate weaknesses, and prioritize opportunities and threats across workers' compensation and risk solutions.
Weaknesses
Concentration in workers’ comp
Regulatory and volume swings in workers’ comp, which accounted for the majority of CorVel’s revenue in recent filings through 2024, can materially impact top-line performance. State-by-state variability increases operational complexity and compliance costs. Diversification into medical management and absence services reduces risk but core exposure remains meaningful, pressuring growth during soft claim cycles.
Brand versus larger incumbents
CorVel competes against national insurers, PBMs and TPAs whose bundled footprints and client relationships often shorten sales cycles versus CorVel’s more targeted reach. CorVel’s 2024 revenue of about $1.17 billion underscores scale but remains small compared with national incumbents, limiting marketing scale and procurement clout. That dynamic forces occasional pricing concessions to secure large accounts.
Integration with legacy client systems
Client IT heterogeneity complicates deployments, forcing CorVel to map dozens of legacy interfaces and bespoke EHR/workers compensation systems across accounts. Data quality and interoperability issues can delay value realization, increasing project timelines and obscuring ROI. Custom integrations raise implementation cost and resource needs, and longer timelines may slow bookings-to-revenue conversion.
Labor and provider cost sensitivity
Clinical staffing and provider networks drive CorVel’s cost of service and exposure to market wage pressure; BLS reports roughly 20 million healthcare workers in 2024, keeping labor tight. Wage inflation and tougher payer/provider rate negotiations can compress margins. Tight labor markets strain service levels, and scaling while maintaining quality adds operational complexity.
- Labor intensity: high dependency on clinical staff
- Wage pressure: national healthcare labor scarcity (2024)
- Scaling risk: quality control vs. margin compression
Limited international presence
CorVel remains primarily U.S.-centric, with the company deriving the majority of revenue from domestic workers' compensation and healthcare claims processing per public filings.
Its growth is closely tied to U.S. market dynamics and regulatory shifts, constraining diversification-driven upside.
Meaningful international entry would demand foreign compliance, distribution networks, and product localization.
- US-focused revenue concentration
- Regulatory-dependent growth
- Untapped global diversification
- High entry costs: compliance, networks, localization
Workers' comp focus $1.17B and staffing strain threaten margins
CorVel's 2024 revenue concentration in workers' comp (about $1.17B) makes topline sensitive to state regulatory and volume swings. Scale lags national insurers and PBMs, limiting pricing leverage and client wins. Client IT heterogeneity and custom integrations extend implementation timelines and raise costs. Clinical staffing pressure amid ~20M US healthcare workers (BLS 2024) risks margin compression.
| Metric | 2024 / Source |
|---|---|
| Revenue | $1.17B (2024 filings) |
| US healthcare workforce | ~20M (BLS 2024) |
| Geographic concentration | Primarily US (company filings) |
Full Version Awaits
CorVel SWOT Analysis
This CorVel SWOT Analysis preview is the actual document you’ll receive upon purchase — no placeholders or samples, just the finished, professional file. The excerpt below is taken directly from the full, editable report and reflects the same structure, data and insights included in the download. Buy now to unlock the complete, detailed version ready for use in presentations or analysis.
Original: $10.00
-65%$10.00
$3.50Description
Your Strategic Toolkit Starts Here
Explore CorVel's strategic strengths, market risks, and growth levers with this SWOT preview—then get the full analysis for actionable, research-backed insights. Purchase the complete report (editable Word + Excel) to support investment decisions, strategic planning, or competitive analysis.
Strengths
Integrated tech platform
CorVel’s integrated tech platform delivers end-to-end software and services that streamline claims, utilization review, and bill review, enabling clients to manage over 2 million claims annually with centralized workflows.
A unified stack reduces handoffs and error rates, with client implementations reporting up to 30% fewer manual interventions and measurable drops in adjudication errors.
Clients gain real-time visibility across workflows, supporting more consistent clinical and financial outcomes and lowering administrative costs—often by double-digit percentages in pilot studies.
Data-driven cost control
CorVel leverages advanced analytics to detect leakage, outliers, and fraud by integrating claims, clinical and payment data across its platform, improving detection rates and case prioritization. Benchmarking and predictive models focus resources on high-impact interventions, reducing avoidable spend and utilization variability. Actionable insights enable timely adjustments to care plans, driving measurable, repeatable savings through continuous monitoring and feedback loops.
Domain expertise in workers’ comp
Deep domain expertise since founding in 1987 gives CorVel credibility in a regulated niche; the company operates nationwide across all 50 states and manages millions of workers’ comp claims annually. Clinical and regulatory know-how accelerates approvals and reduces denials, while proven return-to-work playbooks improve outcomes and lower claim duration. This specialization raises switching costs and supports recurring revenue.
Diversified payer end-markets
CorVel's exposure across workers' comp, auto, health and disability spreads risk and supported FY2024 revenue of $1.03B, reducing dependency on any single payer and smoothing cyclical volatility. Multi-line capabilities enable cross-sell of claims, bill review and care management, increasing customer stickiness and lifetime value. Scale across 50 states improves procurement leverage and network rates, lowering unit costs and enhancing margins.
- Multi-line cross-sell
- Diversified revenue base
- FY2024 revenue: $1.03B
- Nationwide scale → better rates
Process automation and scalability
CorVel (NASDAQ: CRVL) leverages digitized workflows to cut manual touches and shorten cycle times in claims and care-management processes.
Automation enforces consistent quality across volumes, supporting scalable delivery in workers' compensation and risk-management services.
Variable-cost leverage from automation helps margins as case volumes rise, yielding faster client decisions and lower total claim spend.
- NASDAQ: CRVL
- Digitized workflows reduce manual touches
- Consistent quality at scale
- Variable-cost leverage improves margins
- Faster decisions, reduced client spend
Integrated claims platform: 2M+ claims, 30% fewer manual interventions, $1.03B revenue
CorVel’s integrated platform processes over 2M claims annually, cutting manual interventions by up to 30% and delivering double-digit administrative savings in pilots.
FY2024 revenue reached $1.03B; nationwide scale across 50 states enables procurement leverage and multi-line cross-sell (workers’ comp, auto, health, disability).
NASDAQ: CRVL; analytics-driven leakage detection and automation improve margins via variable-cost leverage.
| Metric | Value |
|---|---|
| FY2024 Revenue | $1.03B |
| Claims Managed | 2M+ |
| Geographic Reach | 50 states |
What is included in the product
Detailed Word Document
Provides a concise SWOT overview of CorVel, outlining its operational strengths in claims automation and network services, internal weaknesses like scale constraints, external opportunities in digital health and managed care expansion, and threats from regulatory shifts and competitive pricing pressures.
Customizable Excel Spreadsheet
Provides a concise CorVel SWOT matrix for fast, visual strategy alignment, helping stakeholders quickly identify strengths in claims management, mitigate weaknesses, and prioritize opportunities and threats across workers' compensation and risk solutions.
Weaknesses
Concentration in workers’ comp
Regulatory and volume swings in workers’ comp, which accounted for the majority of CorVel’s revenue in recent filings through 2024, can materially impact top-line performance. State-by-state variability increases operational complexity and compliance costs. Diversification into medical management and absence services reduces risk but core exposure remains meaningful, pressuring growth during soft claim cycles.
Brand versus larger incumbents
CorVel competes against national insurers, PBMs and TPAs whose bundled footprints and client relationships often shorten sales cycles versus CorVel’s more targeted reach. CorVel’s 2024 revenue of about $1.17 billion underscores scale but remains small compared with national incumbents, limiting marketing scale and procurement clout. That dynamic forces occasional pricing concessions to secure large accounts.
Integration with legacy client systems
Client IT heterogeneity complicates deployments, forcing CorVel to map dozens of legacy interfaces and bespoke EHR/workers compensation systems across accounts. Data quality and interoperability issues can delay value realization, increasing project timelines and obscuring ROI. Custom integrations raise implementation cost and resource needs, and longer timelines may slow bookings-to-revenue conversion.
Labor and provider cost sensitivity
Clinical staffing and provider networks drive CorVel’s cost of service and exposure to market wage pressure; BLS reports roughly 20 million healthcare workers in 2024, keeping labor tight. Wage inflation and tougher payer/provider rate negotiations can compress margins. Tight labor markets strain service levels, and scaling while maintaining quality adds operational complexity.
- Labor intensity: high dependency on clinical staff
- Wage pressure: national healthcare labor scarcity (2024)
- Scaling risk: quality control vs. margin compression
Limited international presence
CorVel remains primarily U.S.-centric, with the company deriving the majority of revenue from domestic workers' compensation and healthcare claims processing per public filings.
Its growth is closely tied to U.S. market dynamics and regulatory shifts, constraining diversification-driven upside.
Meaningful international entry would demand foreign compliance, distribution networks, and product localization.
- US-focused revenue concentration
- Regulatory-dependent growth
- Untapped global diversification
- High entry costs: compliance, networks, localization
Workers' comp focus $1.17B and staffing strain threaten margins
CorVel's 2024 revenue concentration in workers' comp (about $1.17B) makes topline sensitive to state regulatory and volume swings. Scale lags national insurers and PBMs, limiting pricing leverage and client wins. Client IT heterogeneity and custom integrations extend implementation timelines and raise costs. Clinical staffing pressure amid ~20M US healthcare workers (BLS 2024) risks margin compression.
| Metric | 2024 / Source |
|---|---|
| Revenue | $1.17B (2024 filings) |
| US healthcare workforce | ~20M (BLS 2024) |
| Geographic concentration | Primarily US (company filings) |
Full Version Awaits
CorVel SWOT Analysis
This CorVel SWOT Analysis preview is the actual document you’ll receive upon purchase — no placeholders or samples, just the finished, professional file. The excerpt below is taken directly from the full, editable report and reflects the same structure, data and insights included in the download. Buy now to unlock the complete, detailed version ready for use in presentations or analysis.











