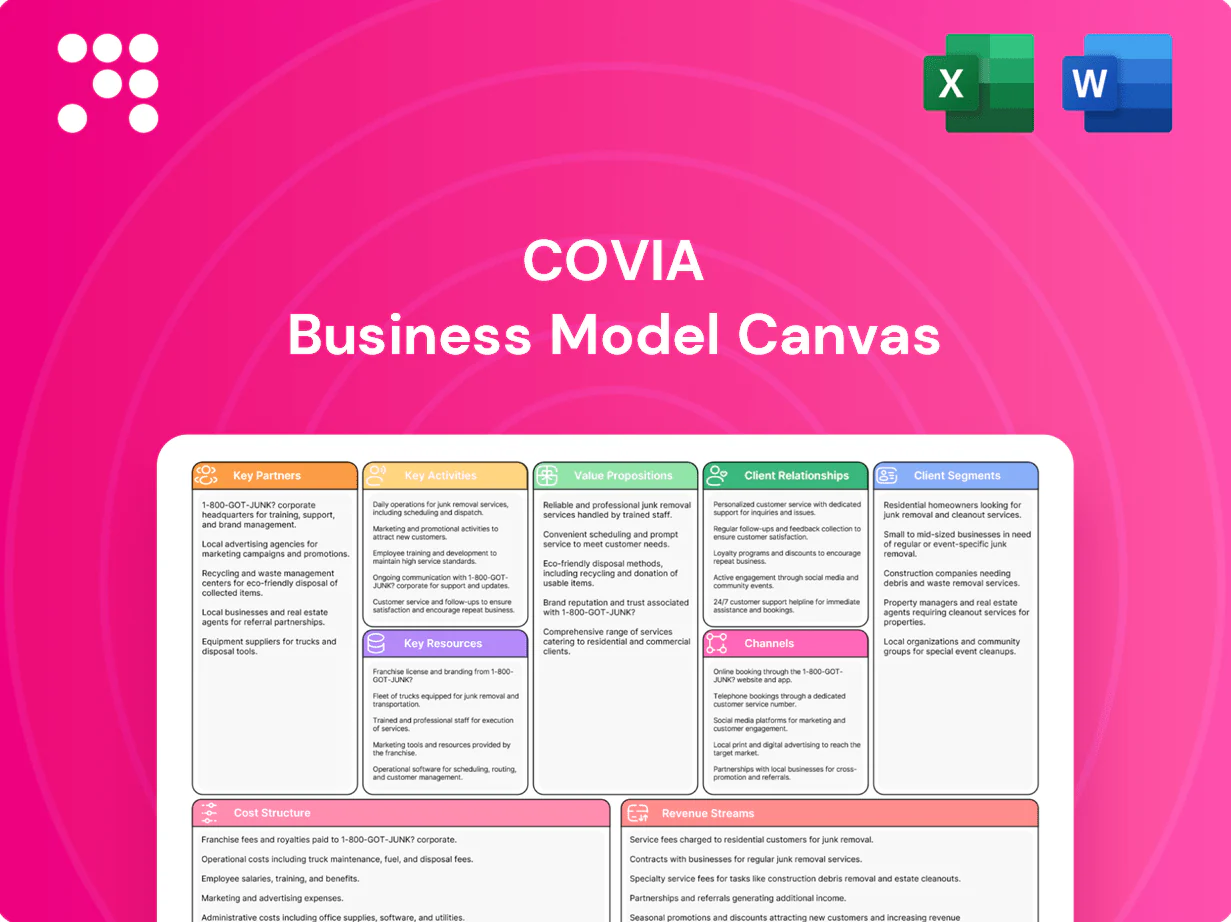
Covia Business Model Canvas

Unlock a strategic Business Model Canvas revealing growth levers and risks for investors
Unlock Covia’s strategic blueprint with a concise Business Model Canvas that maps value propositions, customer segments, partnerships, and revenue streams. This clear, actionable snapshot reveals growth levers and risks—ideal for investors, consultants, and founders. Purchase the full Word/Excel canvas to get section-by-section insights and ready-to-use analysis.
Partnerships

Sibelco corporate and shared services
Covia leverages parent SCR-Sibelco NV — a minerals group active in over 30 countries — for capital access, board governance, and global procurement leverage, consolidating supplier contracts and logistics. Shared services standardize HSE, ESG, and compliance frameworks across sites, supported by centralized audits and reporting. Corporate R&D and cross-site best practices accelerate product innovation and productivity, while integration reduces duplicate overhead and improves scale economics.
Rail, trucking, and port logistics providers
Reliable bulk freight partners are critical to move sand and minerals cost-effectively; U.S. Class I railroads move roughly 1.8 billion tons annually, about 40% of U.S. freight by ton-miles (AAR). Strategic railcar leases, transload terminals, and port access extend reach to inland and export markets and lower capital intensity. Coordinated scheduling cuts demurrage exposure and boosts on-time delivery, while partnerships enable vendor-managed inventory and last-mile flexibility.

Equipment OEMs and maintenance contractors
Equipment OEMs supply crushers, dryers, screens and process controls critical for uptime; service agreements and predictive-maintenance partners cut unplanned outages (industry estimates 30–50% reduction). Upgrades and retrofits boost yields and energy efficiency (typical gains 5–15%), while joint trials with OEMs speed deployment of automation and dust-mitigation technologies across Covia sites.

Energy and industrial customer alliances
Framework agreements with E&P operators and pressure pumpers provide multi-year (3–5 year) demand visibility and often include take-or-pay clauses covering 60–80% of contracted volumes, stabilizing cash flows; co-development with glass, foundry and ceramics producers tailors product specs to reduce qualification time and improve yield; technical alliances deliver performance validation and third-party qualification data.
- 3–5 year frameworks
- 60–80% take-or-pay coverage
- Co-development for application-specific specs
- Third-party performance validation
Environmental, regulatory, and community stakeholders
Partnerships with regulators secure permits and ongoing compliance, aligning operations with 2024 permitting frameworks and reporting requirements; reclamation contractors and NGOs advance land restoration and biodiversity targets through project-specific restoration plans; community engagement builds local license-to-operate and workforce pipelines; monitoring vendors supply continuous air, water, and noise data assurance for compliance and risk management.
- Regulators: permits & reporting
- Reclamation/NGOs: restoration & biodiversity
- Community: local hire & social license
- Vendors: continuous environmental monitoring
Parent capital & logistics; OEM downtime 30–50%; 60–80%
Covia relies on SCR‑Sibelco for capital, procurement and governance; rail/ports move bulk (U.S. rail = ~1.8bn tons, 40% ton‑miles, AAR 2024); OEM service agreements cut unplanned downtime ~30–50%; 3–5yr offtake frameworks often secure 60–80% take‑or‑pay volumes, stabilizing cash flow.
| Partner | 2024 Metric | Impact |
|---|---|---|
| Parent | 30+ countries | Capital & scale |
| Rail/ports | 1.8bn t/yr | Logistics cost |
| OEMs | 30–50% downtime↓ | Uptime |
| Offtakers | 60–80% take‑pay | Revenue visibility |
What is included in the product
 Detailed Word Document
Comprehensive Business Model Canvas for Covia detailing customer segments, channels, value propositions, revenue streams and key resources across the 9 BMC blocks, with integrated SWOT and competitive-advantage analysis; ideal for presentations, funding discussions and strategic decision-making by entrepreneurs, analysts and investors.

 Customizable Excel Spreadsheet
High-level view of Covia’s business model with editable cells to quickly identify value drivers and cost pain points. Great for brainstorming, team alignment, and speeding strategic decisions with a clean, shareable one-page snapshot.
Activities

Geology, exploration, and reserve management
Mapping, coring, and metallurgical testing validate deposit quality and underpin life-of-mine plans. Reserve modeling using Lerchs-Grossmann pit optimization guides capital allocation and sequencing of pits. Continuous grade control sampling maintains product consistency and production targets. Compliance reporting per NI 43-101 and JORC ensures transparency for stakeholders.
Mining, processing, and blending operations
Extraction, crushing, screening, drying and classification produce specification products with typical processing recoveries exceeding 90% and particle-size distributions tightly controlled to micron-scale tolerances. Blending locks in tight particle-size and purity targets, often reducing variability below 5%. Continuous process optimization in 2024 improved yields while lowering energy intensity. Rigorous safety and quality procedures govern daily operations.

Supply chain and logistics orchestration
Rail and truck dispatching synchronizes plant output with customer schedules, coordinating more than 100 weekly dispatches in 2024 to meet just-in-time demand. Inventory is actively balanced across mines, plants and transload sites to maintain target fill rates and reduce stockouts. Freight procurement and optimized routing cut total landed cost per ton while digital tracking delivers end-to-end visibility and 24/7 service reliability.

Product development and technical services
R&D formulates performance sands and specialty mineral blends, iterating formulations to meet regulatory and customer specs; lab testing and customer trials validate application performance through controlled pilots and field trials. Technical teams provide on-site support and failure analysis to reduce downtime and optimize formulations. Continuous improvement programs deliver incremental value and differentiation across product lines.
- R&D: formulation and regulatory compliance
- Validation: lab tests and customer pilots
- Support: on-site troubleshooting and failure analysis
- CI: incremental product and process gains
ESG compliance and site reclamation
Dust control, water stewardship and emissions management are core routines with continuous monitoring and mitigation to meet air and water standards. Safety training and regular audits drive incident prevention and workforce readiness. Progressive reclamation restores disturbed land and reduces closure liabilities. Reporting aligns with EU CSRD (2024) and investor ESG expectations.
- Dust control: monitoring & suppression
- Water stewardship: reuse and discharge limits
- Emissions management: continuous measurement
- Safety audits: proactive incident prevention
Supply chain & processing: >90% recovery, <5% variability, >100/wk
Mapping, coring and metallurgical testing underpin reserve models; grade control sustains product consistency. Processing achieves recoveries >90% with particle variability <5%; 2024 CI efforts raised yields and cut energy intensity. Logistics coordinated >100 weekly dispatches in 2024 to meet JIT demand. R&D, technical support and ESG programs (EU CSRD 2024) drive product differentiation and compliance.
| Metric | 2024 |
|---|---|
| Processing recovery | >90% |
| Particle variability | <5% |
| Dispatches/week | >100 |
What You See Is What You Get
Business Model Canvas
The Covia Business Model Canvas preview shown here is the exact document you will receive after purchase, not a mockup or sample. Completing your order grants immediate access to the full, editable file formatted for practical use and presentation. No hidden content or placeholders—what you see is the deliverable, ready to edit, share, and implement.

Unlock a strategic Business Model Canvas revealing growth levers and risks for investors
Unlock Covia’s strategic blueprint with a concise Business Model Canvas that maps value propositions, customer segments, partnerships, and revenue streams. This clear, actionable snapshot reveals growth levers and risks—ideal for investors, consultants, and founders. Purchase the full Word/Excel canvas to get section-by-section insights and ready-to-use analysis.
Partnerships
Sibelco corporate and shared services
Covia leverages parent SCR-Sibelco NV — a minerals group active in over 30 countries — for capital access, board governance, and global procurement leverage, consolidating supplier contracts and logistics. Shared services standardize HSE, ESG, and compliance frameworks across sites, supported by centralized audits and reporting. Corporate R&D and cross-site best practices accelerate product innovation and productivity, while integration reduces duplicate overhead and improves scale economics.
Rail, trucking, and port logistics providers
Reliable bulk freight partners are critical to move sand and minerals cost-effectively; U.S. Class I railroads move roughly 1.8 billion tons annually, about 40% of U.S. freight by ton-miles (AAR). Strategic railcar leases, transload terminals, and port access extend reach to inland and export markets and lower capital intensity. Coordinated scheduling cuts demurrage exposure and boosts on-time delivery, while partnerships enable vendor-managed inventory and last-mile flexibility.
Equipment OEMs and maintenance contractors
Equipment OEMs supply crushers, dryers, screens and process controls critical for uptime; service agreements and predictive-maintenance partners cut unplanned outages (industry estimates 30–50% reduction). Upgrades and retrofits boost yields and energy efficiency (typical gains 5–15%), while joint trials with OEMs speed deployment of automation and dust-mitigation technologies across Covia sites.
Energy and industrial customer alliances
Framework agreements with E&P operators and pressure pumpers provide multi-year (3–5 year) demand visibility and often include take-or-pay clauses covering 60–80% of contracted volumes, stabilizing cash flows; co-development with glass, foundry and ceramics producers tailors product specs to reduce qualification time and improve yield; technical alliances deliver performance validation and third-party qualification data.
- 3–5 year frameworks
- 60–80% take-or-pay coverage
- Co-development for application-specific specs
- Third-party performance validation
Environmental, regulatory, and community stakeholders
Partnerships with regulators secure permits and ongoing compliance, aligning operations with 2024 permitting frameworks and reporting requirements; reclamation contractors and NGOs advance land restoration and biodiversity targets through project-specific restoration plans; community engagement builds local license-to-operate and workforce pipelines; monitoring vendors supply continuous air, water, and noise data assurance for compliance and risk management.
- Regulators: permits & reporting
- Reclamation/NGOs: restoration & biodiversity
- Community: local hire & social license
- Vendors: continuous environmental monitoring
Parent capital & logistics; OEM downtime 30–50%; 60–80%
Covia relies on SCR‑Sibelco for capital, procurement and governance; rail/ports move bulk (U.S. rail = ~1.8bn tons, 40% ton‑miles, AAR 2024); OEM service agreements cut unplanned downtime ~30–50%; 3–5yr offtake frameworks often secure 60–80% take‑or‑pay volumes, stabilizing cash flow.
| Partner | 2024 Metric | Impact |
|---|---|---|
| Parent | 30+ countries | Capital & scale |
| Rail/ports | 1.8bn t/yr | Logistics cost |
| OEMs | 30–50% downtime↓ | Uptime |
| Offtakers | 60–80% take‑pay | Revenue visibility |
What is included in the product
Detailed Word Document
Comprehensive Business Model Canvas for Covia detailing customer segments, channels, value propositions, revenue streams and key resources across the 9 BMC blocks, with integrated SWOT and competitive-advantage analysis; ideal for presentations, funding discussions and strategic decision-making by entrepreneurs, analysts and investors.
Customizable Excel Spreadsheet
High-level view of Covia’s business model with editable cells to quickly identify value drivers and cost pain points. Great for brainstorming, team alignment, and speeding strategic decisions with a clean, shareable one-page snapshot.
Activities
Geology, exploration, and reserve management
Mapping, coring, and metallurgical testing validate deposit quality and underpin life-of-mine plans. Reserve modeling using Lerchs-Grossmann pit optimization guides capital allocation and sequencing of pits. Continuous grade control sampling maintains product consistency and production targets. Compliance reporting per NI 43-101 and JORC ensures transparency for stakeholders.
Mining, processing, and blending operations
Extraction, crushing, screening, drying and classification produce specification products with typical processing recoveries exceeding 90% and particle-size distributions tightly controlled to micron-scale tolerances. Blending locks in tight particle-size and purity targets, often reducing variability below 5%. Continuous process optimization in 2024 improved yields while lowering energy intensity. Rigorous safety and quality procedures govern daily operations.
Supply chain and logistics orchestration
Rail and truck dispatching synchronizes plant output with customer schedules, coordinating more than 100 weekly dispatches in 2024 to meet just-in-time demand. Inventory is actively balanced across mines, plants and transload sites to maintain target fill rates and reduce stockouts. Freight procurement and optimized routing cut total landed cost per ton while digital tracking delivers end-to-end visibility and 24/7 service reliability.
Product development and technical services
R&D formulates performance sands and specialty mineral blends, iterating formulations to meet regulatory and customer specs; lab testing and customer trials validate application performance through controlled pilots and field trials. Technical teams provide on-site support and failure analysis to reduce downtime and optimize formulations. Continuous improvement programs deliver incremental value and differentiation across product lines.
- R&D: formulation and regulatory compliance
- Validation: lab tests and customer pilots
- Support: on-site troubleshooting and failure analysis
- CI: incremental product and process gains
ESG compliance and site reclamation
Dust control, water stewardship and emissions management are core routines with continuous monitoring and mitigation to meet air and water standards. Safety training and regular audits drive incident prevention and workforce readiness. Progressive reclamation restores disturbed land and reduces closure liabilities. Reporting aligns with EU CSRD (2024) and investor ESG expectations.
- Dust control: monitoring & suppression
- Water stewardship: reuse and discharge limits
- Emissions management: continuous measurement
- Safety audits: proactive incident prevention
Supply chain & processing: >90% recovery, <5% variability, >100/wk
Mapping, coring and metallurgical testing underpin reserve models; grade control sustains product consistency. Processing achieves recoveries >90% with particle variability <5%; 2024 CI efforts raised yields and cut energy intensity. Logistics coordinated >100 weekly dispatches in 2024 to meet JIT demand. R&D, technical support and ESG programs (EU CSRD 2024) drive product differentiation and compliance.
| Metric | 2024 |
|---|---|
| Processing recovery | >90% |
| Particle variability | <5% |
| Dispatches/week | >100 |
What You See Is What You Get
Business Model Canvas
The Covia Business Model Canvas preview shown here is the exact document you will receive after purchase, not a mockup or sample. Completing your order grants immediate access to the full, editable file formatted for practical use and presentation. No hidden content or placeholders—what you see is the deliverable, ready to edit, share, and implement.
Description
Unlock a strategic Business Model Canvas revealing growth levers and risks for investors
Unlock Covia’s strategic blueprint with a concise Business Model Canvas that maps value propositions, customer segments, partnerships, and revenue streams. This clear, actionable snapshot reveals growth levers and risks—ideal for investors, consultants, and founders. Purchase the full Word/Excel canvas to get section-by-section insights and ready-to-use analysis.
Partnerships
Sibelco corporate and shared services
Covia leverages parent SCR-Sibelco NV — a minerals group active in over 30 countries — for capital access, board governance, and global procurement leverage, consolidating supplier contracts and logistics. Shared services standardize HSE, ESG, and compliance frameworks across sites, supported by centralized audits and reporting. Corporate R&D and cross-site best practices accelerate product innovation and productivity, while integration reduces duplicate overhead and improves scale economics.
Rail, trucking, and port logistics providers
Reliable bulk freight partners are critical to move sand and minerals cost-effectively; U.S. Class I railroads move roughly 1.8 billion tons annually, about 40% of U.S. freight by ton-miles (AAR). Strategic railcar leases, transload terminals, and port access extend reach to inland and export markets and lower capital intensity. Coordinated scheduling cuts demurrage exposure and boosts on-time delivery, while partnerships enable vendor-managed inventory and last-mile flexibility.
Equipment OEMs and maintenance contractors
Equipment OEMs supply crushers, dryers, screens and process controls critical for uptime; service agreements and predictive-maintenance partners cut unplanned outages (industry estimates 30–50% reduction). Upgrades and retrofits boost yields and energy efficiency (typical gains 5–15%), while joint trials with OEMs speed deployment of automation and dust-mitigation technologies across Covia sites.
Energy and industrial customer alliances
Framework agreements with E&P operators and pressure pumpers provide multi-year (3–5 year) demand visibility and often include take-or-pay clauses covering 60–80% of contracted volumes, stabilizing cash flows; co-development with glass, foundry and ceramics producers tailors product specs to reduce qualification time and improve yield; technical alliances deliver performance validation and third-party qualification data.
- 3–5 year frameworks
- 60–80% take-or-pay coverage
- Co-development for application-specific specs
- Third-party performance validation
Environmental, regulatory, and community stakeholders
Partnerships with regulators secure permits and ongoing compliance, aligning operations with 2024 permitting frameworks and reporting requirements; reclamation contractors and NGOs advance land restoration and biodiversity targets through project-specific restoration plans; community engagement builds local license-to-operate and workforce pipelines; monitoring vendors supply continuous air, water, and noise data assurance for compliance and risk management.
- Regulators: permits & reporting
- Reclamation/NGOs: restoration & biodiversity
- Community: local hire & social license
- Vendors: continuous environmental monitoring
Parent capital & logistics; OEM downtime 30–50%; 60–80%
Covia relies on SCR‑Sibelco for capital, procurement and governance; rail/ports move bulk (U.S. rail = ~1.8bn tons, 40% ton‑miles, AAR 2024); OEM service agreements cut unplanned downtime ~30–50%; 3–5yr offtake frameworks often secure 60–80% take‑or‑pay volumes, stabilizing cash flow.
| Partner | 2024 Metric | Impact |
|---|---|---|
| Parent | 30+ countries | Capital & scale |
| Rail/ports | 1.8bn t/yr | Logistics cost |
| OEMs | 30–50% downtime↓ | Uptime |
| Offtakers | 60–80% take‑pay | Revenue visibility |
What is included in the product
Detailed Word Document
Comprehensive Business Model Canvas for Covia detailing customer segments, channels, value propositions, revenue streams and key resources across the 9 BMC blocks, with integrated SWOT and competitive-advantage analysis; ideal for presentations, funding discussions and strategic decision-making by entrepreneurs, analysts and investors.
Customizable Excel Spreadsheet
High-level view of Covia’s business model with editable cells to quickly identify value drivers and cost pain points. Great for brainstorming, team alignment, and speeding strategic decisions with a clean, shareable one-page snapshot.
Activities
Geology, exploration, and reserve management
Mapping, coring, and metallurgical testing validate deposit quality and underpin life-of-mine plans. Reserve modeling using Lerchs-Grossmann pit optimization guides capital allocation and sequencing of pits. Continuous grade control sampling maintains product consistency and production targets. Compliance reporting per NI 43-101 and JORC ensures transparency for stakeholders.
Mining, processing, and blending operations
Extraction, crushing, screening, drying and classification produce specification products with typical processing recoveries exceeding 90% and particle-size distributions tightly controlled to micron-scale tolerances. Blending locks in tight particle-size and purity targets, often reducing variability below 5%. Continuous process optimization in 2024 improved yields while lowering energy intensity. Rigorous safety and quality procedures govern daily operations.
Supply chain and logistics orchestration
Rail and truck dispatching synchronizes plant output with customer schedules, coordinating more than 100 weekly dispatches in 2024 to meet just-in-time demand. Inventory is actively balanced across mines, plants and transload sites to maintain target fill rates and reduce stockouts. Freight procurement and optimized routing cut total landed cost per ton while digital tracking delivers end-to-end visibility and 24/7 service reliability.
Product development and technical services
R&D formulates performance sands and specialty mineral blends, iterating formulations to meet regulatory and customer specs; lab testing and customer trials validate application performance through controlled pilots and field trials. Technical teams provide on-site support and failure analysis to reduce downtime and optimize formulations. Continuous improvement programs deliver incremental value and differentiation across product lines.
- R&D: formulation and regulatory compliance
- Validation: lab tests and customer pilots
- Support: on-site troubleshooting and failure analysis
- CI: incremental product and process gains
ESG compliance and site reclamation
Dust control, water stewardship and emissions management are core routines with continuous monitoring and mitigation to meet air and water standards. Safety training and regular audits drive incident prevention and workforce readiness. Progressive reclamation restores disturbed land and reduces closure liabilities. Reporting aligns with EU CSRD (2024) and investor ESG expectations.
- Dust control: monitoring & suppression
- Water stewardship: reuse and discharge limits
- Emissions management: continuous measurement
- Safety audits: proactive incident prevention
Supply chain & processing: >90% recovery, <5% variability, >100/wk
Mapping, coring and metallurgical testing underpin reserve models; grade control sustains product consistency. Processing achieves recoveries >90% with particle variability <5%; 2024 CI efforts raised yields and cut energy intensity. Logistics coordinated >100 weekly dispatches in 2024 to meet JIT demand. R&D, technical support and ESG programs (EU CSRD 2024) drive product differentiation and compliance.
| Metric | 2024 |
|---|---|
| Processing recovery | >90% |
| Particle variability | <5% |
| Dispatches/week | >100 |
What You See Is What You Get
Business Model Canvas
The Covia Business Model Canvas preview shown here is the exact document you will receive after purchase, not a mockup or sample. Completing your order grants immediate access to the full, editable file formatted for practical use and presentation. No hidden content or placeholders—what you see is the deliverable, ready to edit, share, and implement.











