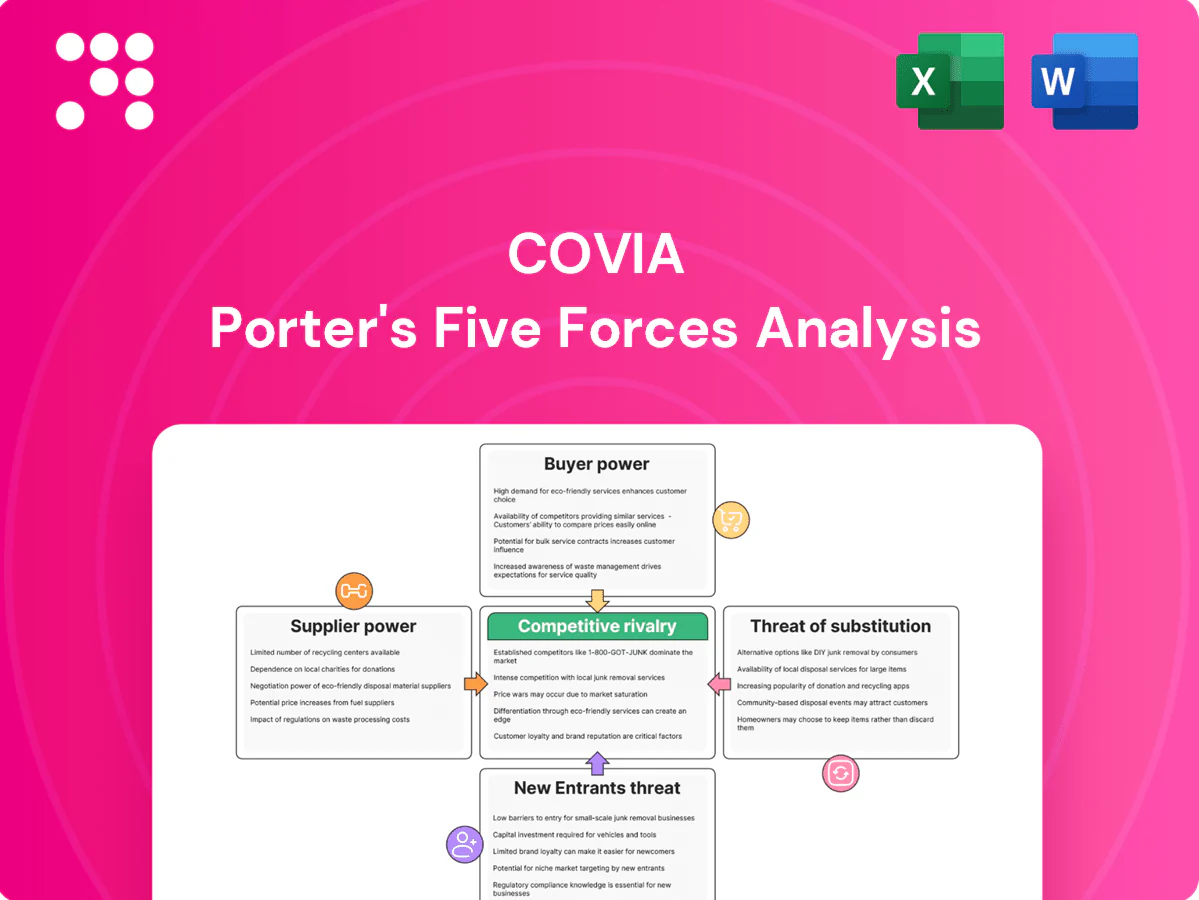
Covia Porter's Five Forces Analysis

Go Beyond the Preview—Access the Full Strategic Report
Covia’s Porter’s Five Forces snapshot highlights supplier concentration, moderate buyer power, limited substitute threats, and high capital barriers that shape margins. Competitive rivalry is intense in specialty minerals and industrial services, pressuring pricing and innovation. This brief snapshot only scratches the surface. Unlock the full Porter's Five Forces Analysis to explore Covia’s competitive dynamics, market pressures, and strategic advantages in detail.
Suppliers Bargaining Power

Concentrated critical inputs
Explosives, specialty chemicals, and heavy-equipment parts for Covia are sourced from a handful of OEMs and distributors, raising switching costs and extending lead times. Concentration in railcar leasing and locomotive slot availability further tightens supplier leverage in peak periods. Long-term agreements blunt but do not eliminate exposure, and supplier outages can quickly ripple through quarry and processing operations.
Energy and fuel volatility
Diesel, electricity and natural gas drive Covia’s mining, drying and processing costs—U.S. 2024 averages were roughly $3.94/gal diesel, $2.84/MMBtu Henry Hub natural gas and ~$0.075/kWh industrial electricity, so price spikes or curtailments can rapidly compress margins. Hedging reduces but does not eliminate exposure to sudden moves. Local grid constraints and fuel supply bottlenecks near plants amplify supplier leverage and outage risk.

Mineral rights and landowners
Leased reserves and royalty arrangements give landowners strong leverage over Covia, with royalty rates typically in the 2–12% range and renewal windows often prompting rent or royalty increases commonly of 10–25% as of 2024. Scarcity of high‑purity, well‑situated Tier‑1 silica reserves concentrates bargaining power with lessors and can raise acquisition costs. Owning fee‑simple acreage materially reduces this dependency and stabilizes operating margins.

Logistics partners’ leverage
Railroads (seven Class I carriers) and concentrated transload/last-mile networks give logistics partners outsized leverage; rail still moves roughly 40% of US freight ton-miles (2024 est.), so congestion or service shifts can quickly raise rates and bargaining power. Take-or-pay and minimum-volume clauses commonly lock in costs, while proximity to major basins (eg Permian) partially offsets exposure.
- 7 Class I railroads
- ~40% of US freight ton-miles (2024 est.)
- Take-or-pay/minimum volumes = locked costs
- Proximity to basins reduces but does not eliminate risk
Supplier switching frictions
Requalifying inputs and parts can sideline operations and jeopardize ISO/quality certifications, often requiring months of testing and audits; equipment substitutions are nontrivial. In 2024 industrial OEM lead times for dryers, screens and crushers commonly ranged 20–40 weeks, limiting near-term substitutes. Multi-sourcing is feasible but raises logistics and validation costs, while scale purchases win concessions yet bottleneck components retain pricing power.
- Requalification: months, audit risk
- Lead times: 20–40 weeks (2024)
- Multi-sourcing: higher validation/logistics cost
- Scale: discounts but bottleneck parts keep pricing leverage
Concentrated suppliers, long lead times and rising energy, rail and royalty costs squeeze margins
Suppliers exert high leverage via concentrated OEMs for explosives/parts, long lead times (20–40 weeks in 2024) and validation risks that raise switching costs.
Energy and logistics suppliers can compress margins: diesel ~$3.94/gal, natural gas ~$2.84/MMBtu, industrial power ~$0.075/kWh (2024); rail handles ~40% of freight ton‑miles and seven Class I carriers dominate service.
Landowners/lessors drive reserve costs (royalties 2–12%; renewal uplifts 10–25% in 2024), while long contracts and take‑or‑pay clauses lock exposure.
| Metric | 2024 Value |
|---|---|
| Diesel | $3.94/gal |
| Natural gas | $2.84/MMBtu |
| Industrial power | $0.075/kWh |
| Rail share | ~40% freight ton‑miles |
| Class I railroads | 7 |
| Lead times | 20–40 weeks |
| Royalties | 2–12% (renewals +10–25%) |
What is included in the product
 Detailed Word Document
Tailored Porter's Five Forces analysis for Covia that uncovers competitive drivers—rivalry, supplier and buyer power, threat of entrants and substitutes—evaluating pricing, profitability and market-entry risks with strategic commentary and data-backed insights, delivered in fully editable Word format for easy integration into investor decks and strategy reports.

 Customizable Excel Spreadsheet
Covia Porter's Five Forces delivers a single-sheet, customizable snapshot that clarifies supplier, buyer, entrant and substitute pressures—perfect for rapid strategic decisions and slide-ready summaries.
Customers Bargaining Power

Concentrated E&P customers
Supermajors and large shale operators command volume and pricing terms for proppants. Their procurement scale enables multi-year, take-or-pay negotiations with benchmarking. Service companies bundling sand with pumping further consolidate buying power. Spot markets remain price-sensitive in downcycles; U.S. oil production averaged about 12.2 million b/d in 2024, supporting baseline proppant demand.
Industrial OEM specifications
Industrial OEMs in glass, foundry, and chemical markets demand tight specs and consistent gradations, with qualification cycles typically taking 12–24 months but yielding sticky volumes—industry repeat rates often exceed 75% once approved. Buyers commonly employ dual sourcing (around 70% of OEMs) to extract price concessions. Contract compliance is enforced through quality metrics and on-time delivery, with penalties or rebates often tied to 5–10% of shipment value.

High price elasticity
Energy and industrial buyers respond rapidly to price moves because products act like commodities; with the US rig count down about 8% year-over-year to roughly 640 in 2024, demand sensitivity rose. E&P sand intensity can be dialed up or down as operators optimize completion economics, while industrial buyers tweak blends or delay orders to chase lower spot prices. In oversupplied markets this behavior magnifies buyer leverage, pressuring margins and spot pricing.

Switching options and in-basin
In-basin mines near shale plays reduce delivered cost, offering buyers ready alternatives; in 2024 buyers increasingly sourced locally to lower wellhead cost.
Buyers pivot between rail-delivered Northern White and local brown sands with delivered-cost-to-wellhead dominating procurement; logistics reliability and consistent supply temper pure price shopping.
- In-basin supply lowers delivered cost
- Switch between Northern White and brown sands
- Delivered-cost-to-wellhead drives decisions
- Logistics reliability = differentiation
Demand cyclicality
Oil price cycles and swings in construction/industrial activity move Covia volumes sharply; Brent averaged about $86/bbl in 2024, amplifying demand volatility. In downturns buyers push concessions and renegotiate terms, while inventory destocking intensifies downward price pressure. Upcycles briefly rebalance bargaining power but quickly invite rapid capacity responses that compress margins.
- Brent ~86/bbl (2024)
- Buyers demand concessions in downturns
- Inventory destocking increases price pressure
- Upcycles spur fast capacity additions
E&P buyers wield price/term leverage; US oil ~12.2M b/d, rigs ~640, Brent $86
Large E&P customers and service bundles exert strong price/term leverage; US oil production ~12.2M b/d (2024) and rig count ~640 raise proppant sensitivity. OEMs require tight specs with >75% repeat rates and ~70% dual sourcing, enforcing 5–10% quality penalties. In-basin sands and delivered-cost-to-wellhead drive switching, amplifying buyer bargaining in downturns (Brent ~86/bbl 2024).
| Metric | 2024 |
|---|---|
| US oil prod | 12.2M b/d |
| Rig count | ~640 |
| Brent | $86/bbl |
| OEM repeat | >75% |
| Dual sourcing | ~70% |
Preview Before You Purchase
Covia Porter's Five Forces Analysis
This preview shows the exact Covia Porter’s Five Forces analysis you'll receive immediately after purchase—no surprises, no placeholders. The document displayed is the full, professionally formatted analysis, ready for download and use the moment you buy. You’re looking at the actual deliverable; once you complete your purchase, you’ll get instant access to this identical file.

Go Beyond the Preview—Access the Full Strategic Report
Covia’s Porter’s Five Forces snapshot highlights supplier concentration, moderate buyer power, limited substitute threats, and high capital barriers that shape margins. Competitive rivalry is intense in specialty minerals and industrial services, pressuring pricing and innovation. This brief snapshot only scratches the surface. Unlock the full Porter's Five Forces Analysis to explore Covia’s competitive dynamics, market pressures, and strategic advantages in detail.
Suppliers Bargaining Power
Concentrated critical inputs
Explosives, specialty chemicals, and heavy-equipment parts for Covia are sourced from a handful of OEMs and distributors, raising switching costs and extending lead times. Concentration in railcar leasing and locomotive slot availability further tightens supplier leverage in peak periods. Long-term agreements blunt but do not eliminate exposure, and supplier outages can quickly ripple through quarry and processing operations.
Energy and fuel volatility
Diesel, electricity and natural gas drive Covia’s mining, drying and processing costs—U.S. 2024 averages were roughly $3.94/gal diesel, $2.84/MMBtu Henry Hub natural gas and ~$0.075/kWh industrial electricity, so price spikes or curtailments can rapidly compress margins. Hedging reduces but does not eliminate exposure to sudden moves. Local grid constraints and fuel supply bottlenecks near plants amplify supplier leverage and outage risk.
Mineral rights and landowners
Leased reserves and royalty arrangements give landowners strong leverage over Covia, with royalty rates typically in the 2–12% range and renewal windows often prompting rent or royalty increases commonly of 10–25% as of 2024. Scarcity of high‑purity, well‑situated Tier‑1 silica reserves concentrates bargaining power with lessors and can raise acquisition costs. Owning fee‑simple acreage materially reduces this dependency and stabilizes operating margins.
Logistics partners’ leverage
Railroads (seven Class I carriers) and concentrated transload/last-mile networks give logistics partners outsized leverage; rail still moves roughly 40% of US freight ton-miles (2024 est.), so congestion or service shifts can quickly raise rates and bargaining power. Take-or-pay and minimum-volume clauses commonly lock in costs, while proximity to major basins (eg Permian) partially offsets exposure.
- 7 Class I railroads
- ~40% of US freight ton-miles (2024 est.)
- Take-or-pay/minimum volumes = locked costs
- Proximity to basins reduces but does not eliminate risk
Supplier switching frictions
Requalifying inputs and parts can sideline operations and jeopardize ISO/quality certifications, often requiring months of testing and audits; equipment substitutions are nontrivial. In 2024 industrial OEM lead times for dryers, screens and crushers commonly ranged 20–40 weeks, limiting near-term substitutes. Multi-sourcing is feasible but raises logistics and validation costs, while scale purchases win concessions yet bottleneck components retain pricing power.
- Requalification: months, audit risk
- Lead times: 20–40 weeks (2024)
- Multi-sourcing: higher validation/logistics cost
- Scale: discounts but bottleneck parts keep pricing leverage
Concentrated suppliers, long lead times and rising energy, rail and royalty costs squeeze margins
Suppliers exert high leverage via concentrated OEMs for explosives/parts, long lead times (20–40 weeks in 2024) and validation risks that raise switching costs.
Energy and logistics suppliers can compress margins: diesel ~$3.94/gal, natural gas ~$2.84/MMBtu, industrial power ~$0.075/kWh (2024); rail handles ~40% of freight ton‑miles and seven Class I carriers dominate service.
Landowners/lessors drive reserve costs (royalties 2–12%; renewal uplifts 10–25% in 2024), while long contracts and take‑or‑pay clauses lock exposure.
| Metric | 2024 Value |
|---|---|
| Diesel | $3.94/gal |
| Natural gas | $2.84/MMBtu |
| Industrial power | $0.075/kWh |
| Rail share | ~40% freight ton‑miles |
| Class I railroads | 7 |
| Lead times | 20–40 weeks |
| Royalties | 2–12% (renewals +10–25%) |
What is included in the product
Detailed Word Document
Tailored Porter's Five Forces analysis for Covia that uncovers competitive drivers—rivalry, supplier and buyer power, threat of entrants and substitutes—evaluating pricing, profitability and market-entry risks with strategic commentary and data-backed insights, delivered in fully editable Word format for easy integration into investor decks and strategy reports.
Customizable Excel Spreadsheet
Covia Porter's Five Forces delivers a single-sheet, customizable snapshot that clarifies supplier, buyer, entrant and substitute pressures—perfect for rapid strategic decisions and slide-ready summaries.
Customers Bargaining Power
Concentrated E&P customers
Supermajors and large shale operators command volume and pricing terms for proppants. Their procurement scale enables multi-year, take-or-pay negotiations with benchmarking. Service companies bundling sand with pumping further consolidate buying power. Spot markets remain price-sensitive in downcycles; U.S. oil production averaged about 12.2 million b/d in 2024, supporting baseline proppant demand.
Industrial OEM specifications
Industrial OEMs in glass, foundry, and chemical markets demand tight specs and consistent gradations, with qualification cycles typically taking 12–24 months but yielding sticky volumes—industry repeat rates often exceed 75% once approved. Buyers commonly employ dual sourcing (around 70% of OEMs) to extract price concessions. Contract compliance is enforced through quality metrics and on-time delivery, with penalties or rebates often tied to 5–10% of shipment value.
High price elasticity
Energy and industrial buyers respond rapidly to price moves because products act like commodities; with the US rig count down about 8% year-over-year to roughly 640 in 2024, demand sensitivity rose. E&P sand intensity can be dialed up or down as operators optimize completion economics, while industrial buyers tweak blends or delay orders to chase lower spot prices. In oversupplied markets this behavior magnifies buyer leverage, pressuring margins and spot pricing.
Switching options and in-basin
In-basin mines near shale plays reduce delivered cost, offering buyers ready alternatives; in 2024 buyers increasingly sourced locally to lower wellhead cost.
Buyers pivot between rail-delivered Northern White and local brown sands with delivered-cost-to-wellhead dominating procurement; logistics reliability and consistent supply temper pure price shopping.
- In-basin supply lowers delivered cost
- Switch between Northern White and brown sands
- Delivered-cost-to-wellhead drives decisions
- Logistics reliability = differentiation
Demand cyclicality
Oil price cycles and swings in construction/industrial activity move Covia volumes sharply; Brent averaged about $86/bbl in 2024, amplifying demand volatility. In downturns buyers push concessions and renegotiate terms, while inventory destocking intensifies downward price pressure. Upcycles briefly rebalance bargaining power but quickly invite rapid capacity responses that compress margins.
- Brent ~86/bbl (2024)
- Buyers demand concessions in downturns
- Inventory destocking increases price pressure
- Upcycles spur fast capacity additions
E&P buyers wield price/term leverage; US oil ~12.2M b/d, rigs ~640, Brent $86
Large E&P customers and service bundles exert strong price/term leverage; US oil production ~12.2M b/d (2024) and rig count ~640 raise proppant sensitivity. OEMs require tight specs with >75% repeat rates and ~70% dual sourcing, enforcing 5–10% quality penalties. In-basin sands and delivered-cost-to-wellhead drive switching, amplifying buyer bargaining in downturns (Brent ~86/bbl 2024).
| Metric | 2024 |
|---|---|
| US oil prod | 12.2M b/d |
| Rig count | ~640 |
| Brent | $86/bbl |
| OEM repeat | >75% |
| Dual sourcing | ~70% |
Preview Before You Purchase
Covia Porter's Five Forces Analysis
This preview shows the exact Covia Porter’s Five Forces analysis you'll receive immediately after purchase—no surprises, no placeholders. The document displayed is the full, professionally formatted analysis, ready for download and use the moment you buy. You’re looking at the actual deliverable; once you complete your purchase, you’ll get instant access to this identical file.
Description
Go Beyond the Preview—Access the Full Strategic Report
Covia’s Porter’s Five Forces snapshot highlights supplier concentration, moderate buyer power, limited substitute threats, and high capital barriers that shape margins. Competitive rivalry is intense in specialty minerals and industrial services, pressuring pricing and innovation. This brief snapshot only scratches the surface. Unlock the full Porter's Five Forces Analysis to explore Covia’s competitive dynamics, market pressures, and strategic advantages in detail.
Suppliers Bargaining Power
Concentrated critical inputs
Explosives, specialty chemicals, and heavy-equipment parts for Covia are sourced from a handful of OEMs and distributors, raising switching costs and extending lead times. Concentration in railcar leasing and locomotive slot availability further tightens supplier leverage in peak periods. Long-term agreements blunt but do not eliminate exposure, and supplier outages can quickly ripple through quarry and processing operations.
Energy and fuel volatility
Diesel, electricity and natural gas drive Covia’s mining, drying and processing costs—U.S. 2024 averages were roughly $3.94/gal diesel, $2.84/MMBtu Henry Hub natural gas and ~$0.075/kWh industrial electricity, so price spikes or curtailments can rapidly compress margins. Hedging reduces but does not eliminate exposure to sudden moves. Local grid constraints and fuel supply bottlenecks near plants amplify supplier leverage and outage risk.
Mineral rights and landowners
Leased reserves and royalty arrangements give landowners strong leverage over Covia, with royalty rates typically in the 2–12% range and renewal windows often prompting rent or royalty increases commonly of 10–25% as of 2024. Scarcity of high‑purity, well‑situated Tier‑1 silica reserves concentrates bargaining power with lessors and can raise acquisition costs. Owning fee‑simple acreage materially reduces this dependency and stabilizes operating margins.
Logistics partners’ leverage
Railroads (seven Class I carriers) and concentrated transload/last-mile networks give logistics partners outsized leverage; rail still moves roughly 40% of US freight ton-miles (2024 est.), so congestion or service shifts can quickly raise rates and bargaining power. Take-or-pay and minimum-volume clauses commonly lock in costs, while proximity to major basins (eg Permian) partially offsets exposure.
- 7 Class I railroads
- ~40% of US freight ton-miles (2024 est.)
- Take-or-pay/minimum volumes = locked costs
- Proximity to basins reduces but does not eliminate risk
Supplier switching frictions
Requalifying inputs and parts can sideline operations and jeopardize ISO/quality certifications, often requiring months of testing and audits; equipment substitutions are nontrivial. In 2024 industrial OEM lead times for dryers, screens and crushers commonly ranged 20–40 weeks, limiting near-term substitutes. Multi-sourcing is feasible but raises logistics and validation costs, while scale purchases win concessions yet bottleneck components retain pricing power.
- Requalification: months, audit risk
- Lead times: 20–40 weeks (2024)
- Multi-sourcing: higher validation/logistics cost
- Scale: discounts but bottleneck parts keep pricing leverage
Concentrated suppliers, long lead times and rising energy, rail and royalty costs squeeze margins
Suppliers exert high leverage via concentrated OEMs for explosives/parts, long lead times (20–40 weeks in 2024) and validation risks that raise switching costs.
Energy and logistics suppliers can compress margins: diesel ~$3.94/gal, natural gas ~$2.84/MMBtu, industrial power ~$0.075/kWh (2024); rail handles ~40% of freight ton‑miles and seven Class I carriers dominate service.
Landowners/lessors drive reserve costs (royalties 2–12%; renewal uplifts 10–25% in 2024), while long contracts and take‑or‑pay clauses lock exposure.
| Metric | 2024 Value |
|---|---|
| Diesel | $3.94/gal |
| Natural gas | $2.84/MMBtu |
| Industrial power | $0.075/kWh |
| Rail share | ~40% freight ton‑miles |
| Class I railroads | 7 |
| Lead times | 20–40 weeks |
| Royalties | 2–12% (renewals +10–25%) |
What is included in the product
Detailed Word Document
Tailored Porter's Five Forces analysis for Covia that uncovers competitive drivers—rivalry, supplier and buyer power, threat of entrants and substitutes—evaluating pricing, profitability and market-entry risks with strategic commentary and data-backed insights, delivered in fully editable Word format for easy integration into investor decks and strategy reports.
Customizable Excel Spreadsheet
Covia Porter's Five Forces delivers a single-sheet, customizable snapshot that clarifies supplier, buyer, entrant and substitute pressures—perfect for rapid strategic decisions and slide-ready summaries.
Customers Bargaining Power
Concentrated E&P customers
Supermajors and large shale operators command volume and pricing terms for proppants. Their procurement scale enables multi-year, take-or-pay negotiations with benchmarking. Service companies bundling sand with pumping further consolidate buying power. Spot markets remain price-sensitive in downcycles; U.S. oil production averaged about 12.2 million b/d in 2024, supporting baseline proppant demand.
Industrial OEM specifications
Industrial OEMs in glass, foundry, and chemical markets demand tight specs and consistent gradations, with qualification cycles typically taking 12–24 months but yielding sticky volumes—industry repeat rates often exceed 75% once approved. Buyers commonly employ dual sourcing (around 70% of OEMs) to extract price concessions. Contract compliance is enforced through quality metrics and on-time delivery, with penalties or rebates often tied to 5–10% of shipment value.
High price elasticity
Energy and industrial buyers respond rapidly to price moves because products act like commodities; with the US rig count down about 8% year-over-year to roughly 640 in 2024, demand sensitivity rose. E&P sand intensity can be dialed up or down as operators optimize completion economics, while industrial buyers tweak blends or delay orders to chase lower spot prices. In oversupplied markets this behavior magnifies buyer leverage, pressuring margins and spot pricing.
Switching options and in-basin
In-basin mines near shale plays reduce delivered cost, offering buyers ready alternatives; in 2024 buyers increasingly sourced locally to lower wellhead cost.
Buyers pivot between rail-delivered Northern White and local brown sands with delivered-cost-to-wellhead dominating procurement; logistics reliability and consistent supply temper pure price shopping.
- In-basin supply lowers delivered cost
- Switch between Northern White and brown sands
- Delivered-cost-to-wellhead drives decisions
- Logistics reliability = differentiation
Demand cyclicality
Oil price cycles and swings in construction/industrial activity move Covia volumes sharply; Brent averaged about $86/bbl in 2024, amplifying demand volatility. In downturns buyers push concessions and renegotiate terms, while inventory destocking intensifies downward price pressure. Upcycles briefly rebalance bargaining power but quickly invite rapid capacity responses that compress margins.
- Brent ~86/bbl (2024)
- Buyers demand concessions in downturns
- Inventory destocking increases price pressure
- Upcycles spur fast capacity additions
E&P buyers wield price/term leverage; US oil ~12.2M b/d, rigs ~640, Brent $86
Large E&P customers and service bundles exert strong price/term leverage; US oil production ~12.2M b/d (2024) and rig count ~640 raise proppant sensitivity. OEMs require tight specs with >75% repeat rates and ~70% dual sourcing, enforcing 5–10% quality penalties. In-basin sands and delivered-cost-to-wellhead drive switching, amplifying buyer bargaining in downturns (Brent ~86/bbl 2024).
| Metric | 2024 |
|---|---|
| US oil prod | 12.2M b/d |
| Rig count | ~640 |
| Brent | $86/bbl |
| OEM repeat | >75% |
| Dual sourcing | ~70% |
Preview Before You Purchase
Covia Porter's Five Forces Analysis
This preview shows the exact Covia Porter’s Five Forces analysis you'll receive immediately after purchase—no surprises, no placeholders. The document displayed is the full, professionally formatted analysis, ready for download and use the moment you buy. You’re looking at the actual deliverable; once you complete your purchase, you’ll get instant access to this identical file.











