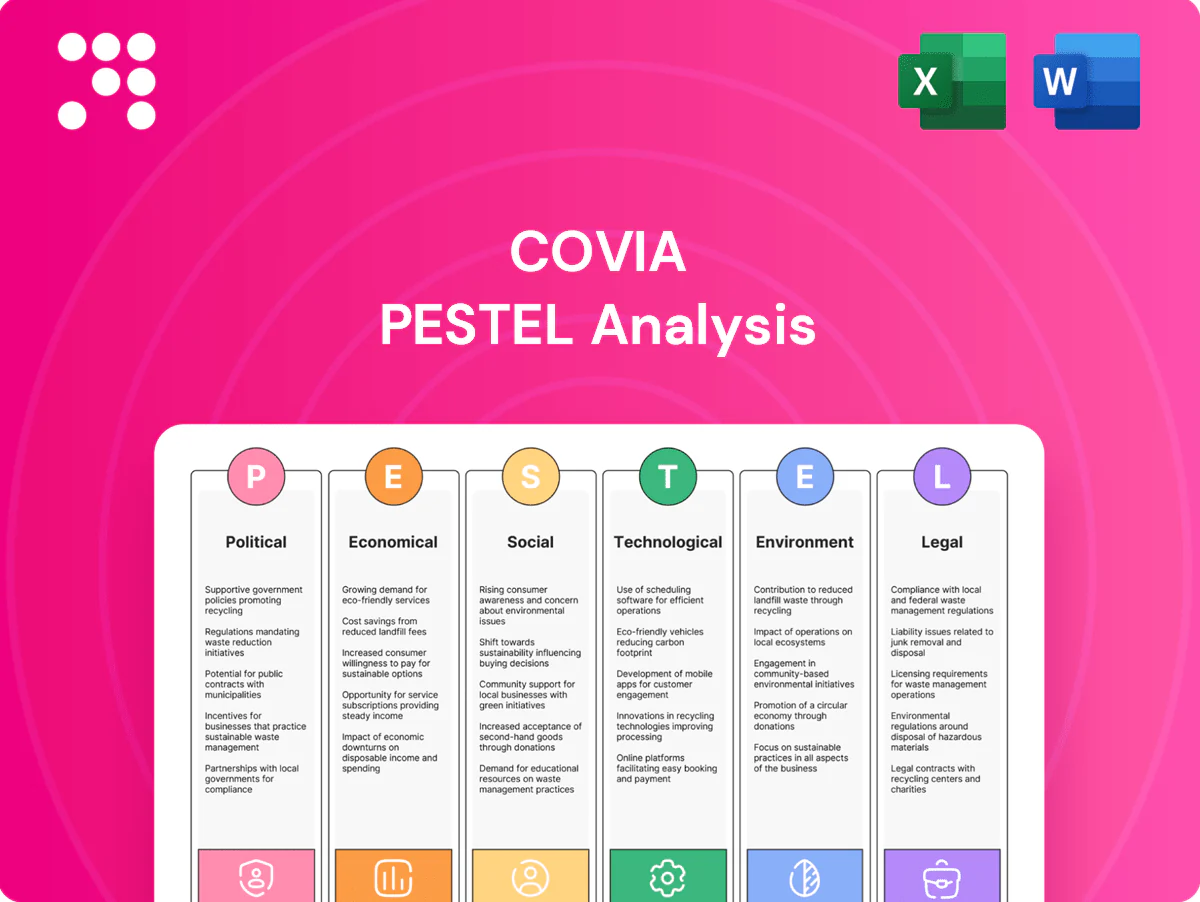
Covia PESTLE Analysis

Skip the Research. Get the Strategy.
Gain a strategic edge with our Covia PESTLE Analysis—three to five-minute insights into the political, economic, social, technological, legal, and environmental forces shaping the company. This concise briefing highlights key risks and opportunities investors and strategists need now. Ideal for boardrooms, pitches, or market research. Purchase the full, downloadable analysis for the complete, actionable intelligence.
Political factors

Permitting and land-use approvals
Mining and processing sites depend on federal, state and local permits; US mine permitting commonly spans 3–7 years, and shifts in political leadership can materially tighten or streamline approvals, affecting timelines and capex forecasts. Community opposition often triggers zoning challenges or added conditions and litigation, while predictable permitting regimes reduce project risk and improve capacity planning and financing certainty.
Energy policy and fracking stance
Oil and gas proppant demand is highly sensitive to political attitudes toward hydraulic fracturing; US crude production averaged about 13.1 million barrels per day in 2024 (EIA), tying proppant volumes to policy shifts. Restrictions on drilling on public lands or EPA methane rules finalized in 2023 can slow completions activity and reduce short-term sand demand. Supportive state or federal policies can catalyze basin growth and uplift volumes, while policy volatility complicates production planning and inventory positioning.

Trade policy and tariffs on minerals
Tariffs, antidumping measures and export controls directly raise Covia’s input costs and international pricing—US-China tariffs reaching up to 25% on affected industrial goods since 2018 have set precedent for similar measures. Geopolitical tensions can disrupt cross-border flows of equipment and specialty minerals, as seen after 2022 sanctions that reshaped European supply chains. Favorable trade deals can open new markets for silica products, while sanctions dynamics re-map competitive suppliers.

Infrastructure and construction spending
Public infrastructure bills such as the 2021 IIJA (1.2 trillion USD total; 550 billion USD new spending) materially boost aggregates, glass and construction-material demand, supporting Covia’s end markets; political emphasis on housing and transportation helps sustain order books while appropriation delays can push project starts and revenue timing. Regional funding differences drive plant utilization variability.
- IIJA: 1.2 trillion USD total, 550 billion USD new
- Housing/transport prioritization → stable orders
- Appropriation delays → deferred project starts
- Regional funding → variable plant utilization
Subnational policy fragmentation
Subnational policy fragmentation means Covia must navigate regulations across 50 states and roughly 19,500 local governments, creating a patchwork of mining, trucking and environmental rules that raises compliance complexity and logistics costs. Divergent standards increase permitting time and local mitigation expenses; political alignment across jurisdictions can materially ease inter-facility coordination and reduce delays. Divergence also heightens the need for localized stakeholder engagement and tailored community investment strategies.
- Regulatory scope: 50 states, ~19,500 local governments
- Impact: higher compliance and logistics costs from patchwork standards
- Mitigation: inter-jurisdictional alignment improves coordination
- Action: localized stakeholder engagement required
Permitting, tariffs and IIJA drive proppant demand — US crude ≈13.1 mbpd
Federal, state and local permitting (commonly 3–7 years) and subnational fragmentation (50 states, ~19,500 local governments) drive capex timing, compliance and logistics costs. Fracking policy and US crude production (≈13.1 mbpd in 2024) link proppant demand to political shifts. Trade measures (tariffs up to 25%) and infrastructure spending (IIJA 1.2T total; 550B new) materially affect volumes and pricing.
| Metric | Value |
|---|---|
| Permitting time | 3–7 years |
| US crude (2024) | ≈13.1 mbpd |
| IIJA | 1.2T total; 550B new |
| Tariffs | Up to 25% |
| Jurisdictions | 50 states; ~19,500 local |
What is included in the product
 Detailed Word Document
Explores how macro-environmental factors uniquely affect Covia across Political, Economic, Social, Technological, Environmental and Legal dimensions, with data-backed trends and forward-looking insights; designed for executives and investors, aligned to regional/regulatory realities and formatted for business plans, decks and scenario planning.

 Customizable Excel Spreadsheet
A concise, visually segmented PESTLE summary of Covia that can be dropped into presentations, annotated for local context, and shared across teams to streamline external risk discussions and client reports.
Economic factors

Cyclicality of oil and gas activity
Proppant volumes closely track rig counts, WTI and Henry Hub prices and completion intensity; with WTI averaging about $77/bbl and Henry Hub near $3.25/MMBtu in 2024, activity correlated with higher sand demand. Downturns compress pricing power and asset utilization, often cutting utilization by double digits. Supercycle upswings strain logistics and working capital as volumes spike. Hedging and long-term customer contracts can partially smooth revenue volatility.
Construction and industrial production trends
Glass, foundry, roofing and building-products demand track industrial production and US housing starts, which averaged about 1.4 million starts in 2024, tying demand to residential cycles. GDP growth and ISM PMI readings (around the mid-40s to low-50s in 2024–H1 2025) signal volume outlooks for Covia’s end markets. OEM inventory destocking in 2024 reduced shipments temporarily as firms cut stocks. Public infrastructure spending under the IIJA and state programs can offset private construction softness.

Inflation, energy, and freight costs
Diesel, power, rail, and trucking rates materially affect Covia’s delivered cost: fuel represents roughly 20–30% of trucking operating costs and rail/trucking rate volatility drove 2024 logistics inflation that pressured margins.
Inflation passes through unevenly due to fixed-price and indexed contracts; fuel surcharges typically recover a majority of fuel swings but timing gaps leave short-term exposure.
Network optimization and fuel surcharges helped protect margins while energy-efficiency investments (reducing site energy use by double digits over multi-year programs) lower long-term cost exposure.

Currency and global diversification
As part of SCR-Sibelco, FX swings materially affect consolidated results and cross-border competitiveness; the US dollar peaked at DXY 114.78 in Sep 2022 and was near 103 in mid-2025, tightening export margins while cutting imported equipment costs when invoiced in USD. Diversified end-markets across construction, glass and specialty fillers buffer single-sector shocks, while portfolio mix drives EBITDA stability.
- FX exposure: USD strength vs EUR/BRL impacts margins
- Cost offset: cheaper USD-priced capex
- Diversification: reduces single-market EBITDA volatility
Post-bankruptcy capital access
Post-bankruptcy balance sheet repair expands Covia's capacity for targeted growth capex and selective M&A while lender covenants may still limit leverage and cash distributions; sustained profitability restores credibility with customers and suppliers. With US policy rates around 5.25–5.50% in mid-2025, cost of capital remains elevated, so improved cash conversion is critical to fund high-ROIC niches internally.
- Lower leverage: more capex/M&A optionality
- Covenants: constrain payouts
- Better cash conversion: funds reinvestment
- Profitability: restores supplier/customer trust
Permitting, tariffs and IIJA drive proppant demand — US crude ≈13.1 mbpd
Proppant volumes follow rig counts and energy prices (WTI ≈ $77/bbl, Henry Hub ≈ $3.25/MMBtu in 2024), lifting sand demand; downturns cut utilization sharply. Diesel/rail/truck fuel (≈20–30% of trucking opex) and 2024 logistics inflation pressured margins. Post-bankruptcy lower leverage increases capex/M&A optionality while US policy rates (~5.25–5.50% mid-2025) keep cost of capital high.
| Metric | 2024/ mid‑2025 |
|---|---|
| WTI | $77/bbl (2024) |
| Henry Hub | $3.25/MMBtu (2024) |
| Policy rate | 5.25–5.50% (mid‑2025) |
Full Version Awaits
Covia PESTLE Analysis
The preview shown here is the exact Covia PESTLE document you’ll receive after purchase—fully formatted and ready to use. This is the real, final file with professional layout and complete content, not a placeholder. After checkout you’ll be able to download this identical document instantly.

Skip the Research. Get the Strategy.
Gain a strategic edge with our Covia PESTLE Analysis—three to five-minute insights into the political, economic, social, technological, legal, and environmental forces shaping the company. This concise briefing highlights key risks and opportunities investors and strategists need now. Ideal for boardrooms, pitches, or market research. Purchase the full, downloadable analysis for the complete, actionable intelligence.
Political factors
Permitting and land-use approvals
Mining and processing sites depend on federal, state and local permits; US mine permitting commonly spans 3–7 years, and shifts in political leadership can materially tighten or streamline approvals, affecting timelines and capex forecasts. Community opposition often triggers zoning challenges or added conditions and litigation, while predictable permitting regimes reduce project risk and improve capacity planning and financing certainty.
Energy policy and fracking stance
Oil and gas proppant demand is highly sensitive to political attitudes toward hydraulic fracturing; US crude production averaged about 13.1 million barrels per day in 2024 (EIA), tying proppant volumes to policy shifts. Restrictions on drilling on public lands or EPA methane rules finalized in 2023 can slow completions activity and reduce short-term sand demand. Supportive state or federal policies can catalyze basin growth and uplift volumes, while policy volatility complicates production planning and inventory positioning.
Trade policy and tariffs on minerals
Tariffs, antidumping measures and export controls directly raise Covia’s input costs and international pricing—US-China tariffs reaching up to 25% on affected industrial goods since 2018 have set precedent for similar measures. Geopolitical tensions can disrupt cross-border flows of equipment and specialty minerals, as seen after 2022 sanctions that reshaped European supply chains. Favorable trade deals can open new markets for silica products, while sanctions dynamics re-map competitive suppliers.
Infrastructure and construction spending
Public infrastructure bills such as the 2021 IIJA (1.2 trillion USD total; 550 billion USD new spending) materially boost aggregates, glass and construction-material demand, supporting Covia’s end markets; political emphasis on housing and transportation helps sustain order books while appropriation delays can push project starts and revenue timing. Regional funding differences drive plant utilization variability.
- IIJA: 1.2 trillion USD total, 550 billion USD new
- Housing/transport prioritization → stable orders
- Appropriation delays → deferred project starts
- Regional funding → variable plant utilization
Subnational policy fragmentation
Subnational policy fragmentation means Covia must navigate regulations across 50 states and roughly 19,500 local governments, creating a patchwork of mining, trucking and environmental rules that raises compliance complexity and logistics costs. Divergent standards increase permitting time and local mitigation expenses; political alignment across jurisdictions can materially ease inter-facility coordination and reduce delays. Divergence also heightens the need for localized stakeholder engagement and tailored community investment strategies.
- Regulatory scope: 50 states, ~19,500 local governments
- Impact: higher compliance and logistics costs from patchwork standards
- Mitigation: inter-jurisdictional alignment improves coordination
- Action: localized stakeholder engagement required
Permitting, tariffs and IIJA drive proppant demand — US crude ≈13.1 mbpd
Federal, state and local permitting (commonly 3–7 years) and subnational fragmentation (50 states, ~19,500 local governments) drive capex timing, compliance and logistics costs. Fracking policy and US crude production (≈13.1 mbpd in 2024) link proppant demand to political shifts. Trade measures (tariffs up to 25%) and infrastructure spending (IIJA 1.2T total; 550B new) materially affect volumes and pricing.
| Metric | Value |
|---|---|
| Permitting time | 3–7 years |
| US crude (2024) | ≈13.1 mbpd |
| IIJA | 1.2T total; 550B new |
| Tariffs | Up to 25% |
| Jurisdictions | 50 states; ~19,500 local |
What is included in the product
Detailed Word Document
Explores how macro-environmental factors uniquely affect Covia across Political, Economic, Social, Technological, Environmental and Legal dimensions, with data-backed trends and forward-looking insights; designed for executives and investors, aligned to regional/regulatory realities and formatted for business plans, decks and scenario planning.
Customizable Excel Spreadsheet
A concise, visually segmented PESTLE summary of Covia that can be dropped into presentations, annotated for local context, and shared across teams to streamline external risk discussions and client reports.
Economic factors
Cyclicality of oil and gas activity
Proppant volumes closely track rig counts, WTI and Henry Hub prices and completion intensity; with WTI averaging about $77/bbl and Henry Hub near $3.25/MMBtu in 2024, activity correlated with higher sand demand. Downturns compress pricing power and asset utilization, often cutting utilization by double digits. Supercycle upswings strain logistics and working capital as volumes spike. Hedging and long-term customer contracts can partially smooth revenue volatility.
Construction and industrial production trends
Glass, foundry, roofing and building-products demand track industrial production and US housing starts, which averaged about 1.4 million starts in 2024, tying demand to residential cycles. GDP growth and ISM PMI readings (around the mid-40s to low-50s in 2024–H1 2025) signal volume outlooks for Covia’s end markets. OEM inventory destocking in 2024 reduced shipments temporarily as firms cut stocks. Public infrastructure spending under the IIJA and state programs can offset private construction softness.
Inflation, energy, and freight costs
Diesel, power, rail, and trucking rates materially affect Covia’s delivered cost: fuel represents roughly 20–30% of trucking operating costs and rail/trucking rate volatility drove 2024 logistics inflation that pressured margins.
Inflation passes through unevenly due to fixed-price and indexed contracts; fuel surcharges typically recover a majority of fuel swings but timing gaps leave short-term exposure.
Network optimization and fuel surcharges helped protect margins while energy-efficiency investments (reducing site energy use by double digits over multi-year programs) lower long-term cost exposure.
Currency and global diversification
As part of SCR-Sibelco, FX swings materially affect consolidated results and cross-border competitiveness; the US dollar peaked at DXY 114.78 in Sep 2022 and was near 103 in mid-2025, tightening export margins while cutting imported equipment costs when invoiced in USD. Diversified end-markets across construction, glass and specialty fillers buffer single-sector shocks, while portfolio mix drives EBITDA stability.
- FX exposure: USD strength vs EUR/BRL impacts margins
- Cost offset: cheaper USD-priced capex
- Diversification: reduces single-market EBITDA volatility
Post-bankruptcy capital access
Post-bankruptcy balance sheet repair expands Covia's capacity for targeted growth capex and selective M&A while lender covenants may still limit leverage and cash distributions; sustained profitability restores credibility with customers and suppliers. With US policy rates around 5.25–5.50% in mid-2025, cost of capital remains elevated, so improved cash conversion is critical to fund high-ROIC niches internally.
- Lower leverage: more capex/M&A optionality
- Covenants: constrain payouts
- Better cash conversion: funds reinvestment
- Profitability: restores supplier/customer trust
Permitting, tariffs and IIJA drive proppant demand — US crude ≈13.1 mbpd
Proppant volumes follow rig counts and energy prices (WTI ≈ $77/bbl, Henry Hub ≈ $3.25/MMBtu in 2024), lifting sand demand; downturns cut utilization sharply. Diesel/rail/truck fuel (≈20–30% of trucking opex) and 2024 logistics inflation pressured margins. Post-bankruptcy lower leverage increases capex/M&A optionality while US policy rates (~5.25–5.50% mid-2025) keep cost of capital high.
| Metric | 2024/ mid‑2025 |
|---|---|
| WTI | $77/bbl (2024) |
| Henry Hub | $3.25/MMBtu (2024) |
| Policy rate | 5.25–5.50% (mid‑2025) |
Full Version Awaits
Covia PESTLE Analysis
The preview shown here is the exact Covia PESTLE document you’ll receive after purchase—fully formatted and ready to use. This is the real, final file with professional layout and complete content, not a placeholder. After checkout you’ll be able to download this identical document instantly.
Original: $10.00
-65%$10.00
$3.50Description
Skip the Research. Get the Strategy.
Gain a strategic edge with our Covia PESTLE Analysis—three to five-minute insights into the political, economic, social, technological, legal, and environmental forces shaping the company. This concise briefing highlights key risks and opportunities investors and strategists need now. Ideal for boardrooms, pitches, or market research. Purchase the full, downloadable analysis for the complete, actionable intelligence.
Political factors
Permitting and land-use approvals
Mining and processing sites depend on federal, state and local permits; US mine permitting commonly spans 3–7 years, and shifts in political leadership can materially tighten or streamline approvals, affecting timelines and capex forecasts. Community opposition often triggers zoning challenges or added conditions and litigation, while predictable permitting regimes reduce project risk and improve capacity planning and financing certainty.
Energy policy and fracking stance
Oil and gas proppant demand is highly sensitive to political attitudes toward hydraulic fracturing; US crude production averaged about 13.1 million barrels per day in 2024 (EIA), tying proppant volumes to policy shifts. Restrictions on drilling on public lands or EPA methane rules finalized in 2023 can slow completions activity and reduce short-term sand demand. Supportive state or federal policies can catalyze basin growth and uplift volumes, while policy volatility complicates production planning and inventory positioning.
Trade policy and tariffs on minerals
Tariffs, antidumping measures and export controls directly raise Covia’s input costs and international pricing—US-China tariffs reaching up to 25% on affected industrial goods since 2018 have set precedent for similar measures. Geopolitical tensions can disrupt cross-border flows of equipment and specialty minerals, as seen after 2022 sanctions that reshaped European supply chains. Favorable trade deals can open new markets for silica products, while sanctions dynamics re-map competitive suppliers.
Infrastructure and construction spending
Public infrastructure bills such as the 2021 IIJA (1.2 trillion USD total; 550 billion USD new spending) materially boost aggregates, glass and construction-material demand, supporting Covia’s end markets; political emphasis on housing and transportation helps sustain order books while appropriation delays can push project starts and revenue timing. Regional funding differences drive plant utilization variability.
- IIJA: 1.2 trillion USD total, 550 billion USD new
- Housing/transport prioritization → stable orders
- Appropriation delays → deferred project starts
- Regional funding → variable plant utilization
Subnational policy fragmentation
Subnational policy fragmentation means Covia must navigate regulations across 50 states and roughly 19,500 local governments, creating a patchwork of mining, trucking and environmental rules that raises compliance complexity and logistics costs. Divergent standards increase permitting time and local mitigation expenses; political alignment across jurisdictions can materially ease inter-facility coordination and reduce delays. Divergence also heightens the need for localized stakeholder engagement and tailored community investment strategies.
- Regulatory scope: 50 states, ~19,500 local governments
- Impact: higher compliance and logistics costs from patchwork standards
- Mitigation: inter-jurisdictional alignment improves coordination
- Action: localized stakeholder engagement required
Permitting, tariffs and IIJA drive proppant demand — US crude ≈13.1 mbpd
Federal, state and local permitting (commonly 3–7 years) and subnational fragmentation (50 states, ~19,500 local governments) drive capex timing, compliance and logistics costs. Fracking policy and US crude production (≈13.1 mbpd in 2024) link proppant demand to political shifts. Trade measures (tariffs up to 25%) and infrastructure spending (IIJA 1.2T total; 550B new) materially affect volumes and pricing.
| Metric | Value |
|---|---|
| Permitting time | 3–7 years |
| US crude (2024) | ≈13.1 mbpd |
| IIJA | 1.2T total; 550B new |
| Tariffs | Up to 25% |
| Jurisdictions | 50 states; ~19,500 local |
What is included in the product
Detailed Word Document
Explores how macro-environmental factors uniquely affect Covia across Political, Economic, Social, Technological, Environmental and Legal dimensions, with data-backed trends and forward-looking insights; designed for executives and investors, aligned to regional/regulatory realities and formatted for business plans, decks and scenario planning.
Customizable Excel Spreadsheet
A concise, visually segmented PESTLE summary of Covia that can be dropped into presentations, annotated for local context, and shared across teams to streamline external risk discussions and client reports.
Economic factors
Cyclicality of oil and gas activity
Proppant volumes closely track rig counts, WTI and Henry Hub prices and completion intensity; with WTI averaging about $77/bbl and Henry Hub near $3.25/MMBtu in 2024, activity correlated with higher sand demand. Downturns compress pricing power and asset utilization, often cutting utilization by double digits. Supercycle upswings strain logistics and working capital as volumes spike. Hedging and long-term customer contracts can partially smooth revenue volatility.
Construction and industrial production trends
Glass, foundry, roofing and building-products demand track industrial production and US housing starts, which averaged about 1.4 million starts in 2024, tying demand to residential cycles. GDP growth and ISM PMI readings (around the mid-40s to low-50s in 2024–H1 2025) signal volume outlooks for Covia’s end markets. OEM inventory destocking in 2024 reduced shipments temporarily as firms cut stocks. Public infrastructure spending under the IIJA and state programs can offset private construction softness.
Inflation, energy, and freight costs
Diesel, power, rail, and trucking rates materially affect Covia’s delivered cost: fuel represents roughly 20–30% of trucking operating costs and rail/trucking rate volatility drove 2024 logistics inflation that pressured margins.
Inflation passes through unevenly due to fixed-price and indexed contracts; fuel surcharges typically recover a majority of fuel swings but timing gaps leave short-term exposure.
Network optimization and fuel surcharges helped protect margins while energy-efficiency investments (reducing site energy use by double digits over multi-year programs) lower long-term cost exposure.
Currency and global diversification
As part of SCR-Sibelco, FX swings materially affect consolidated results and cross-border competitiveness; the US dollar peaked at DXY 114.78 in Sep 2022 and was near 103 in mid-2025, tightening export margins while cutting imported equipment costs when invoiced in USD. Diversified end-markets across construction, glass and specialty fillers buffer single-sector shocks, while portfolio mix drives EBITDA stability.
- FX exposure: USD strength vs EUR/BRL impacts margins
- Cost offset: cheaper USD-priced capex
- Diversification: reduces single-market EBITDA volatility
Post-bankruptcy capital access
Post-bankruptcy balance sheet repair expands Covia's capacity for targeted growth capex and selective M&A while lender covenants may still limit leverage and cash distributions; sustained profitability restores credibility with customers and suppliers. With US policy rates around 5.25–5.50% in mid-2025, cost of capital remains elevated, so improved cash conversion is critical to fund high-ROIC niches internally.
- Lower leverage: more capex/M&A optionality
- Covenants: constrain payouts
- Better cash conversion: funds reinvestment
- Profitability: restores supplier/customer trust
Permitting, tariffs and IIJA drive proppant demand — US crude ≈13.1 mbpd
Proppant volumes follow rig counts and energy prices (WTI ≈ $77/bbl, Henry Hub ≈ $3.25/MMBtu in 2024), lifting sand demand; downturns cut utilization sharply. Diesel/rail/truck fuel (≈20–30% of trucking opex) and 2024 logistics inflation pressured margins. Post-bankruptcy lower leverage increases capex/M&A optionality while US policy rates (~5.25–5.50% mid-2025) keep cost of capital high.
| Metric | 2024/ mid‑2025 |
|---|---|
| WTI | $77/bbl (2024) |
| Henry Hub | $3.25/MMBtu (2024) |
| Policy rate | 5.25–5.50% (mid‑2025) |
Full Version Awaits
Covia PESTLE Analysis
The preview shown here is the exact Covia PESTLE document you’ll receive after purchase—fully formatted and ready to use. This is the real, final file with professional layout and complete content, not a placeholder. After checkout you’ll be able to download this identical document instantly.











