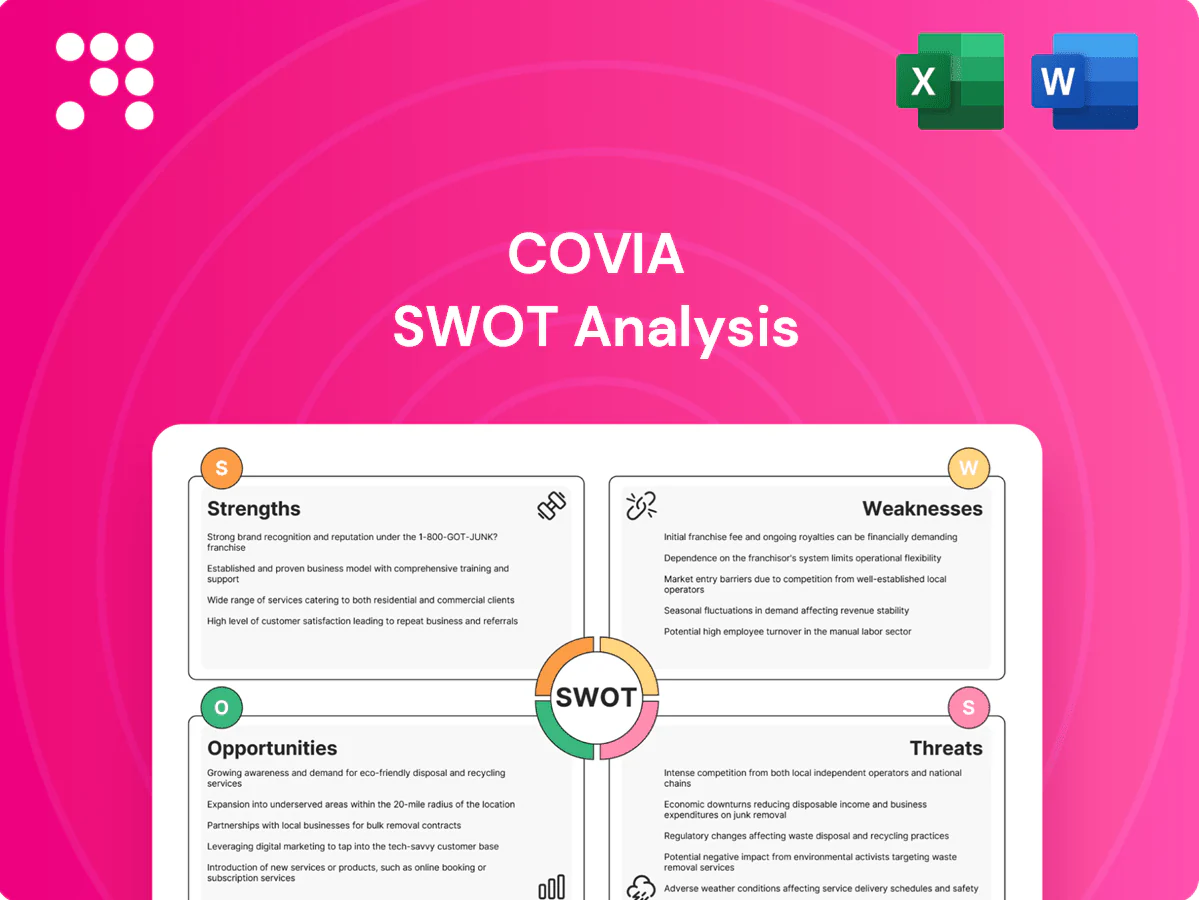
Covia SWOT Analysis

Dive Deeper Into the Company’s Strategic Blueprint
Covia’s SWOT snapshot highlights operational strengths, raw-material exposure risks, and untapped growth drivers in specialty materials. Our full SWOT delivers research-backed strategic insights, financial context, and editable Word/Excel tools. Purchase the complete report to plan, pitch, or invest with confidence.
Strengths

Diversified minerals portfolio
Balanced exposure across industrial sand, performance minerals and energy proppants helps stabilize revenue through cycles; sales to glass, foundry, building products and filtration spread demand risk across multiple end-markets. Product breadth enables cross-selling and tailored blends to customer specs, supporting pricing resilience and management of margin mix.
Vertical integration & scale
Ownership from mining through processing and logistics gave Covia tighter cost control and consistent product specs across silica and frac-sand lines. Its scale—prior to the Feb 6, 2019 Chapter 11 filing—supported throughput efficiencies and stronger rail/truck contracting. Integrated labs and QA improved spec adherence for critical industrial uses, and scale enhanced bargaining power with suppliers and customers.

Large high-quality reserve base
Access to Tier-1 sand and specialty deposits gives Covia multi-decade mine lives (20+ years), underpinning long-term feedstock security. Consistent particle size and high silica purity enable premium industrial uses such as glass and foundry markets, supporting higher realized prices. Secure reserves lower supply risk for key customers and reduce sustaining capex per ton as operations scale.

Technical application know-how
Covia's technical application know-how across glass, foundry, coatings, and proppants creates high switching costs by embedding tailored gradations and surface treatments into customer processes; collaborative R&D links product specs to measurable process outcomes and technical service supports premium pricing and strong customer retention.
- Application support: cross-industry embedding
- Custom gradations: performance differentiation
- R&D tie-ins: product-to-process outcomes
- Technical service: enables premium pricing & retention
Backed by Sibelco platform
Merger into SCR-Sibelco expands Covia’s global reach via Sibelco’s operations in 30+ countries and ~5,000 employees, enhancing distribution and market access. Shared procurement and best-practice platforms lower unit costs and enable portfolio optionality to rationalize overlapping sites. A stronger balance sheet and governance under Sibelco support renewed investment in growth and ESG.
- Global footprint: 30+ countries
- Workforce scale: ~5,000 employees
- Procurement synergies: lower unit costs
- Portfolio optionality: site rationalization
- Stronger balance sheet: supports growth & ESG
Diversified industrial-sand portfolio with 20+ year mines, vertical integration and global scale
Balanced industrial-sand, performance-minerals and proppants mix stabilizes revenue across glass, foundry, building products and filtration; vertical integration ensured cost control and spec consistency pre-2019 Chapter 11 (filed Feb 6, 2019). Tier-1 deposits offer 20+ year mine lives; technical services and R&D drive premium pricing and retention. Merger into SCR-Sibelco leverages 30+ countries and ~5,000 employees.
| Metric | Value |
|---|---|
| Mine life | 20+ years |
| Global reach | 30+ countries |
| Workforce | ~5,000 employees |
| Chapter 11 | Feb 6, 2019 |
What is included in the product
 Detailed Word Document
Provides a concise SWOT analysis of Covia, highlighting internal strengths and weaknesses and external opportunities and threats to assess its competitive position and strategic risks.

 Customizable Excel Spreadsheet
Provides a concise Covia SWOT matrix to quickly align strategy, highlight remediation priorities, and simplify stakeholder communication for faster decision-making.
Weaknesses

Exposure to energy cyclicality
Frac sand demand closely follows drilling and completion activity; during the 2015–2016 downturn sand shipments declined roughly 60%, illustrating high cyclicality. Downturns can sharply compress volumes and pricing — sand prices dropped by more than 50% in prior cycles. Such volatility complicates capacity planning and strains working capital as customer capex cuts cascade through the supply chain.
Commodity pricing pressure
Sand products face intense price competition from regional mines, limiting markups on bulk grades and keeping gross margins depressed. Spot pricing in oversupplied basins frequently forces sales at or below marginal cost, eroding profitability. Continued discounting to maintain plant utilization risks destroying long-term value and capital returns.

High logistics sensitivity
Freight makes up a material share of delivered cost-to-basin for Covia, leaving margins exposed to logistics swings; rail congestion and fuel surcharges have repeatedly widened cash costs. Truck driver shortages — estimated at roughly 80,000 in recent ATA reports — and rising diesel prices press margins. Distance-to-basin disadvantages versus in-basin miners and weather/port disruptions add further variability.

Environmental and permitting burden
Mine permitting for Covia is lengthy and often faces intense community scrutiny, commonly taking 2–5 years to secure approvals; dust, high water usage and reclamation obligations materially raise operating costs. Non-compliance can trigger fines and operational curtailments, with enforcement actions reaching millions, while legacy sites may carry significant remediation liabilities.
- Permitting delay: 2–5 years
- Cost drivers: dust, water, reclamation
- Enforcement risk: fines, curtailments (millions)
- Legacy liability: remediation obligations
Bankruptcy legacy and reputational drag
Covia filed Chapter 11 in January 2020, signaling prior excessive leverage and exposure to commodity cyclicality; some counterparties continue to demand tighter covenants or collateral. Post-reorganization talent retention and morale have been challenged, and litigation tied to pre-bankruptcy operations has persisted.
- Chapter 11: January 2020
- Counterparties may demand stricter terms/collateral
- Talent retention and morale pressure
- Lingering litigation from past operations
Highly cyclical sand supplier: shipments down ~60%, prices >50%, logistics & permitting risks
Covia is highly cyclical—shipments fell ~60% in 2015–16 and sand prices plunged >50% in past downturns, compressing margins. Intense regional price competition and frequent spot discounts pressure gross margins. Logistics (rail/truck) and driver shortages (~80,000) raise delivered costs. Permitting delays (2–5 yrs), remediation liabilities and Chapter 11 (Jan 2020) weigh on resilience.
| Metric | Value |
|---|---|
| Shipments drop (2015–16) | ~60% |
| Price decline (prior cycles) | >50% |
| Driver shortage (ATA) | ~80,000 |
| Permitting | 2–5 yrs |
| Chapter 11 | Jan 2020 |
Preview Before You Purchase
Covia SWOT Analysis
This is the actual Covia SWOT analysis document you’ll receive upon purchase—no surprises, just professional quality. The preview below is taken directly from the full report you'll get; purchase unlocks the entire, editable version. Buy now to download the complete, structured file.

Dive Deeper Into the Company’s Strategic Blueprint
Covia’s SWOT snapshot highlights operational strengths, raw-material exposure risks, and untapped growth drivers in specialty materials. Our full SWOT delivers research-backed strategic insights, financial context, and editable Word/Excel tools. Purchase the complete report to plan, pitch, or invest with confidence.
Strengths
Diversified minerals portfolio
Balanced exposure across industrial sand, performance minerals and energy proppants helps stabilize revenue through cycles; sales to glass, foundry, building products and filtration spread demand risk across multiple end-markets. Product breadth enables cross-selling and tailored blends to customer specs, supporting pricing resilience and management of margin mix.
Vertical integration & scale
Ownership from mining through processing and logistics gave Covia tighter cost control and consistent product specs across silica and frac-sand lines. Its scale—prior to the Feb 6, 2019 Chapter 11 filing—supported throughput efficiencies and stronger rail/truck contracting. Integrated labs and QA improved spec adherence for critical industrial uses, and scale enhanced bargaining power with suppliers and customers.
Large high-quality reserve base
Access to Tier-1 sand and specialty deposits gives Covia multi-decade mine lives (20+ years), underpinning long-term feedstock security. Consistent particle size and high silica purity enable premium industrial uses such as glass and foundry markets, supporting higher realized prices. Secure reserves lower supply risk for key customers and reduce sustaining capex per ton as operations scale.
Technical application know-how
Covia's technical application know-how across glass, foundry, coatings, and proppants creates high switching costs by embedding tailored gradations and surface treatments into customer processes; collaborative R&D links product specs to measurable process outcomes and technical service supports premium pricing and strong customer retention.
- Application support: cross-industry embedding
- Custom gradations: performance differentiation
- R&D tie-ins: product-to-process outcomes
- Technical service: enables premium pricing & retention
Backed by Sibelco platform
Merger into SCR-Sibelco expands Covia’s global reach via Sibelco’s operations in 30+ countries and ~5,000 employees, enhancing distribution and market access. Shared procurement and best-practice platforms lower unit costs and enable portfolio optionality to rationalize overlapping sites. A stronger balance sheet and governance under Sibelco support renewed investment in growth and ESG.
- Global footprint: 30+ countries
- Workforce scale: ~5,000 employees
- Procurement synergies: lower unit costs
- Portfolio optionality: site rationalization
- Stronger balance sheet: supports growth & ESG
Diversified industrial-sand portfolio with 20+ year mines, vertical integration and global scale
Balanced industrial-sand, performance-minerals and proppants mix stabilizes revenue across glass, foundry, building products and filtration; vertical integration ensured cost control and spec consistency pre-2019 Chapter 11 (filed Feb 6, 2019). Tier-1 deposits offer 20+ year mine lives; technical services and R&D drive premium pricing and retention. Merger into SCR-Sibelco leverages 30+ countries and ~5,000 employees.
| Metric | Value |
|---|---|
| Mine life | 20+ years |
| Global reach | 30+ countries |
| Workforce | ~5,000 employees |
| Chapter 11 | Feb 6, 2019 |
What is included in the product
Detailed Word Document
Provides a concise SWOT analysis of Covia, highlighting internal strengths and weaknesses and external opportunities and threats to assess its competitive position and strategic risks.
Customizable Excel Spreadsheet
Provides a concise Covia SWOT matrix to quickly align strategy, highlight remediation priorities, and simplify stakeholder communication for faster decision-making.
Weaknesses
Exposure to energy cyclicality
Frac sand demand closely follows drilling and completion activity; during the 2015–2016 downturn sand shipments declined roughly 60%, illustrating high cyclicality. Downturns can sharply compress volumes and pricing — sand prices dropped by more than 50% in prior cycles. Such volatility complicates capacity planning and strains working capital as customer capex cuts cascade through the supply chain.
Commodity pricing pressure
Sand products face intense price competition from regional mines, limiting markups on bulk grades and keeping gross margins depressed. Spot pricing in oversupplied basins frequently forces sales at or below marginal cost, eroding profitability. Continued discounting to maintain plant utilization risks destroying long-term value and capital returns.
High logistics sensitivity
Freight makes up a material share of delivered cost-to-basin for Covia, leaving margins exposed to logistics swings; rail congestion and fuel surcharges have repeatedly widened cash costs. Truck driver shortages — estimated at roughly 80,000 in recent ATA reports — and rising diesel prices press margins. Distance-to-basin disadvantages versus in-basin miners and weather/port disruptions add further variability.
Environmental and permitting burden
Mine permitting for Covia is lengthy and often faces intense community scrutiny, commonly taking 2–5 years to secure approvals; dust, high water usage and reclamation obligations materially raise operating costs. Non-compliance can trigger fines and operational curtailments, with enforcement actions reaching millions, while legacy sites may carry significant remediation liabilities.
- Permitting delay: 2–5 years
- Cost drivers: dust, water, reclamation
- Enforcement risk: fines, curtailments (millions)
- Legacy liability: remediation obligations
Bankruptcy legacy and reputational drag
Covia filed Chapter 11 in January 2020, signaling prior excessive leverage and exposure to commodity cyclicality; some counterparties continue to demand tighter covenants or collateral. Post-reorganization talent retention and morale have been challenged, and litigation tied to pre-bankruptcy operations has persisted.
- Chapter 11: January 2020
- Counterparties may demand stricter terms/collateral
- Talent retention and morale pressure
- Lingering litigation from past operations
Highly cyclical sand supplier: shipments down ~60%, prices >50%, logistics & permitting risks
Covia is highly cyclical—shipments fell ~60% in 2015–16 and sand prices plunged >50% in past downturns, compressing margins. Intense regional price competition and frequent spot discounts pressure gross margins. Logistics (rail/truck) and driver shortages (~80,000) raise delivered costs. Permitting delays (2–5 yrs), remediation liabilities and Chapter 11 (Jan 2020) weigh on resilience.
| Metric | Value |
|---|---|
| Shipments drop (2015–16) | ~60% |
| Price decline (prior cycles) | >50% |
| Driver shortage (ATA) | ~80,000 |
| Permitting | 2–5 yrs |
| Chapter 11 | Jan 2020 |
Preview Before You Purchase
Covia SWOT Analysis
This is the actual Covia SWOT analysis document you’ll receive upon purchase—no surprises, just professional quality. The preview below is taken directly from the full report you'll get; purchase unlocks the entire, editable version. Buy now to download the complete, structured file.
Original: $10.00
-65%$10.00
$3.50Description
Dive Deeper Into the Company’s Strategic Blueprint
Covia’s SWOT snapshot highlights operational strengths, raw-material exposure risks, and untapped growth drivers in specialty materials. Our full SWOT delivers research-backed strategic insights, financial context, and editable Word/Excel tools. Purchase the complete report to plan, pitch, or invest with confidence.
Strengths
Diversified minerals portfolio
Balanced exposure across industrial sand, performance minerals and energy proppants helps stabilize revenue through cycles; sales to glass, foundry, building products and filtration spread demand risk across multiple end-markets. Product breadth enables cross-selling and tailored blends to customer specs, supporting pricing resilience and management of margin mix.
Vertical integration & scale
Ownership from mining through processing and logistics gave Covia tighter cost control and consistent product specs across silica and frac-sand lines. Its scale—prior to the Feb 6, 2019 Chapter 11 filing—supported throughput efficiencies and stronger rail/truck contracting. Integrated labs and QA improved spec adherence for critical industrial uses, and scale enhanced bargaining power with suppliers and customers.
Large high-quality reserve base
Access to Tier-1 sand and specialty deposits gives Covia multi-decade mine lives (20+ years), underpinning long-term feedstock security. Consistent particle size and high silica purity enable premium industrial uses such as glass and foundry markets, supporting higher realized prices. Secure reserves lower supply risk for key customers and reduce sustaining capex per ton as operations scale.
Technical application know-how
Covia's technical application know-how across glass, foundry, coatings, and proppants creates high switching costs by embedding tailored gradations and surface treatments into customer processes; collaborative R&D links product specs to measurable process outcomes and technical service supports premium pricing and strong customer retention.
- Application support: cross-industry embedding
- Custom gradations: performance differentiation
- R&D tie-ins: product-to-process outcomes
- Technical service: enables premium pricing & retention
Backed by Sibelco platform
Merger into SCR-Sibelco expands Covia’s global reach via Sibelco’s operations in 30+ countries and ~5,000 employees, enhancing distribution and market access. Shared procurement and best-practice platforms lower unit costs and enable portfolio optionality to rationalize overlapping sites. A stronger balance sheet and governance under Sibelco support renewed investment in growth and ESG.
- Global footprint: 30+ countries
- Workforce scale: ~5,000 employees
- Procurement synergies: lower unit costs
- Portfolio optionality: site rationalization
- Stronger balance sheet: supports growth & ESG
Diversified industrial-sand portfolio with 20+ year mines, vertical integration and global scale
Balanced industrial-sand, performance-minerals and proppants mix stabilizes revenue across glass, foundry, building products and filtration; vertical integration ensured cost control and spec consistency pre-2019 Chapter 11 (filed Feb 6, 2019). Tier-1 deposits offer 20+ year mine lives; technical services and R&D drive premium pricing and retention. Merger into SCR-Sibelco leverages 30+ countries and ~5,000 employees.
| Metric | Value |
|---|---|
| Mine life | 20+ years |
| Global reach | 30+ countries |
| Workforce | ~5,000 employees |
| Chapter 11 | Feb 6, 2019 |
What is included in the product
Detailed Word Document
Provides a concise SWOT analysis of Covia, highlighting internal strengths and weaknesses and external opportunities and threats to assess its competitive position and strategic risks.
Customizable Excel Spreadsheet
Provides a concise Covia SWOT matrix to quickly align strategy, highlight remediation priorities, and simplify stakeholder communication for faster decision-making.
Weaknesses
Exposure to energy cyclicality
Frac sand demand closely follows drilling and completion activity; during the 2015–2016 downturn sand shipments declined roughly 60%, illustrating high cyclicality. Downturns can sharply compress volumes and pricing — sand prices dropped by more than 50% in prior cycles. Such volatility complicates capacity planning and strains working capital as customer capex cuts cascade through the supply chain.
Commodity pricing pressure
Sand products face intense price competition from regional mines, limiting markups on bulk grades and keeping gross margins depressed. Spot pricing in oversupplied basins frequently forces sales at or below marginal cost, eroding profitability. Continued discounting to maintain plant utilization risks destroying long-term value and capital returns.
High logistics sensitivity
Freight makes up a material share of delivered cost-to-basin for Covia, leaving margins exposed to logistics swings; rail congestion and fuel surcharges have repeatedly widened cash costs. Truck driver shortages — estimated at roughly 80,000 in recent ATA reports — and rising diesel prices press margins. Distance-to-basin disadvantages versus in-basin miners and weather/port disruptions add further variability.
Environmental and permitting burden
Mine permitting for Covia is lengthy and often faces intense community scrutiny, commonly taking 2–5 years to secure approvals; dust, high water usage and reclamation obligations materially raise operating costs. Non-compliance can trigger fines and operational curtailments, with enforcement actions reaching millions, while legacy sites may carry significant remediation liabilities.
- Permitting delay: 2–5 years
- Cost drivers: dust, water, reclamation
- Enforcement risk: fines, curtailments (millions)
- Legacy liability: remediation obligations
Bankruptcy legacy and reputational drag
Covia filed Chapter 11 in January 2020, signaling prior excessive leverage and exposure to commodity cyclicality; some counterparties continue to demand tighter covenants or collateral. Post-reorganization talent retention and morale have been challenged, and litigation tied to pre-bankruptcy operations has persisted.
- Chapter 11: January 2020
- Counterparties may demand stricter terms/collateral
- Talent retention and morale pressure
- Lingering litigation from past operations
Highly cyclical sand supplier: shipments down ~60%, prices >50%, logistics & permitting risks
Covia is highly cyclical—shipments fell ~60% in 2015–16 and sand prices plunged >50% in past downturns, compressing margins. Intense regional price competition and frequent spot discounts pressure gross margins. Logistics (rail/truck) and driver shortages (~80,000) raise delivered costs. Permitting delays (2–5 yrs), remediation liabilities and Chapter 11 (Jan 2020) weigh on resilience.
| Metric | Value |
|---|---|
| Shipments drop (2015–16) | ~60% |
| Price decline (prior cycles) | >50% |
| Driver shortage (ATA) | ~80,000 |
| Permitting | 2–5 yrs |
| Chapter 11 | Jan 2020 |
Preview Before You Purchase
Covia SWOT Analysis
This is the actual Covia SWOT analysis document you’ll receive upon purchase—no surprises, just professional quality. The preview below is taken directly from the full report you'll get; purchase unlocks the entire, editable version. Buy now to download the complete, structured file.











