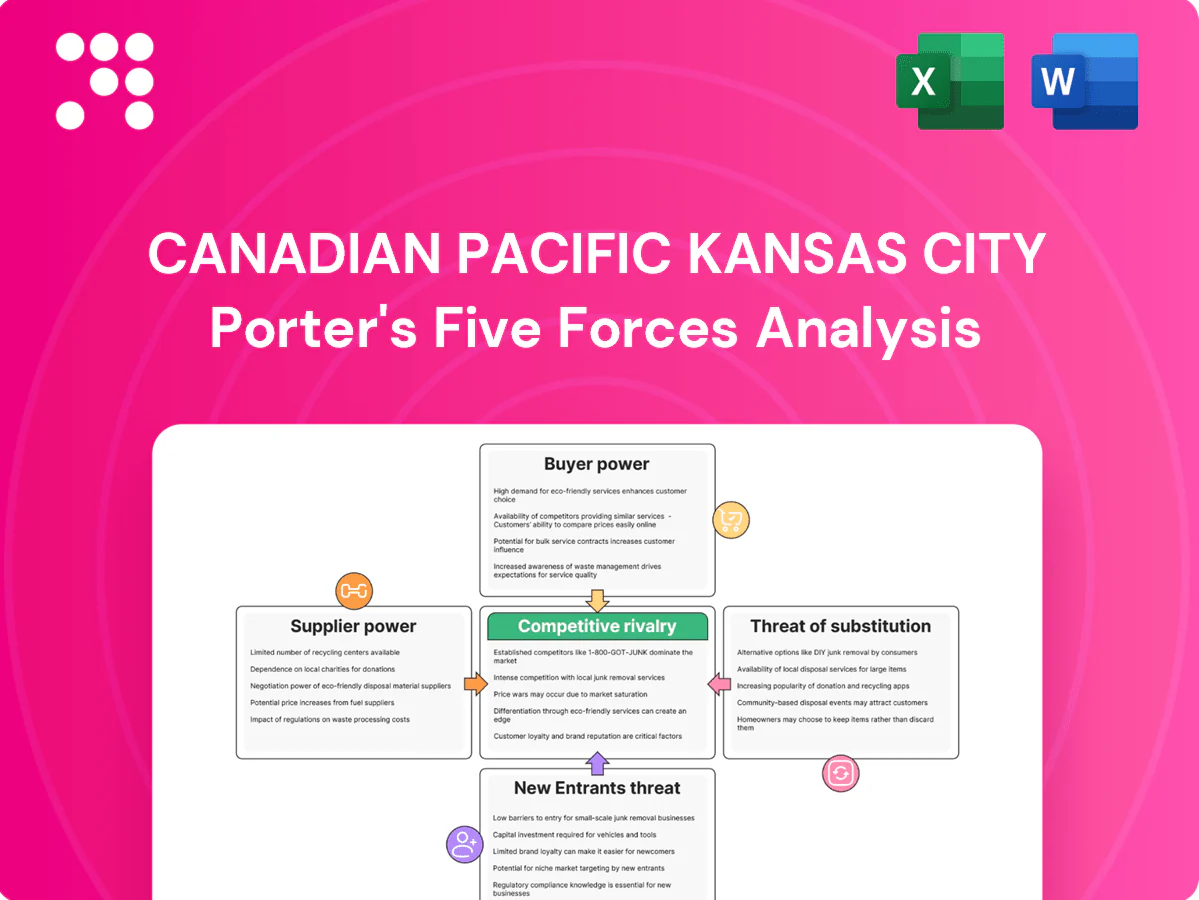
Canadian Pacific Kansas City Porter's Five Forces Analysis

Don't Miss the Bigger Picture
Canadian Pacific Kansas City faces moderate buyer power, high capital barriers for new entrants, and sector-specific supplier leverage that shapes freight margins and network expansion choices. Competitive rivalry is intense across rail and intermodal routes, while substitutes and regulation add strategic risk. This snapshot highlights key pressures but only scratches the surface—unlock the full Porter's Five Forces Analysis for force-by-force ratings, visuals, and actionable strategy guidance.
Suppliers Bargaining Power

Concentrated locomotive and railcar OEMs
Locomotive and critical component markets in North America are dominated by two OEMs, Wabtec and Progress Rail (Caterpillar), concentrating supplier bargaining power. Limited qualified alternatives for Tier-4 locomotives, PTC equipment, and advanced control systems constrain switching and increase dependence. Long lead times of roughly 12–24 months and bespoke specifications lock in relationships, raising pricing and delivery risk. CPKC mitigates this through multi-year procurement, refurbishment programs, and fleet standardization.
Fuel suppliers and price volatility
Diesel is a material input for CPKC, historically representing roughly 15% of Class I rail operating costs, and its price is tied to global crude/diesel markets which swung about ±30% between 2022–2024, giving suppliers indirect pricing power through volatility. Hedging programs and fuel surcharges pass through portions of cost but timing mismatches create margin risk when spot moves faster than recoveries. Regional supply disruptions have affected US‑Mexico and Canada cross‑border corridors, and scale buying plus multi‑sourcing dampen but do not eliminate exposure.

Track materials and maintenance vendors
Rail ties, ballast, and maintenance-of-way equipment for CPKC's roughly 20,000-mile network depend on specialized suppliers with safety certifications, concentrating supplier bargaining power. Steel and treated-wood supply constraints in 2024 elevated input costs, pressuring margins amid CPKC's ~$2.3B capital program. Multi-year framework agreements and planned capital cycles lower supply risk but reduce procurement flexibility, while vendor performance directly impacts on-time metrics and safety results.

Labor unions and skilled workforce
Train crews, mechanical, and maintenance staff at CPKC are largely unionized across Canada, the U.S. and Mexico, shaping wages, benefits and work rules; tight 2024 labor markets for certified engineers and technicians have raised supplier-like power and hiring difficulty. Work stoppages or slowdowns can disrupt service and erode customer trust, while productivity technologies and expanded training pipelines partially offset this leverage.
- Union coverage: pervasive across North America
- 2024: tighter certified-engineer market, higher retention costs
- Service risk: stoppages slow shipments, hit revenue
- Mitigation: tech + training reduce but do not eliminate leverage
Technology, signaling, and data platforms
PTC deployment (mandated in the U.S. since 2015), dispatch, telematics and cybersecurity depend on niche vendors with high switching costs from deep integration and safety approvals; software licensing and upgrades create recurring vendor dependence. Cross-border interoperability across Canada, the U.S. and Mexico (post-CPKC merger completed April 14, 2023) increases complexity, so CPKC uses modular architectures and in-house teams to preserve negotiating leverage.
Supplier concentration, lead times and unions amplify diesel 15% cost risk
Supplier power for CPKC is concentrated: two OEMs dominate locomotives (12–24 month lead times) and specialized MOW/PTC vendors limit switching; 20,000‑mile network and ~$2.3B 2024 capex raise input dependency. Diesel ~15% of Class I operating costs and crude/diesel swung ~±30% (2022–2024), creating volatility despite hedges and surcharges. Unionized labor across NA tightened in 2024, raising retention costs and service disruption risk.
| Metric | 2024 value |
|---|---|
| Diesel share | ~15% |
| Diesel volatility 2022–24 | ±30% |
| Network length | ~20,000 mi |
| Capex | ~$2.3B |
What is included in the product
 Detailed Word Document
Uncovers key drivers of competition, customer influence, and market entry risks tailored to Canadian Pacific Kansas City, detailing supplier and buyer power, rivalry intensity, substitutes, and entry barriers while highlighting disruptive threats and strategic levers to protect and expand market share.

 Customizable Excel Spreadsheet
A clear, one-sheet summary of all five forces—perfect for quick decision-making on Canadian Pacific Kansas City's strategic risks, competitive pressures and opportunity hotspots.
Customers Bargaining Power

Large volume shippers and 3PLs
Grain majors, energy/chemical producers, automotive OEMs and global 3PLs aggregate volumes that drive multi-year contracts, commonly 3–5 year rate agreements and corridor-specific bid events that capture majority of shipper flows. They demand service KPIs and incentive pricing tied to dwell, on-time performance and velocity. CPKC’s single-line Canada–U.S.–Mexico reach gives counter-leverage where alternatives require interchanges, reducing handoff costs and transit time variability.
Intermodal and ocean carrier partners
Ocean carriers and BCOs, with the top 10 carriers controlling roughly 90% of global container capacity in 2024, can reallocate boxes among ports, rail, and truck, heightening price sensitivity. Contract terms increasingly hinge on reliability metrics, terminal dwell and velocity. Port diversification and alliance routing limit shipper lock-in. CPKC’s end-to-end north–south corridors and inland port access create stickiness on targeted lanes.

Modal substitution options
Buyers often compare rail economics to trucking, barge, or pipelines, strengthening bargaining on time-sensitive or shorter-haul lanes; trucking moves about 70% of US freight by tonnage (BTS).
Where truck capacity is loose, shippers exert pronounced rate pressure on rail, particularly for short hauls and spot moves.
On dense long-hauls rail’s cost and fuel-efficiency advantages curb buyer power, and CPKC’s single-line cross-border service after the 2023 merger reduces interchange risk, raising its attractiveness.

Regulatory recourse and service oversight
Shippers can appeal service and access complaints to the U.S. Surface Transportation Board and Canada Transportation Agency, limiting CPKC pricing power; proposed reciprocal switching rules in 2024 heightened negotiating leverage, while formal dispute processes impose strict deadlines and documentation burdens; CPKC’s published service metrics across its ~20,000‑mile network aim to preempt escalations.
- Regulatory recourse: STB, CTA
- Policy risk: reciprocal switching 2024
- Operational burden: dispute deadlines/docs
- Mitigation: CPKC service/compliance metrics
Demand cyclicality and contract structures
Commodity cycles and inventory swings shift bargaining power over time, pushing buyers to press for flexible contract terms during soft markets and tighter commitments in booms.
Take-or-pay, fuel surcharge formulas and index-linked clauses allocate risk but are heavily negotiated by shippers seeking cost predictability.
CPKC’s diversified commodity mix and performance-based rebates smooth volatility and align incentives, though rebates compress margins when service falls short.
- Demand cyclicality: buyers push flexibility in downturns
- Contract tools: take-or-pay, fuel/ index clauses balance risk
- Diversification: reduces CPKC revenue volatility
- Rebates: align service but tighten margins on underperformance
Carriers 90%, trucking 70% boost shippers bargaining
Large shippers and ocean carriers exert strong leverage via multi-year (3–5yr) contracts and port/route options; top 10 carriers held ~90% of container capacity in 2024. Trucking moves ~70% of US freight by tonnage, amplifying short-haul buyer power; CPKC’s ~20,000‑mile single‑line network and cross‑border reach limit interchange risk. 2024 reciprocal‑switching proposals increased shipper negotiating leverage.
| Metric | Value (2024) |
|---|---|
| Top 10 ocean carriers market share | ~90% |
| US trucking modal share (tonnage) | ~70% |
| CPKC network size | ~20,000 miles |
| Typical shipper contract length | 3–5 years |
Preview Before You Purchase
Canadian Pacific Kansas City Porter's Five Forces Analysis
This preview shows the exact Porter's Five Forces analysis of Canadian Pacific Kansas City you'll receive immediately after purchase—no surprises or placeholders. The document covers competitive rivalry, supplier and buyer power, threat of new entrants and substitutes, plus strategic implications for CPKC. It's fully formatted and ready for instant download and use.

Don't Miss the Bigger Picture
Canadian Pacific Kansas City faces moderate buyer power, high capital barriers for new entrants, and sector-specific supplier leverage that shapes freight margins and network expansion choices. Competitive rivalry is intense across rail and intermodal routes, while substitutes and regulation add strategic risk. This snapshot highlights key pressures but only scratches the surface—unlock the full Porter's Five Forces Analysis for force-by-force ratings, visuals, and actionable strategy guidance.
Suppliers Bargaining Power
Concentrated locomotive and railcar OEMs
Locomotive and critical component markets in North America are dominated by two OEMs, Wabtec and Progress Rail (Caterpillar), concentrating supplier bargaining power. Limited qualified alternatives for Tier-4 locomotives, PTC equipment, and advanced control systems constrain switching and increase dependence. Long lead times of roughly 12–24 months and bespoke specifications lock in relationships, raising pricing and delivery risk. CPKC mitigates this through multi-year procurement, refurbishment programs, and fleet standardization.
Fuel suppliers and price volatility
Diesel is a material input for CPKC, historically representing roughly 15% of Class I rail operating costs, and its price is tied to global crude/diesel markets which swung about ±30% between 2022–2024, giving suppliers indirect pricing power through volatility. Hedging programs and fuel surcharges pass through portions of cost but timing mismatches create margin risk when spot moves faster than recoveries. Regional supply disruptions have affected US‑Mexico and Canada cross‑border corridors, and scale buying plus multi‑sourcing dampen but do not eliminate exposure.
Track materials and maintenance vendors
Rail ties, ballast, and maintenance-of-way equipment for CPKC's roughly 20,000-mile network depend on specialized suppliers with safety certifications, concentrating supplier bargaining power. Steel and treated-wood supply constraints in 2024 elevated input costs, pressuring margins amid CPKC's ~$2.3B capital program. Multi-year framework agreements and planned capital cycles lower supply risk but reduce procurement flexibility, while vendor performance directly impacts on-time metrics and safety results.
Labor unions and skilled workforce
Train crews, mechanical, and maintenance staff at CPKC are largely unionized across Canada, the U.S. and Mexico, shaping wages, benefits and work rules; tight 2024 labor markets for certified engineers and technicians have raised supplier-like power and hiring difficulty. Work stoppages or slowdowns can disrupt service and erode customer trust, while productivity technologies and expanded training pipelines partially offset this leverage.
- Union coverage: pervasive across North America
- 2024: tighter certified-engineer market, higher retention costs
- Service risk: stoppages slow shipments, hit revenue
- Mitigation: tech + training reduce but do not eliminate leverage
Technology, signaling, and data platforms
PTC deployment (mandated in the U.S. since 2015), dispatch, telematics and cybersecurity depend on niche vendors with high switching costs from deep integration and safety approvals; software licensing and upgrades create recurring vendor dependence. Cross-border interoperability across Canada, the U.S. and Mexico (post-CPKC merger completed April 14, 2023) increases complexity, so CPKC uses modular architectures and in-house teams to preserve negotiating leverage.
Supplier concentration, lead times and unions amplify diesel 15% cost risk
Supplier power for CPKC is concentrated: two OEMs dominate locomotives (12–24 month lead times) and specialized MOW/PTC vendors limit switching; 20,000‑mile network and ~$2.3B 2024 capex raise input dependency. Diesel ~15% of Class I operating costs and crude/diesel swung ~±30% (2022–2024), creating volatility despite hedges and surcharges. Unionized labor across NA tightened in 2024, raising retention costs and service disruption risk.
| Metric | 2024 value |
|---|---|
| Diesel share | ~15% |
| Diesel volatility 2022–24 | ±30% |
| Network length | ~20,000 mi |
| Capex | ~$2.3B |
What is included in the product
Detailed Word Document
Uncovers key drivers of competition, customer influence, and market entry risks tailored to Canadian Pacific Kansas City, detailing supplier and buyer power, rivalry intensity, substitutes, and entry barriers while highlighting disruptive threats and strategic levers to protect and expand market share.
Customizable Excel Spreadsheet
A clear, one-sheet summary of all five forces—perfect for quick decision-making on Canadian Pacific Kansas City's strategic risks, competitive pressures and opportunity hotspots.
Customers Bargaining Power
Large volume shippers and 3PLs
Grain majors, energy/chemical producers, automotive OEMs and global 3PLs aggregate volumes that drive multi-year contracts, commonly 3–5 year rate agreements and corridor-specific bid events that capture majority of shipper flows. They demand service KPIs and incentive pricing tied to dwell, on-time performance and velocity. CPKC’s single-line Canada–U.S.–Mexico reach gives counter-leverage where alternatives require interchanges, reducing handoff costs and transit time variability.
Intermodal and ocean carrier partners
Ocean carriers and BCOs, with the top 10 carriers controlling roughly 90% of global container capacity in 2024, can reallocate boxes among ports, rail, and truck, heightening price sensitivity. Contract terms increasingly hinge on reliability metrics, terminal dwell and velocity. Port diversification and alliance routing limit shipper lock-in. CPKC’s end-to-end north–south corridors and inland port access create stickiness on targeted lanes.
Modal substitution options
Buyers often compare rail economics to trucking, barge, or pipelines, strengthening bargaining on time-sensitive or shorter-haul lanes; trucking moves about 70% of US freight by tonnage (BTS).
Where truck capacity is loose, shippers exert pronounced rate pressure on rail, particularly for short hauls and spot moves.
On dense long-hauls rail’s cost and fuel-efficiency advantages curb buyer power, and CPKC’s single-line cross-border service after the 2023 merger reduces interchange risk, raising its attractiveness.
Regulatory recourse and service oversight
Shippers can appeal service and access complaints to the U.S. Surface Transportation Board and Canada Transportation Agency, limiting CPKC pricing power; proposed reciprocal switching rules in 2024 heightened negotiating leverage, while formal dispute processes impose strict deadlines and documentation burdens; CPKC’s published service metrics across its ~20,000‑mile network aim to preempt escalations.
- Regulatory recourse: STB, CTA
- Policy risk: reciprocal switching 2024
- Operational burden: dispute deadlines/docs
- Mitigation: CPKC service/compliance metrics
Demand cyclicality and contract structures
Commodity cycles and inventory swings shift bargaining power over time, pushing buyers to press for flexible contract terms during soft markets and tighter commitments in booms.
Take-or-pay, fuel surcharge formulas and index-linked clauses allocate risk but are heavily negotiated by shippers seeking cost predictability.
CPKC’s diversified commodity mix and performance-based rebates smooth volatility and align incentives, though rebates compress margins when service falls short.
- Demand cyclicality: buyers push flexibility in downturns
- Contract tools: take-or-pay, fuel/ index clauses balance risk
- Diversification: reduces CPKC revenue volatility
- Rebates: align service but tighten margins on underperformance
Carriers 90%, trucking 70% boost shippers bargaining
Large shippers and ocean carriers exert strong leverage via multi-year (3–5yr) contracts and port/route options; top 10 carriers held ~90% of container capacity in 2024. Trucking moves ~70% of US freight by tonnage, amplifying short-haul buyer power; CPKC’s ~20,000‑mile single‑line network and cross‑border reach limit interchange risk. 2024 reciprocal‑switching proposals increased shipper negotiating leverage.
| Metric | Value (2024) |
|---|---|
| Top 10 ocean carriers market share | ~90% |
| US trucking modal share (tonnage) | ~70% |
| CPKC network size | ~20,000 miles |
| Typical shipper contract length | 3–5 years |
Preview Before You Purchase
Canadian Pacific Kansas City Porter's Five Forces Analysis
This preview shows the exact Porter's Five Forces analysis of Canadian Pacific Kansas City you'll receive immediately after purchase—no surprises or placeholders. The document covers competitive rivalry, supplier and buyer power, threat of new entrants and substitutes, plus strategic implications for CPKC. It's fully formatted and ready for instant download and use.
Original: $10.00
-65%$10.00
$3.50Description
Don't Miss the Bigger Picture
Canadian Pacific Kansas City faces moderate buyer power, high capital barriers for new entrants, and sector-specific supplier leverage that shapes freight margins and network expansion choices. Competitive rivalry is intense across rail and intermodal routes, while substitutes and regulation add strategic risk. This snapshot highlights key pressures but only scratches the surface—unlock the full Porter's Five Forces Analysis for force-by-force ratings, visuals, and actionable strategy guidance.
Suppliers Bargaining Power
Concentrated locomotive and railcar OEMs
Locomotive and critical component markets in North America are dominated by two OEMs, Wabtec and Progress Rail (Caterpillar), concentrating supplier bargaining power. Limited qualified alternatives for Tier-4 locomotives, PTC equipment, and advanced control systems constrain switching and increase dependence. Long lead times of roughly 12–24 months and bespoke specifications lock in relationships, raising pricing and delivery risk. CPKC mitigates this through multi-year procurement, refurbishment programs, and fleet standardization.
Fuel suppliers and price volatility
Diesel is a material input for CPKC, historically representing roughly 15% of Class I rail operating costs, and its price is tied to global crude/diesel markets which swung about ±30% between 2022–2024, giving suppliers indirect pricing power through volatility. Hedging programs and fuel surcharges pass through portions of cost but timing mismatches create margin risk when spot moves faster than recoveries. Regional supply disruptions have affected US‑Mexico and Canada cross‑border corridors, and scale buying plus multi‑sourcing dampen but do not eliminate exposure.
Track materials and maintenance vendors
Rail ties, ballast, and maintenance-of-way equipment for CPKC's roughly 20,000-mile network depend on specialized suppliers with safety certifications, concentrating supplier bargaining power. Steel and treated-wood supply constraints in 2024 elevated input costs, pressuring margins amid CPKC's ~$2.3B capital program. Multi-year framework agreements and planned capital cycles lower supply risk but reduce procurement flexibility, while vendor performance directly impacts on-time metrics and safety results.
Labor unions and skilled workforce
Train crews, mechanical, and maintenance staff at CPKC are largely unionized across Canada, the U.S. and Mexico, shaping wages, benefits and work rules; tight 2024 labor markets for certified engineers and technicians have raised supplier-like power and hiring difficulty. Work stoppages or slowdowns can disrupt service and erode customer trust, while productivity technologies and expanded training pipelines partially offset this leverage.
- Union coverage: pervasive across North America
- 2024: tighter certified-engineer market, higher retention costs
- Service risk: stoppages slow shipments, hit revenue
- Mitigation: tech + training reduce but do not eliminate leverage
Technology, signaling, and data platforms
PTC deployment (mandated in the U.S. since 2015), dispatch, telematics and cybersecurity depend on niche vendors with high switching costs from deep integration and safety approvals; software licensing and upgrades create recurring vendor dependence. Cross-border interoperability across Canada, the U.S. and Mexico (post-CPKC merger completed April 14, 2023) increases complexity, so CPKC uses modular architectures and in-house teams to preserve negotiating leverage.
Supplier concentration, lead times and unions amplify diesel 15% cost risk
Supplier power for CPKC is concentrated: two OEMs dominate locomotives (12–24 month lead times) and specialized MOW/PTC vendors limit switching; 20,000‑mile network and ~$2.3B 2024 capex raise input dependency. Diesel ~15% of Class I operating costs and crude/diesel swung ~±30% (2022–2024), creating volatility despite hedges and surcharges. Unionized labor across NA tightened in 2024, raising retention costs and service disruption risk.
| Metric | 2024 value |
|---|---|
| Diesel share | ~15% |
| Diesel volatility 2022–24 | ±30% |
| Network length | ~20,000 mi |
| Capex | ~$2.3B |
What is included in the product
Detailed Word Document
Uncovers key drivers of competition, customer influence, and market entry risks tailored to Canadian Pacific Kansas City, detailing supplier and buyer power, rivalry intensity, substitutes, and entry barriers while highlighting disruptive threats and strategic levers to protect and expand market share.
Customizable Excel Spreadsheet
A clear, one-sheet summary of all five forces—perfect for quick decision-making on Canadian Pacific Kansas City's strategic risks, competitive pressures and opportunity hotspots.
Customers Bargaining Power
Large volume shippers and 3PLs
Grain majors, energy/chemical producers, automotive OEMs and global 3PLs aggregate volumes that drive multi-year contracts, commonly 3–5 year rate agreements and corridor-specific bid events that capture majority of shipper flows. They demand service KPIs and incentive pricing tied to dwell, on-time performance and velocity. CPKC’s single-line Canada–U.S.–Mexico reach gives counter-leverage where alternatives require interchanges, reducing handoff costs and transit time variability.
Intermodal and ocean carrier partners
Ocean carriers and BCOs, with the top 10 carriers controlling roughly 90% of global container capacity in 2024, can reallocate boxes among ports, rail, and truck, heightening price sensitivity. Contract terms increasingly hinge on reliability metrics, terminal dwell and velocity. Port diversification and alliance routing limit shipper lock-in. CPKC’s end-to-end north–south corridors and inland port access create stickiness on targeted lanes.
Modal substitution options
Buyers often compare rail economics to trucking, barge, or pipelines, strengthening bargaining on time-sensitive or shorter-haul lanes; trucking moves about 70% of US freight by tonnage (BTS).
Where truck capacity is loose, shippers exert pronounced rate pressure on rail, particularly for short hauls and spot moves.
On dense long-hauls rail’s cost and fuel-efficiency advantages curb buyer power, and CPKC’s single-line cross-border service after the 2023 merger reduces interchange risk, raising its attractiveness.
Regulatory recourse and service oversight
Shippers can appeal service and access complaints to the U.S. Surface Transportation Board and Canada Transportation Agency, limiting CPKC pricing power; proposed reciprocal switching rules in 2024 heightened negotiating leverage, while formal dispute processes impose strict deadlines and documentation burdens; CPKC’s published service metrics across its ~20,000‑mile network aim to preempt escalations.
- Regulatory recourse: STB, CTA
- Policy risk: reciprocal switching 2024
- Operational burden: dispute deadlines/docs
- Mitigation: CPKC service/compliance metrics
Demand cyclicality and contract structures
Commodity cycles and inventory swings shift bargaining power over time, pushing buyers to press for flexible contract terms during soft markets and tighter commitments in booms.
Take-or-pay, fuel surcharge formulas and index-linked clauses allocate risk but are heavily negotiated by shippers seeking cost predictability.
CPKC’s diversified commodity mix and performance-based rebates smooth volatility and align incentives, though rebates compress margins when service falls short.
- Demand cyclicality: buyers push flexibility in downturns
- Contract tools: take-or-pay, fuel/ index clauses balance risk
- Diversification: reduces CPKC revenue volatility
- Rebates: align service but tighten margins on underperformance
Carriers 90%, trucking 70% boost shippers bargaining
Large shippers and ocean carriers exert strong leverage via multi-year (3–5yr) contracts and port/route options; top 10 carriers held ~90% of container capacity in 2024. Trucking moves ~70% of US freight by tonnage, amplifying short-haul buyer power; CPKC’s ~20,000‑mile single‑line network and cross‑border reach limit interchange risk. 2024 reciprocal‑switching proposals increased shipper negotiating leverage.
| Metric | Value (2024) |
|---|---|
| Top 10 ocean carriers market share | ~90% |
| US trucking modal share (tonnage) | ~70% |
| CPKC network size | ~20,000 miles |
| Typical shipper contract length | 3–5 years |
Preview Before You Purchase
Canadian Pacific Kansas City Porter's Five Forces Analysis
This preview shows the exact Porter's Five Forces analysis of Canadian Pacific Kansas City you'll receive immediately after purchase—no surprises or placeholders. The document covers competitive rivalry, supplier and buyer power, threat of new entrants and substitutes, plus strategic implications for CPKC. It's fully formatted and ready for instant download and use.











