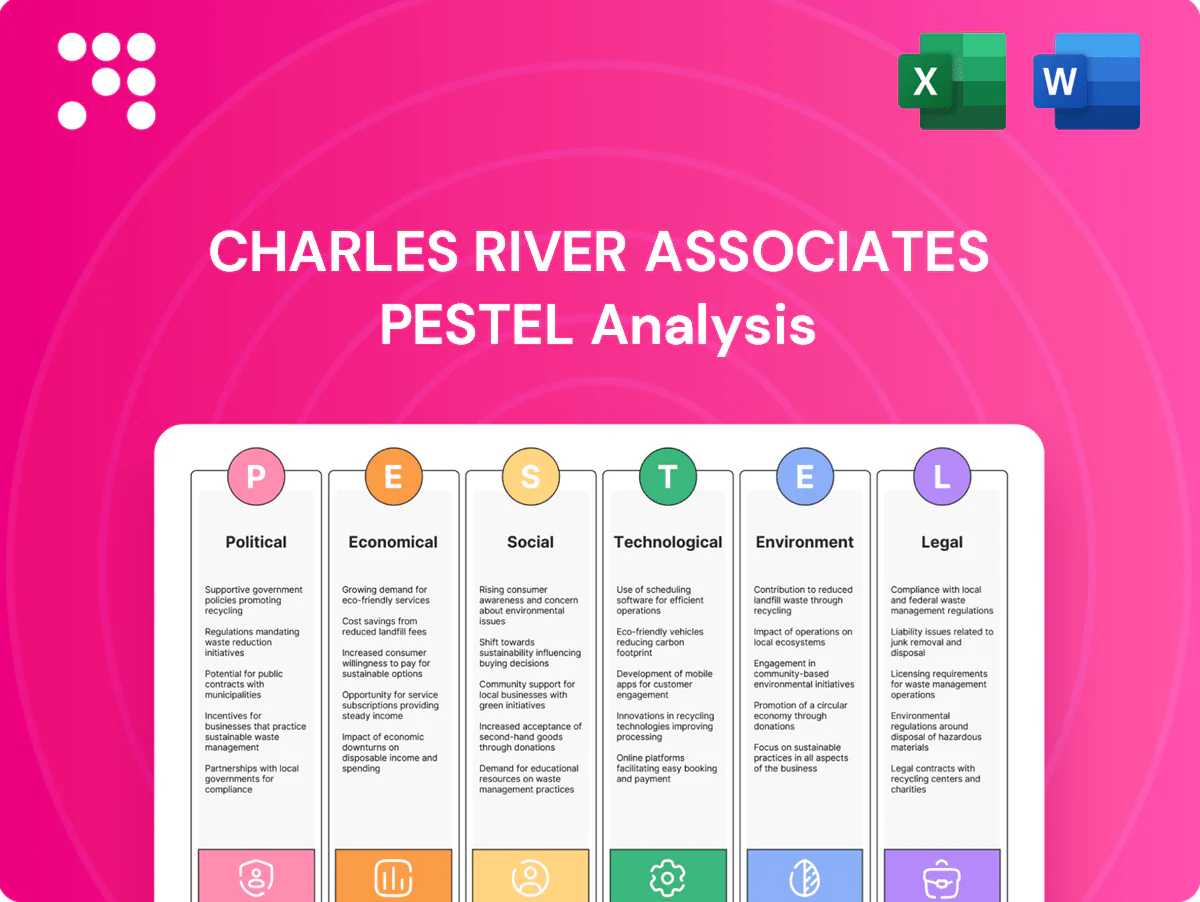
Charles River Associates PESTLE Analysis

Your Competitive Advantage Starts with This Report
Gain a competitive edge with our PESTLE analysis of Charles River Associates—concise, timely insight into political, economic, social, technological, legal and environmental forces shaping its strategy. Use these findings to anticipate regulatory risks, spot growth opportunities, and sharpen investment or advisory cases. Purchase the full, editable report for the complete data and actionable recommendations.
Political factors

Geopolitical volatility
Shifts in trade policy, sanctions, and conflicts boost demand for CRA advisory on supply chains, market entry, and risk, with cross-border engagements rising notably after major events; CRA reported fiscal 2024 revenue of about $573 million, reflecting heightened activity. Execution risk and project delays increase as access and data become constrained. Scenario planning and country-risk models become core differentiators while government work surges but brings procurement and reputational complexity.
Public sector spending
Government budgets for regulatory analysis, infrastructure and policy evaluation—driven by laws such as the $1.2 trillion Bipartisan Infrastructure Law and US federal discretionary spending near $1.7 trillion—directly affect CRA’s consulting pipeline. Election cycles (eg 2024) can pause or accelerate projects, so CRA emphasizes countercyclical services in compliance and policy design. Long-term framework agreements help stabilize utilization despite short-term swings.

Industrial policy
US CHIPS Act includes roughly 52 billion USD for semiconductors, while the Inflation Reduction Act commits about 369 billion USD to clean-energy incentives and the EU Chips Act targets around 43 billion EUR, driving competition and demand for subsidy-impact analysis. Clients require economic-impact assessments and state-aid/antitrust expertise to navigate grant competitions and incentive structures. CRA advises on incentive design and provides litigation support as policy reversals spawn follow-on disputes.

Regulatory harmonization
Divergent standards across the US, EU and APAC—eg EU DMA/DSA in force since 2022 and China PIPL since 2021 while the US still lacks a federal privacy law—drive demand for comparative regulatory analysis; CRA’s multi‑jurisdiction teams decode differences across digital markets, data, energy and life sciences. Harmonization waves can cut cross‑border compliance costs but create transitional uncertainty; multilingual regional experts are a competitive edge.
- EU DMA/DSA: 2022 onward
- China PIPL: effective 2021
- US: no federal privacy law as of 2025
- CRA strength: regional, multilingual teams
Government procurement rules
Government procurement rules—strict bidding, ethics, localization and transparency mandates—compress win rates and margins on public work and require security clearances and conflict checks that raise delivery overhead. Investing in compliant delivery models and local partnerships preserves access to sensitive mandates; note US defense spending was about 858 billion USD in FY2024, underscoring the scale of opportunity and scrutiny.
- Strict bidding & localization: higher compliance costs
- Security clearances & conflict checks: added overhead
- Compliance investments: preserve access to classified mandates
- Local partnerships: meet in-country requirements
Geopolitics, sanctions & divergent regs fuel CRA demand; FY2024 rev $573M
Geopolitical shifts, trade policy and sanctions drive demand for CRA advisory—FY2024 revenue ~$573M—while conflicts raise execution risk and data constraints. Major laws and budgets (Bipartisan Infrastructure $1.2T, US discretionary ~$1.7T) and election cycles (2024) affect pipelines. Divergent regs (EU DMA/DSA, China PIPL; US no federal privacy law as of 2025) boost multi‑jurisdiction work.
| Item | Value |
|---|---|
| CRA FY2024 rev | $573M |
| US defense FY2024 | $858B |
| IRA | $369B |
What is included in the product
 Detailed Word Document
Explores how Political, Economic, Social, Technological, Environmental and Legal forces uniquely affect Charles River Associates, with data-driven, forward-looking insights and multiple sub-points per category; designed to help executives, consultants and investors identify risks, opportunities and scenario strategies.

 Customizable Excel Spreadsheet
A concise, visually segmented Charles River Associates PESTLE summary that’s editable and shareable for meetings, enabling quick alignment across teams, focused external risk discussion, and easy insertion into presentations or client reports.
Economic factors

Macro cycles
Macro cycles drive demand shifts: recessions historically increase restructuring, disputes and damages work while expansions lift growth strategy and M&A advisory; IMF estimated global growth slowed to about 3.2% in 2024 and US unemployment averaged near 3.7%, factors that affect deal flow. CRA’s diversified practice mix and flexible staffing smooth utilization and protect margins, though pricing power ebbing with client budget pressure can compress rates.
Interest rates
Higher interest rates (US fed funds 5.25–5.50% mid‑2025, 10‑yr ~4.1%) have damped deal flow yet increased valuation disputes and solvency analyses. Shifts in discount rates and cost of capital materially alter DCF inputs used in expert testimony. CRA can monetize thought leadership on WACC and fair value; rate volatility boosts demand for risk and treasury advisory.

Sector exposure
Energy, life sciences, and financial services cycles directly drive CRA project volume, with regulated life sciences and finance work providing steadier demand during downturns; CRA reported roughly $600m in 2024 revenue, underscoring sector concentration. Regulatory-heavy sectors generate resilient economics and compliance mandates. CRA can rebalance toward countercyclical units like forensics or competition economics to stabilize revenue. Sector playbooks deepen repeat-client relationships.

Labor market dynamics
Tight labor markets are driving up compensation and retention risk for PhDs and seasoned experts; US unemployment ~3.7% mid‑2025 and average hourly earnings rose ~4.2% YoY (June 2025), pressuring margins. Utilization, pricing and leverage models must offset wage inflation while nearshore and hybrid delivery expand talent pools and capacity. Strong expert‑branding secures marquee matters at premium rates, supporting higher realizations.
- Compensation risk: PhD/senior talent shortages
- Wage inflation: avg hourly earnings +4.2% YoY (Jun 2025)
- Mitigants: utilization, pricing, leverage, nearshore/hybrid
- Revenue premium: expert‑brand drives higher rates and marquee work
Currency movements
Currency movements create material FX exposure for Charles River Associates as multi-currency revenues and local cost bases mean large cross-border engagements can swing reported quarterly results; 2024 saw elevated FX volatility that amplified this effect. Natural hedging through local staffing and billing mitigates translation risk while transparent FX policies and periodic hedging reassure investors and clients.
- FX exposure: multi-currency revenue vs local costs
- Impact: large cross-border cases can materially affect reported results
- Mitigation: natural hedging via local staffing/billing
- Governance: clear FX policy and disclosure reassure stakeholders
Geopolitics, sanctions & divergent regs fuel CRA demand; FY2024 rev $573M
Macro cycles, higher rates and sector rotations shape CRA demand: 2024 revenue ~$600m, IMF global growth ~3.2% (2024), US unemployment ~3.7% mid‑2025; Fed funds 5.25–5.50% and 10‑yr ~4.1% raise disputes and DCF work while wage inflation (+4.2% YoY Jun‑2025) pressures margins; FX volatility amplifies reported results.
| Metric | Value |
|---|---|
| 2024 Revenue | $600m |
| Global GDP (2024) | ~3.2% |
| US Unemployment | 3.7% (mid‑2025) |
| Fed funds | 5.25–5.50% (mid‑2025) |
| Avg hourly earnings | +4.2% YoY (Jun‑2025) |
| 10‑yr | ~4.1% |
Same Document Delivered
Charles River Associates PESTLE Analysis
The Charles River Associates PESTLE Analysis preview shown here is the exact document you’ll receive after purchase—fully formatted and ready to use. The content, layout, and professional structure visible are identical to the downloadable file. No placeholders or teasers, just the finished analysis.

Your Competitive Advantage Starts with This Report
Gain a competitive edge with our PESTLE analysis of Charles River Associates—concise, timely insight into political, economic, social, technological, legal and environmental forces shaping its strategy. Use these findings to anticipate regulatory risks, spot growth opportunities, and sharpen investment or advisory cases. Purchase the full, editable report for the complete data and actionable recommendations.
Political factors
Geopolitical volatility
Shifts in trade policy, sanctions, and conflicts boost demand for CRA advisory on supply chains, market entry, and risk, with cross-border engagements rising notably after major events; CRA reported fiscal 2024 revenue of about $573 million, reflecting heightened activity. Execution risk and project delays increase as access and data become constrained. Scenario planning and country-risk models become core differentiators while government work surges but brings procurement and reputational complexity.
Public sector spending
Government budgets for regulatory analysis, infrastructure and policy evaluation—driven by laws such as the $1.2 trillion Bipartisan Infrastructure Law and US federal discretionary spending near $1.7 trillion—directly affect CRA’s consulting pipeline. Election cycles (eg 2024) can pause or accelerate projects, so CRA emphasizes countercyclical services in compliance and policy design. Long-term framework agreements help stabilize utilization despite short-term swings.
Industrial policy
US CHIPS Act includes roughly 52 billion USD for semiconductors, while the Inflation Reduction Act commits about 369 billion USD to clean-energy incentives and the EU Chips Act targets around 43 billion EUR, driving competition and demand for subsidy-impact analysis. Clients require economic-impact assessments and state-aid/antitrust expertise to navigate grant competitions and incentive structures. CRA advises on incentive design and provides litigation support as policy reversals spawn follow-on disputes.
Regulatory harmonization
Divergent standards across the US, EU and APAC—eg EU DMA/DSA in force since 2022 and China PIPL since 2021 while the US still lacks a federal privacy law—drive demand for comparative regulatory analysis; CRA’s multi‑jurisdiction teams decode differences across digital markets, data, energy and life sciences. Harmonization waves can cut cross‑border compliance costs but create transitional uncertainty; multilingual regional experts are a competitive edge.
- EU DMA/DSA: 2022 onward
- China PIPL: effective 2021
- US: no federal privacy law as of 2025
- CRA strength: regional, multilingual teams
Government procurement rules
Government procurement rules—strict bidding, ethics, localization and transparency mandates—compress win rates and margins on public work and require security clearances and conflict checks that raise delivery overhead. Investing in compliant delivery models and local partnerships preserves access to sensitive mandates; note US defense spending was about 858 billion USD in FY2024, underscoring the scale of opportunity and scrutiny.
- Strict bidding & localization: higher compliance costs
- Security clearances & conflict checks: added overhead
- Compliance investments: preserve access to classified mandates
- Local partnerships: meet in-country requirements
Geopolitics, sanctions & divergent regs fuel CRA demand; FY2024 rev $573M
Geopolitical shifts, trade policy and sanctions drive demand for CRA advisory—FY2024 revenue ~$573M—while conflicts raise execution risk and data constraints. Major laws and budgets (Bipartisan Infrastructure $1.2T, US discretionary ~$1.7T) and election cycles (2024) affect pipelines. Divergent regs (EU DMA/DSA, China PIPL; US no federal privacy law as of 2025) boost multi‑jurisdiction work.
| Item | Value |
|---|---|
| CRA FY2024 rev | $573M |
| US defense FY2024 | $858B |
| IRA | $369B |
What is included in the product
Detailed Word Document
Explores how Political, Economic, Social, Technological, Environmental and Legal forces uniquely affect Charles River Associates, with data-driven, forward-looking insights and multiple sub-points per category; designed to help executives, consultants and investors identify risks, opportunities and scenario strategies.
Customizable Excel Spreadsheet
A concise, visually segmented Charles River Associates PESTLE summary that’s editable and shareable for meetings, enabling quick alignment across teams, focused external risk discussion, and easy insertion into presentations or client reports.
Economic factors
Macro cycles
Macro cycles drive demand shifts: recessions historically increase restructuring, disputes and damages work while expansions lift growth strategy and M&A advisory; IMF estimated global growth slowed to about 3.2% in 2024 and US unemployment averaged near 3.7%, factors that affect deal flow. CRA’s diversified practice mix and flexible staffing smooth utilization and protect margins, though pricing power ebbing with client budget pressure can compress rates.
Interest rates
Higher interest rates (US fed funds 5.25–5.50% mid‑2025, 10‑yr ~4.1%) have damped deal flow yet increased valuation disputes and solvency analyses. Shifts in discount rates and cost of capital materially alter DCF inputs used in expert testimony. CRA can monetize thought leadership on WACC and fair value; rate volatility boosts demand for risk and treasury advisory.
Sector exposure
Energy, life sciences, and financial services cycles directly drive CRA project volume, with regulated life sciences and finance work providing steadier demand during downturns; CRA reported roughly $600m in 2024 revenue, underscoring sector concentration. Regulatory-heavy sectors generate resilient economics and compliance mandates. CRA can rebalance toward countercyclical units like forensics or competition economics to stabilize revenue. Sector playbooks deepen repeat-client relationships.
Labor market dynamics
Tight labor markets are driving up compensation and retention risk for PhDs and seasoned experts; US unemployment ~3.7% mid‑2025 and average hourly earnings rose ~4.2% YoY (June 2025), pressuring margins. Utilization, pricing and leverage models must offset wage inflation while nearshore and hybrid delivery expand talent pools and capacity. Strong expert‑branding secures marquee matters at premium rates, supporting higher realizations.
- Compensation risk: PhD/senior talent shortages
- Wage inflation: avg hourly earnings +4.2% YoY (Jun 2025)
- Mitigants: utilization, pricing, leverage, nearshore/hybrid
- Revenue premium: expert‑brand drives higher rates and marquee work
Currency movements
Currency movements create material FX exposure for Charles River Associates as multi-currency revenues and local cost bases mean large cross-border engagements can swing reported quarterly results; 2024 saw elevated FX volatility that amplified this effect. Natural hedging through local staffing and billing mitigates translation risk while transparent FX policies and periodic hedging reassure investors and clients.
- FX exposure: multi-currency revenue vs local costs
- Impact: large cross-border cases can materially affect reported results
- Mitigation: natural hedging via local staffing/billing
- Governance: clear FX policy and disclosure reassure stakeholders
Geopolitics, sanctions & divergent regs fuel CRA demand; FY2024 rev $573M
Macro cycles, higher rates and sector rotations shape CRA demand: 2024 revenue ~$600m, IMF global growth ~3.2% (2024), US unemployment ~3.7% mid‑2025; Fed funds 5.25–5.50% and 10‑yr ~4.1% raise disputes and DCF work while wage inflation (+4.2% YoY Jun‑2025) pressures margins; FX volatility amplifies reported results.
| Metric | Value |
|---|---|
| 2024 Revenue | $600m |
| Global GDP (2024) | ~3.2% |
| US Unemployment | 3.7% (mid‑2025) |
| Fed funds | 5.25–5.50% (mid‑2025) |
| Avg hourly earnings | +4.2% YoY (Jun‑2025) |
| 10‑yr | ~4.1% |
Same Document Delivered
Charles River Associates PESTLE Analysis
The Charles River Associates PESTLE Analysis preview shown here is the exact document you’ll receive after purchase—fully formatted and ready to use. The content, layout, and professional structure visible are identical to the downloadable file. No placeholders or teasers, just the finished analysis.
Original: $10.00
-65%$10.00
$3.50Description
Your Competitive Advantage Starts with This Report
Gain a competitive edge with our PESTLE analysis of Charles River Associates—concise, timely insight into political, economic, social, technological, legal and environmental forces shaping its strategy. Use these findings to anticipate regulatory risks, spot growth opportunities, and sharpen investment or advisory cases. Purchase the full, editable report for the complete data and actionable recommendations.
Political factors
Geopolitical volatility
Shifts in trade policy, sanctions, and conflicts boost demand for CRA advisory on supply chains, market entry, and risk, with cross-border engagements rising notably after major events; CRA reported fiscal 2024 revenue of about $573 million, reflecting heightened activity. Execution risk and project delays increase as access and data become constrained. Scenario planning and country-risk models become core differentiators while government work surges but brings procurement and reputational complexity.
Public sector spending
Government budgets for regulatory analysis, infrastructure and policy evaluation—driven by laws such as the $1.2 trillion Bipartisan Infrastructure Law and US federal discretionary spending near $1.7 trillion—directly affect CRA’s consulting pipeline. Election cycles (eg 2024) can pause or accelerate projects, so CRA emphasizes countercyclical services in compliance and policy design. Long-term framework agreements help stabilize utilization despite short-term swings.
Industrial policy
US CHIPS Act includes roughly 52 billion USD for semiconductors, while the Inflation Reduction Act commits about 369 billion USD to clean-energy incentives and the EU Chips Act targets around 43 billion EUR, driving competition and demand for subsidy-impact analysis. Clients require economic-impact assessments and state-aid/antitrust expertise to navigate grant competitions and incentive structures. CRA advises on incentive design and provides litigation support as policy reversals spawn follow-on disputes.
Regulatory harmonization
Divergent standards across the US, EU and APAC—eg EU DMA/DSA in force since 2022 and China PIPL since 2021 while the US still lacks a federal privacy law—drive demand for comparative regulatory analysis; CRA’s multi‑jurisdiction teams decode differences across digital markets, data, energy and life sciences. Harmonization waves can cut cross‑border compliance costs but create transitional uncertainty; multilingual regional experts are a competitive edge.
- EU DMA/DSA: 2022 onward
- China PIPL: effective 2021
- US: no federal privacy law as of 2025
- CRA strength: regional, multilingual teams
Government procurement rules
Government procurement rules—strict bidding, ethics, localization and transparency mandates—compress win rates and margins on public work and require security clearances and conflict checks that raise delivery overhead. Investing in compliant delivery models and local partnerships preserves access to sensitive mandates; note US defense spending was about 858 billion USD in FY2024, underscoring the scale of opportunity and scrutiny.
- Strict bidding & localization: higher compliance costs
- Security clearances & conflict checks: added overhead
- Compliance investments: preserve access to classified mandates
- Local partnerships: meet in-country requirements
Geopolitics, sanctions & divergent regs fuel CRA demand; FY2024 rev $573M
Geopolitical shifts, trade policy and sanctions drive demand for CRA advisory—FY2024 revenue ~$573M—while conflicts raise execution risk and data constraints. Major laws and budgets (Bipartisan Infrastructure $1.2T, US discretionary ~$1.7T) and election cycles (2024) affect pipelines. Divergent regs (EU DMA/DSA, China PIPL; US no federal privacy law as of 2025) boost multi‑jurisdiction work.
| Item | Value |
|---|---|
| CRA FY2024 rev | $573M |
| US defense FY2024 | $858B |
| IRA | $369B |
What is included in the product
Detailed Word Document
Explores how Political, Economic, Social, Technological, Environmental and Legal forces uniquely affect Charles River Associates, with data-driven, forward-looking insights and multiple sub-points per category; designed to help executives, consultants and investors identify risks, opportunities and scenario strategies.
Customizable Excel Spreadsheet
A concise, visually segmented Charles River Associates PESTLE summary that’s editable and shareable for meetings, enabling quick alignment across teams, focused external risk discussion, and easy insertion into presentations or client reports.
Economic factors
Macro cycles
Macro cycles drive demand shifts: recessions historically increase restructuring, disputes and damages work while expansions lift growth strategy and M&A advisory; IMF estimated global growth slowed to about 3.2% in 2024 and US unemployment averaged near 3.7%, factors that affect deal flow. CRA’s diversified practice mix and flexible staffing smooth utilization and protect margins, though pricing power ebbing with client budget pressure can compress rates.
Interest rates
Higher interest rates (US fed funds 5.25–5.50% mid‑2025, 10‑yr ~4.1%) have damped deal flow yet increased valuation disputes and solvency analyses. Shifts in discount rates and cost of capital materially alter DCF inputs used in expert testimony. CRA can monetize thought leadership on WACC and fair value; rate volatility boosts demand for risk and treasury advisory.
Sector exposure
Energy, life sciences, and financial services cycles directly drive CRA project volume, with regulated life sciences and finance work providing steadier demand during downturns; CRA reported roughly $600m in 2024 revenue, underscoring sector concentration. Regulatory-heavy sectors generate resilient economics and compliance mandates. CRA can rebalance toward countercyclical units like forensics or competition economics to stabilize revenue. Sector playbooks deepen repeat-client relationships.
Labor market dynamics
Tight labor markets are driving up compensation and retention risk for PhDs and seasoned experts; US unemployment ~3.7% mid‑2025 and average hourly earnings rose ~4.2% YoY (June 2025), pressuring margins. Utilization, pricing and leverage models must offset wage inflation while nearshore and hybrid delivery expand talent pools and capacity. Strong expert‑branding secures marquee matters at premium rates, supporting higher realizations.
- Compensation risk: PhD/senior talent shortages
- Wage inflation: avg hourly earnings +4.2% YoY (Jun 2025)
- Mitigants: utilization, pricing, leverage, nearshore/hybrid
- Revenue premium: expert‑brand drives higher rates and marquee work
Currency movements
Currency movements create material FX exposure for Charles River Associates as multi-currency revenues and local cost bases mean large cross-border engagements can swing reported quarterly results; 2024 saw elevated FX volatility that amplified this effect. Natural hedging through local staffing and billing mitigates translation risk while transparent FX policies and periodic hedging reassure investors and clients.
- FX exposure: multi-currency revenue vs local costs
- Impact: large cross-border cases can materially affect reported results
- Mitigation: natural hedging via local staffing/billing
- Governance: clear FX policy and disclosure reassure stakeholders
Geopolitics, sanctions & divergent regs fuel CRA demand; FY2024 rev $573M
Macro cycles, higher rates and sector rotations shape CRA demand: 2024 revenue ~$600m, IMF global growth ~3.2% (2024), US unemployment ~3.7% mid‑2025; Fed funds 5.25–5.50% and 10‑yr ~4.1% raise disputes and DCF work while wage inflation (+4.2% YoY Jun‑2025) pressures margins; FX volatility amplifies reported results.
| Metric | Value |
|---|---|
| 2024 Revenue | $600m |
| Global GDP (2024) | ~3.2% |
| US Unemployment | 3.7% (mid‑2025) |
| Fed funds | 5.25–5.50% (mid‑2025) |
| Avg hourly earnings | +4.2% YoY (Jun‑2025) |
| 10‑yr | ~4.1% |
Same Document Delivered
Charles River Associates PESTLE Analysis
The Charles River Associates PESTLE Analysis preview shown here is the exact document you’ll receive after purchase—fully formatted and ready to use. The content, layout, and professional structure visible are identical to the downloadable file. No placeholders or teasers, just the finished analysis.











