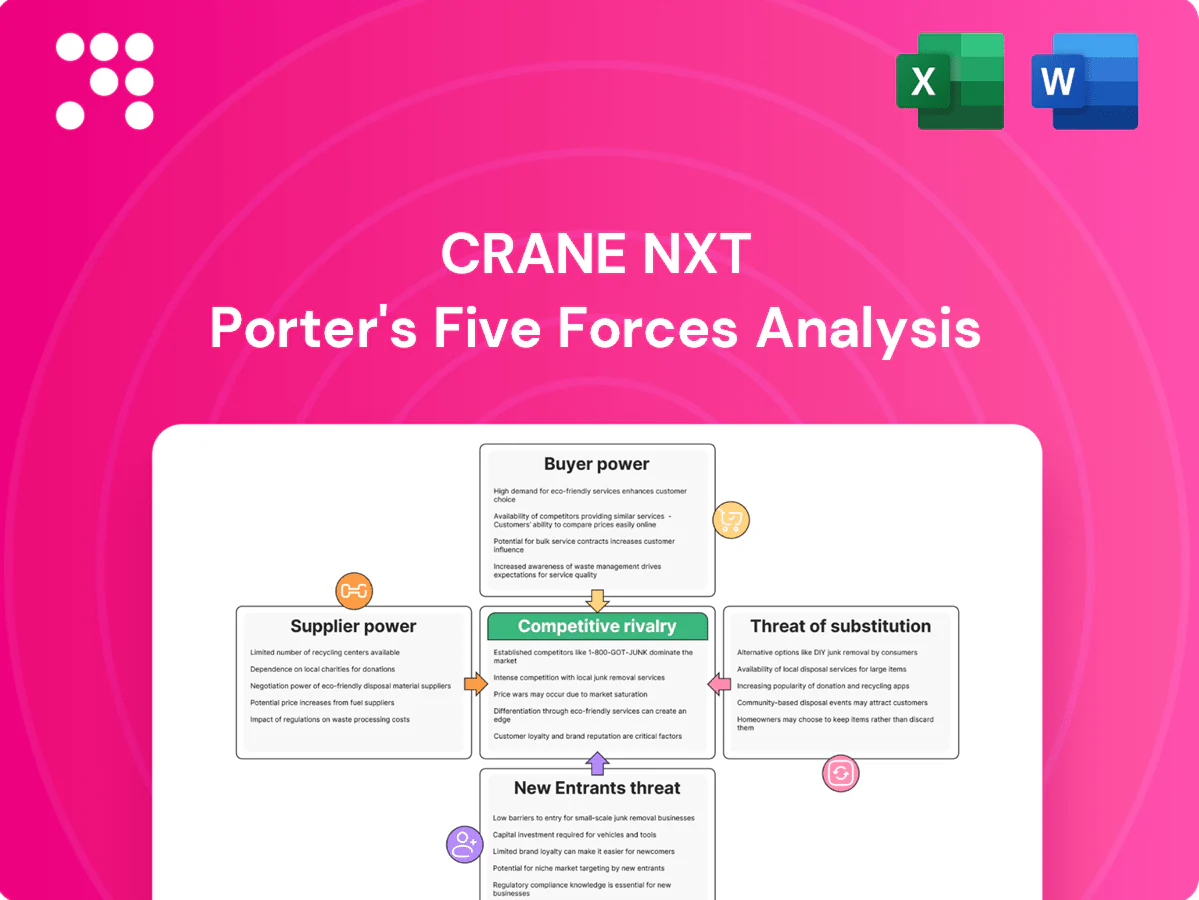
Crane NXT Porter's Five Forces Analysis

Go Beyond the Preview—Access the Full Strategic Report
Crane NXT faces moderate buyer power, specialized supplier ties, and rising substitute pressures as automation shifts market demand. Competitive rivalry depends on scale, service breadth and integration, while regulation and tech create entry barriers. This brief snapshot only scratches the surface. Unlock the full Porter's Five Forces Analysis to explore Crane NXT’s competitive dynamics, market pressures, and strategic advantages in detail.
Suppliers Bargaining Power

Specialty inputs, few qualified sources
Crane NXT depends on niche inputs—micro-optic films, security threads, specialty papers, precision sensors and rare pigments—where in 2024 the top-tier suppliers concentrated roughly 60% of global secure-material capacity, amplifying supplier leverage. Qualification and audit cycles typically take 6–9 months, raising switching costs and operational risk. Multi-sourcing and selective in-house production reduce but do not remove supplier bargaining power.
High compliance and certification burden
Suppliers must pass stringent security, anti-counterfeit and environmental certifications, which narrows the qualified pool and elevates supplier bargaining power. Certification requirements often lengthen lead times—certified vendor onboarding can add weeks to months—and non-compliance risks program delays and penalties. ISO survey data indicate roughly 1.2 million ISO 9001 certificates worldwide, underscoring limited certified capacity. Long-term partnerships mitigate risk but can create embedded dependency.

Process equipment and tooling lock-in
Proprietary converting, coating and inspection equipment lock inputs into specific process flows, with customized tooling and calibration making supplier changes costly. Switching suppliers often requires revalidation with government and OEM customers, typically adding 3–12 months and six- to seven-figure compliance costs. Vendors supplying critical tooling and spares therefore gain clear pricing influence over Crane NXT’s margins.

Geopolitical and materials volatility
Geopolitical shocks and commodity swings affect currency paper fibers, polymers, chemicals and optics components; 2024 saw expanded export controls on optics and semiconductor-related chemicals that tightened flows.
Sanctions since 2022 reduced certain petrochemical and specialty chemical exports, and suppliers commonly pass cost increases to customers when alternatives require lengthy requalification.
Hedging and multi-month inventory buffers lower but do not eliminate exposure to supply and price shocks.
- Export controls expanded in 2024, tightening optics/chemicals supply
- Sanctions have reduced petrochemical export volumes since 2022
- Hedging and inventory mitigate but cannot remove cost pass-through risk
Partial vertical integration offsets
Partial vertical integration gives Crane NXT internal micro-optics and process expertise that reduced reliance on external inputs; 2024 company disclosures show internal sourcing covers ~22% of optics/process spend and backward integration cut external purchases by ~14% YoY. Unique pigments, substrates, and advanced electronics remain ~62% externally sourced, leaving net supplier power moderate to high.
- Internal sourcing ~22% of optics/process spend (2024)
- Backward integration reduced external purchases ~14% YoY (2024)
- Unique pigments/substrates/electronics ~62% externally sourced — supplier power moderate–high
Top suppliers control ~60% capacity; switching costs six- to seven-figures
Supplier power is moderate–high: top suppliers hold ~60% secure-material capacity, qualified vendors take 6–9 months to onboard and switching can cost six- to seven-figure revalidation; internal sourcing covers ~22% of optics spend while ~62% remains external after a 14% YoY cut in external purchases (2024), and 2024 export controls tightened optics/chemical flows.
| Metric | Value (2024) |
|---|---|
| Top-tier supplier capacity | ~60% |
| Onboarding time | 6–9 months |
| Internal optics sourcing | ~22% |
| External reliance | ~62% |
| Backward integration impact | -14% YoY external purchases |
What is included in the product
 Detailed Word Document
Uncovers key competitive drivers, buyer and supplier power, threat of substitutes and entry barriers affecting Crane NXT, highlighting disruptive risks and strategic levers to protect and grow its market share.

 Customizable Excel Spreadsheet
Crane NXT Porter's Five Forces delivers a concise one-sheet summary with customizable pressure levels and an instant spider chart—clean, copy-ready layout for board decks and seamless integration into dashboards to speed strategic decisions.
Customers Bargaining Power

Concentrated sovereign buyers
Central banks and government mints procure banknotes and security features via competitive tenders, with procurement dominated by a few sovereign buyers and contracts frequently in the multi-million-dollar range; in 2024 these tenders remained the primary demand channel. Buyer concentration gives strong negotiation leverage, but switching vendors requires costly requalification, design changes and operational risk, which moderates that power. Long-standing relationships and documented performance history materially improve Crane NXT’s win rates in concentrated sovereign markets.
Price-sensitive tenders with long cycles
Tendering centers on lifecycle cost, security efficacy and reliability, so buyers evaluate total cost of ownership rather than upfront price. Procurement panels frequently pit qualified vendors against each other, squeezing margins and forcing concessions. Replacement cycles often exceed a decade, reducing churn but raising the stakes of each award. Strong value-added features and proprietary IP help defend pricing and margin.

Diverse commercial customers in payments
Retailers, transit, gaming and vending operators face many alternatives across validators, recyclers and IoT payment providers, keeping buyer choice high. They are price- and uptime-sensitive with negotiated SLAs commonly targeting 99.9% uptime and strong penalty clauses. Integration and installed base raise switching costs, but multi-vendor RFPs sustain leverage while bundled software and services drive lock-in.

High switching and compliance costs
Security or validator changes require months of testing, certification and operational retraining, and downtime or fraud exposure during migration deters rapid switching; as of 2024 these operational hurdles create durable pockets of captive demand once deployed, though buyers still negotiate concessions at renewal.
- Long certification cycles: operational friction
- Downtime/fraud risk: deterrent to switching
- Renewal leverage: concessions common
Demand cyclicality and cash usage trends
Banknote demand spikes in crises (global currency in circulation rose about 6% in 2020) but has been flat-to-declining in digitizing markets (BIS reporting ~2% growth in 2023 and modest 2024 upticks). Commercial spending tightens in downturns, heightening price pressure and prompting buyers to defer upgrades, while performance guarantees and TCO proofs are increasingly decisive to sustain pricing.
- 2020 banknote spike ~6% (BIS)
- 2023 circulation growth ~2% (BIS)
- Digital payments up ~10% YoY into 2023
- Buyers defer upgrades; TCO/performance proofs defend price
Sovereign tenders dominate; long requalification and decade-plus cycles raise switching costs
Sovereign buyers dominate tenders (multi-million contracts) giving strong leverage, but long requalification, certification and decade-plus replacement cycles raise switching costs and protect incumbents. Buyers focus on TCO and security efficacy, squeezing margins in panels; retail/transit buyers demand ~99.9% SLA and use multi-vendor RFPs. 2023 banknote growth ~2% with modest 2024 upticks, tightening buyer price sensitivity.
| Buyer | Leverage | Switching cost | 2024 note |
|---|---|---|---|
| Sovereigns | High | Very high | Multi-million tenders |
| Retail/Transit | Medium | High | 99.9% SLA |
Full Version Awaits
Crane NXT Porter's Five Forces Analysis
This preview shows the exact Crane NXT Porter's Five Forces Analysis you'll receive immediately after purchase—no placeholders or samples. The document displayed is the fully formatted, final deliverable and is ready for download and use the moment you buy. What you see is what you'll get.

Go Beyond the Preview—Access the Full Strategic Report
Crane NXT faces moderate buyer power, specialized supplier ties, and rising substitute pressures as automation shifts market demand. Competitive rivalry depends on scale, service breadth and integration, while regulation and tech create entry barriers. This brief snapshot only scratches the surface. Unlock the full Porter's Five Forces Analysis to explore Crane NXT’s competitive dynamics, market pressures, and strategic advantages in detail.
Suppliers Bargaining Power
Specialty inputs, few qualified sources
Crane NXT depends on niche inputs—micro-optic films, security threads, specialty papers, precision sensors and rare pigments—where in 2024 the top-tier suppliers concentrated roughly 60% of global secure-material capacity, amplifying supplier leverage. Qualification and audit cycles typically take 6–9 months, raising switching costs and operational risk. Multi-sourcing and selective in-house production reduce but do not remove supplier bargaining power.
High compliance and certification burden
Suppliers must pass stringent security, anti-counterfeit and environmental certifications, which narrows the qualified pool and elevates supplier bargaining power. Certification requirements often lengthen lead times—certified vendor onboarding can add weeks to months—and non-compliance risks program delays and penalties. ISO survey data indicate roughly 1.2 million ISO 9001 certificates worldwide, underscoring limited certified capacity. Long-term partnerships mitigate risk but can create embedded dependency.
Process equipment and tooling lock-in
Proprietary converting, coating and inspection equipment lock inputs into specific process flows, with customized tooling and calibration making supplier changes costly. Switching suppliers often requires revalidation with government and OEM customers, typically adding 3–12 months and six- to seven-figure compliance costs. Vendors supplying critical tooling and spares therefore gain clear pricing influence over Crane NXT’s margins.
Geopolitical and materials volatility
Geopolitical shocks and commodity swings affect currency paper fibers, polymers, chemicals and optics components; 2024 saw expanded export controls on optics and semiconductor-related chemicals that tightened flows.
Sanctions since 2022 reduced certain petrochemical and specialty chemical exports, and suppliers commonly pass cost increases to customers when alternatives require lengthy requalification.
Hedging and multi-month inventory buffers lower but do not eliminate exposure to supply and price shocks.
- Export controls expanded in 2024, tightening optics/chemicals supply
- Sanctions have reduced petrochemical export volumes since 2022
- Hedging and inventory mitigate but cannot remove cost pass-through risk
Partial vertical integration offsets
Partial vertical integration gives Crane NXT internal micro-optics and process expertise that reduced reliance on external inputs; 2024 company disclosures show internal sourcing covers ~22% of optics/process spend and backward integration cut external purchases by ~14% YoY. Unique pigments, substrates, and advanced electronics remain ~62% externally sourced, leaving net supplier power moderate to high.
- Internal sourcing ~22% of optics/process spend (2024)
- Backward integration reduced external purchases ~14% YoY (2024)
- Unique pigments/substrates/electronics ~62% externally sourced — supplier power moderate–high
Top suppliers control ~60% capacity; switching costs six- to seven-figures
Supplier power is moderate–high: top suppliers hold ~60% secure-material capacity, qualified vendors take 6–9 months to onboard and switching can cost six- to seven-figure revalidation; internal sourcing covers ~22% of optics spend while ~62% remains external after a 14% YoY cut in external purchases (2024), and 2024 export controls tightened optics/chemical flows.
| Metric | Value (2024) |
|---|---|
| Top-tier supplier capacity | ~60% |
| Onboarding time | 6–9 months |
| Internal optics sourcing | ~22% |
| External reliance | ~62% |
| Backward integration impact | -14% YoY external purchases |
What is included in the product
Detailed Word Document
Uncovers key competitive drivers, buyer and supplier power, threat of substitutes and entry barriers affecting Crane NXT, highlighting disruptive risks and strategic levers to protect and grow its market share.
Customizable Excel Spreadsheet
Crane NXT Porter's Five Forces delivers a concise one-sheet summary with customizable pressure levels and an instant spider chart—clean, copy-ready layout for board decks and seamless integration into dashboards to speed strategic decisions.
Customers Bargaining Power
Concentrated sovereign buyers
Central banks and government mints procure banknotes and security features via competitive tenders, with procurement dominated by a few sovereign buyers and contracts frequently in the multi-million-dollar range; in 2024 these tenders remained the primary demand channel. Buyer concentration gives strong negotiation leverage, but switching vendors requires costly requalification, design changes and operational risk, which moderates that power. Long-standing relationships and documented performance history materially improve Crane NXT’s win rates in concentrated sovereign markets.
Price-sensitive tenders with long cycles
Tendering centers on lifecycle cost, security efficacy and reliability, so buyers evaluate total cost of ownership rather than upfront price. Procurement panels frequently pit qualified vendors against each other, squeezing margins and forcing concessions. Replacement cycles often exceed a decade, reducing churn but raising the stakes of each award. Strong value-added features and proprietary IP help defend pricing and margin.
Diverse commercial customers in payments
Retailers, transit, gaming and vending operators face many alternatives across validators, recyclers and IoT payment providers, keeping buyer choice high. They are price- and uptime-sensitive with negotiated SLAs commonly targeting 99.9% uptime and strong penalty clauses. Integration and installed base raise switching costs, but multi-vendor RFPs sustain leverage while bundled software and services drive lock-in.
High switching and compliance costs
Security or validator changes require months of testing, certification and operational retraining, and downtime or fraud exposure during migration deters rapid switching; as of 2024 these operational hurdles create durable pockets of captive demand once deployed, though buyers still negotiate concessions at renewal.
- Long certification cycles: operational friction
- Downtime/fraud risk: deterrent to switching
- Renewal leverage: concessions common
Demand cyclicality and cash usage trends
Banknote demand spikes in crises (global currency in circulation rose about 6% in 2020) but has been flat-to-declining in digitizing markets (BIS reporting ~2% growth in 2023 and modest 2024 upticks). Commercial spending tightens in downturns, heightening price pressure and prompting buyers to defer upgrades, while performance guarantees and TCO proofs are increasingly decisive to sustain pricing.
- 2020 banknote spike ~6% (BIS)
- 2023 circulation growth ~2% (BIS)
- Digital payments up ~10% YoY into 2023
- Buyers defer upgrades; TCO/performance proofs defend price
Sovereign tenders dominate; long requalification and decade-plus cycles raise switching costs
Sovereign buyers dominate tenders (multi-million contracts) giving strong leverage, but long requalification, certification and decade-plus replacement cycles raise switching costs and protect incumbents. Buyers focus on TCO and security efficacy, squeezing margins in panels; retail/transit buyers demand ~99.9% SLA and use multi-vendor RFPs. 2023 banknote growth ~2% with modest 2024 upticks, tightening buyer price sensitivity.
| Buyer | Leverage | Switching cost | 2024 note |
|---|---|---|---|
| Sovereigns | High | Very high | Multi-million tenders |
| Retail/Transit | Medium | High | 99.9% SLA |
Full Version Awaits
Crane NXT Porter's Five Forces Analysis
This preview shows the exact Crane NXT Porter's Five Forces Analysis you'll receive immediately after purchase—no placeholders or samples. The document displayed is the fully formatted, final deliverable and is ready for download and use the moment you buy. What you see is what you'll get.
Description
Go Beyond the Preview—Access the Full Strategic Report
Crane NXT faces moderate buyer power, specialized supplier ties, and rising substitute pressures as automation shifts market demand. Competitive rivalry depends on scale, service breadth and integration, while regulation and tech create entry barriers. This brief snapshot only scratches the surface. Unlock the full Porter's Five Forces Analysis to explore Crane NXT’s competitive dynamics, market pressures, and strategic advantages in detail.
Suppliers Bargaining Power
Specialty inputs, few qualified sources
Crane NXT depends on niche inputs—micro-optic films, security threads, specialty papers, precision sensors and rare pigments—where in 2024 the top-tier suppliers concentrated roughly 60% of global secure-material capacity, amplifying supplier leverage. Qualification and audit cycles typically take 6–9 months, raising switching costs and operational risk. Multi-sourcing and selective in-house production reduce but do not remove supplier bargaining power.
High compliance and certification burden
Suppliers must pass stringent security, anti-counterfeit and environmental certifications, which narrows the qualified pool and elevates supplier bargaining power. Certification requirements often lengthen lead times—certified vendor onboarding can add weeks to months—and non-compliance risks program delays and penalties. ISO survey data indicate roughly 1.2 million ISO 9001 certificates worldwide, underscoring limited certified capacity. Long-term partnerships mitigate risk but can create embedded dependency.
Process equipment and tooling lock-in
Proprietary converting, coating and inspection equipment lock inputs into specific process flows, with customized tooling and calibration making supplier changes costly. Switching suppliers often requires revalidation with government and OEM customers, typically adding 3–12 months and six- to seven-figure compliance costs. Vendors supplying critical tooling and spares therefore gain clear pricing influence over Crane NXT’s margins.
Geopolitical and materials volatility
Geopolitical shocks and commodity swings affect currency paper fibers, polymers, chemicals and optics components; 2024 saw expanded export controls on optics and semiconductor-related chemicals that tightened flows.
Sanctions since 2022 reduced certain petrochemical and specialty chemical exports, and suppliers commonly pass cost increases to customers when alternatives require lengthy requalification.
Hedging and multi-month inventory buffers lower but do not eliminate exposure to supply and price shocks.
- Export controls expanded in 2024, tightening optics/chemicals supply
- Sanctions have reduced petrochemical export volumes since 2022
- Hedging and inventory mitigate but cannot remove cost pass-through risk
Partial vertical integration offsets
Partial vertical integration gives Crane NXT internal micro-optics and process expertise that reduced reliance on external inputs; 2024 company disclosures show internal sourcing covers ~22% of optics/process spend and backward integration cut external purchases by ~14% YoY. Unique pigments, substrates, and advanced electronics remain ~62% externally sourced, leaving net supplier power moderate to high.
- Internal sourcing ~22% of optics/process spend (2024)
- Backward integration reduced external purchases ~14% YoY (2024)
- Unique pigments/substrates/electronics ~62% externally sourced — supplier power moderate–high
Top suppliers control ~60% capacity; switching costs six- to seven-figures
Supplier power is moderate–high: top suppliers hold ~60% secure-material capacity, qualified vendors take 6–9 months to onboard and switching can cost six- to seven-figure revalidation; internal sourcing covers ~22% of optics spend while ~62% remains external after a 14% YoY cut in external purchases (2024), and 2024 export controls tightened optics/chemical flows.
| Metric | Value (2024) |
|---|---|
| Top-tier supplier capacity | ~60% |
| Onboarding time | 6–9 months |
| Internal optics sourcing | ~22% |
| External reliance | ~62% |
| Backward integration impact | -14% YoY external purchases |
What is included in the product
Detailed Word Document
Uncovers key competitive drivers, buyer and supplier power, threat of substitutes and entry barriers affecting Crane NXT, highlighting disruptive risks and strategic levers to protect and grow its market share.
Customizable Excel Spreadsheet
Crane NXT Porter's Five Forces delivers a concise one-sheet summary with customizable pressure levels and an instant spider chart—clean, copy-ready layout for board decks and seamless integration into dashboards to speed strategic decisions.
Customers Bargaining Power
Concentrated sovereign buyers
Central banks and government mints procure banknotes and security features via competitive tenders, with procurement dominated by a few sovereign buyers and contracts frequently in the multi-million-dollar range; in 2024 these tenders remained the primary demand channel. Buyer concentration gives strong negotiation leverage, but switching vendors requires costly requalification, design changes and operational risk, which moderates that power. Long-standing relationships and documented performance history materially improve Crane NXT’s win rates in concentrated sovereign markets.
Price-sensitive tenders with long cycles
Tendering centers on lifecycle cost, security efficacy and reliability, so buyers evaluate total cost of ownership rather than upfront price. Procurement panels frequently pit qualified vendors against each other, squeezing margins and forcing concessions. Replacement cycles often exceed a decade, reducing churn but raising the stakes of each award. Strong value-added features and proprietary IP help defend pricing and margin.
Diverse commercial customers in payments
Retailers, transit, gaming and vending operators face many alternatives across validators, recyclers and IoT payment providers, keeping buyer choice high. They are price- and uptime-sensitive with negotiated SLAs commonly targeting 99.9% uptime and strong penalty clauses. Integration and installed base raise switching costs, but multi-vendor RFPs sustain leverage while bundled software and services drive lock-in.
High switching and compliance costs
Security or validator changes require months of testing, certification and operational retraining, and downtime or fraud exposure during migration deters rapid switching; as of 2024 these operational hurdles create durable pockets of captive demand once deployed, though buyers still negotiate concessions at renewal.
- Long certification cycles: operational friction
- Downtime/fraud risk: deterrent to switching
- Renewal leverage: concessions common
Demand cyclicality and cash usage trends
Banknote demand spikes in crises (global currency in circulation rose about 6% in 2020) but has been flat-to-declining in digitizing markets (BIS reporting ~2% growth in 2023 and modest 2024 upticks). Commercial spending tightens in downturns, heightening price pressure and prompting buyers to defer upgrades, while performance guarantees and TCO proofs are increasingly decisive to sustain pricing.
- 2020 banknote spike ~6% (BIS)
- 2023 circulation growth ~2% (BIS)
- Digital payments up ~10% YoY into 2023
- Buyers defer upgrades; TCO/performance proofs defend price
Sovereign tenders dominate; long requalification and decade-plus cycles raise switching costs
Sovereign buyers dominate tenders (multi-million contracts) giving strong leverage, but long requalification, certification and decade-plus replacement cycles raise switching costs and protect incumbents. Buyers focus on TCO and security efficacy, squeezing margins in panels; retail/transit buyers demand ~99.9% SLA and use multi-vendor RFPs. 2023 banknote growth ~2% with modest 2024 upticks, tightening buyer price sensitivity.
| Buyer | Leverage | Switching cost | 2024 note |
|---|---|---|---|
| Sovereigns | High | Very high | Multi-million tenders |
| Retail/Transit | Medium | High | 99.9% SLA |
Full Version Awaits
Crane NXT Porter's Five Forces Analysis
This preview shows the exact Crane NXT Porter's Five Forces Analysis you'll receive immediately after purchase—no placeholders or samples. The document displayed is the fully formatted, final deliverable and is ready for download and use the moment you buy. What you see is what you'll get.











