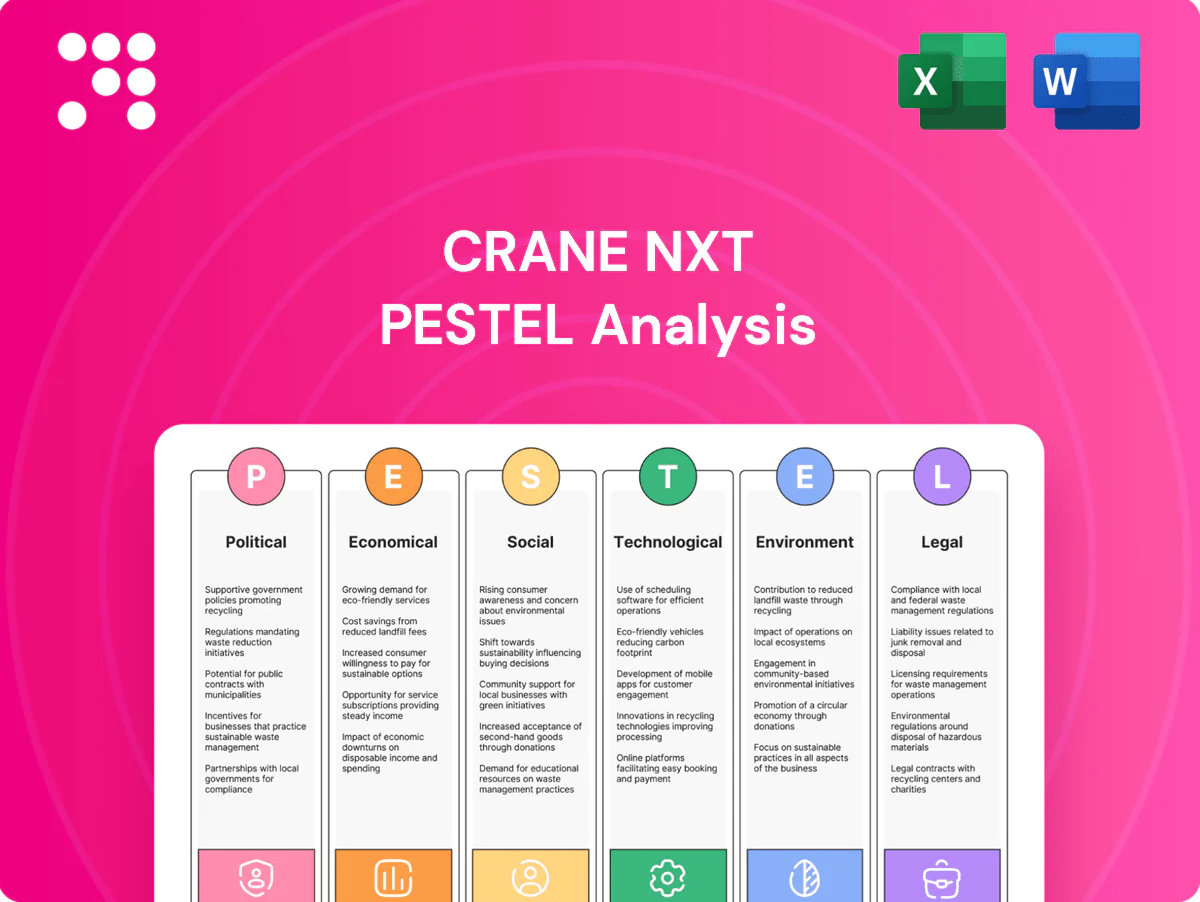
Crane NXT PESTLE Analysis

Your Competitive Advantage Starts with This Report
Unlock strategic clarity with our concise PESTLE Analysis of Crane NXT—three to five sentences won't cut it for complex external risks and opportunities. This snapshot highlights political, economic, social, technological, legal, and environmental forces shaping the firm's future. Purchase the full report to access detailed, actionable insights and download instantly for presentations, due diligence, or strategy work.
Political factors

Government procurement exposure
Crane NXT depends on sovereign clients with long, politically overseen bid cycles that can span multiple years. Changes in administrations frequently reprioritize currency redesigns, volumes, and adoption of new security features. Budget delays and spending freezes in client governments often defer large orders. Maintaining nonpartisan relationships and meeting national security standards is critical for contract continuity.
Geopolitical tensions and sanctions
Export controls widened in 2023–24 (US restrictions on advanced chips and related tech to China) can curb Crane NXT sales of security features and payment devices; ASML remains the sole supplier of EUV lithography, illustrating supplier concentration. Over 60 countries had joined sanctions on Russia by 2024, shifting alliances that complicate cross-border support. Geopolitical shocks threaten optics and substrate supply chains; scenario planning and alternative suppliers/routes cut risk.

Cash policy and central bank stance
Central bank stances—balancing cash resilience against cashless agendas—directly drive banknote demand; global banknotes in circulation remain around $9 trillion (2023–24), sustaining procurement needs. Policy pushes for denomination redesigns or enhanced anti-counterfeiting features trigger multi-year upgrade and replacement cycles that boost minting orders. Conversely, over 90% of central banks were exploring CBDCs by 2024, which could moderate long-term cash growth. Continuous engagement with policy bodies is essential to align Crane NXT’s roadmap.

Public security and anti-counterfeit priorities
Political focus on national security pushes budgets toward advanced authentication, with lawmakers citing the OECD/WCO estimate of ~$509B annual counterfeit trade and governments expanding secure-document procurement in 2024–25. High-profile seizures in 2024 prompted rapid spec changes, accelerating micro-optic adoption where Crane NXT competes; coordination with law enforcement and mints increases procurement influence and pilot wins.
- Policy drivers: national security funding growth 2024–25
- Market signal: ~$509B estimated counterfeit trade (OECD/WCO)
- Opportunity: faster spec changes → micro-optic adoption
- Strategy: align with law enforcement and mints for procurement
Trade policy and tariffs
Tariffs on precision components and specialty chemicals (commonly in the 5–25% range) can raise input costs for micro-optics and substrates, sometimes increasing BOM costs by up to 10–15% in recent supplier cases; regulatory divergence across regions adds compliance complexity for payment devices, lengthening time-to-market by months. Trade agreements such as USMCA and CPTPP expand eligible tender pools, while hedging and localized sourcing reduce FX and tariff exposure.
- tariff range: 5–25%
- BOM cost impact: up to 10–15%
- trade deals: USMCA, CPTPP expand tenders
- mitigation: hedging, localized sourcing
Policy shifts reshape cash tech: $9T notes, $509B counterfeits, >90% CBDC interest
Crane NXT faces multi-year, government-driven procurement cycles where administration changes, budget freezes and national-security priorities determine orders; global banknotes in circulation ≈ $9T (2023–24) sustaining demand. Export controls (US 2023–24 chip curbs) and >60 sanctions on Russia (2024) constrain sales and supply. Over 90% of central banks explored CBDCs by 2024, and OECD/WCO estimate counterfeit trade ≈ $509B (2024).
| Metric | Value |
|---|---|
| Banknotes in circulation | $9T (2023–24) |
| Counterfeit trade | $509B (OECD/WCO, 2024) |
| Central banks exploring CBDCs | >90% (2024) |
| Tariff range / BOM impact | 5–25% / up to 10–15% |
What is included in the product
 Detailed Word Document
Explores how Political, Economic, Social, Technological, Environmental and Legal forces uniquely affect Crane NXT, combining data-backed subpoints, forward-looking scenario insights and regional regulatory context to help executives, investors and entrepreneurs identify risks, opportunities and competitive implications for strategic planning and funding.

 Customizable Excel Spreadsheet
Provides a concise, visually segmented PESTLE summary of Crane NXT that can be dropped into presentations, annotated with region- or business-specific notes, and easily shared for rapid cross-team alignment during planning sessions.
Economic factors

Cash usage cycles and inflation
Inflation increases banknote replacement and volume needs as higher transaction values and faster note wear push orders — global inflation eased to about 4.3% in 2024, but high-inflation countries saw banknote demand rise roughly 8% year-on-year. Economic slowdowns can defer upgrades as treasuries cut capital spend, while emerging markets, responsible for about 60% of cash transactions, sustain cash growth longer than developed markets. Monitoring velocity of money remains key to forecasting demand shifts.
Capex in retail and automation
Merchants’ capital spending drives adoption of payment recyclers, validators and kiosks, with chains prioritizing in-store automation to cut labor; Crane NXT can target retail tech rollouts as operators refresh POS and self-service fleets. Elevated borrowing costs (fed funds ~5.25–5.50% mid‑2025) and tight credit can delay refresh cycles, while rising labor costs improve automation ROI and lift demand for CPI devices. Offering flexible financing and leasing smooths capex timing and preserves order flow.

FX and global revenue mix
Revenue in multiple currencies exposes margins to FX swings; typical 5–10% currency moves can change reported operating margins and EPS materially. Procurement of specialized materials often invoiced in USD/EUR, adding pass-through risk. Local-cost natural hedges reduce but do not eliminate exposure; financial hedges and indexed pricing clauses are used to protect profitability.

Counterfeit risk tied to macro stress
Economic distress often correlates with higher counterfeiting; OECD/EUIPO estimated global trade in counterfeit goods at about USD 461 billion in 2019, highlighting scale vulnerable to macro shocks. That drives demand for advanced authentication features and detection devices, but sudden spikes can overwhelm production and distribution capacity. Modular features and flexible capacity planning improve Crane NXT responsiveness and reduce time-to-deploy for security upgrades.
- Risk: counterfeiting rises during downturns — USD 461bn (OECD/EUIPO 2019)
- Demand: higher for advanced detection and authentication
- Constraint: spikes strain production capacity
- Mitigation: capacity planning and modular feature design
Digital payments substitution
Digital payments substitution is reducing long-run demand for cash-handling equipment; global digital transaction value reached about $8.4 trillion in 2024 with non-cash transactions ~68% of volume, tempering growth for pure cash devices. Cash-heavy segments—gaming, vending, transit—remain resilient, often retaining 30–60% cash use by region. Hybrid acceptance boosts demand for advanced validation and authentication; product strategy must bridge cash and digital ecosystems via modular, API-enabled validators and firmware.
- Impact: lower pure-cash equipment TAM
- Resilience: gaming/vending/transit still cash-reliant
- Opportunity: hybrid validators + authentication
- Strategy: bridge cash + digital with modular, API-first products
Policy shifts reshape cash tech: $9T notes, $509B counterfeits, >90% CBDC interest
Inflation eased to ~4.3% in 2024 while high‑inflation markets saw banknote demand +8% YoY; emerging markets account for ~60% of cash transactions. Tight credit and fed funds ~5.25–5.50% (mid‑2025) delay upgrades but raise automation ROI; digital transactions reached $8.4T in 2024 (non‑cash ~68%), compressing pure‑cash TAM. Counterfeiting (USD 461bn OECD/EUIPO 2019) boosts demand for authentication.
| Indicator | Value | Year |
|---|---|---|
| Global inflation | ~4.3% | 2024 |
| Banknote demand (hi‑inflation) | +8% YoY | 2024 |
| Fed funds | 5.25–5.50% | mid‑2025 |
| Digital txn value | $8.4T | 2024 |
Preview the Actual Deliverable
Crane NXT PESTLE Analysis
The Crane NXT PESTLE Analysis preview shown here is the exact document you’ll receive after purchase—fully formatted and ready to use. The layout, content, and structure visible are identical to the downloadable file. No placeholders or teasers—this is the real, finished product you’ll own immediately after checkout.

Your Competitive Advantage Starts with This Report
Unlock strategic clarity with our concise PESTLE Analysis of Crane NXT—three to five sentences won't cut it for complex external risks and opportunities. This snapshot highlights political, economic, social, technological, legal, and environmental forces shaping the firm's future. Purchase the full report to access detailed, actionable insights and download instantly for presentations, due diligence, or strategy work.
Political factors
Government procurement exposure
Crane NXT depends on sovereign clients with long, politically overseen bid cycles that can span multiple years. Changes in administrations frequently reprioritize currency redesigns, volumes, and adoption of new security features. Budget delays and spending freezes in client governments often defer large orders. Maintaining nonpartisan relationships and meeting national security standards is critical for contract continuity.
Geopolitical tensions and sanctions
Export controls widened in 2023–24 (US restrictions on advanced chips and related tech to China) can curb Crane NXT sales of security features and payment devices; ASML remains the sole supplier of EUV lithography, illustrating supplier concentration. Over 60 countries had joined sanctions on Russia by 2024, shifting alliances that complicate cross-border support. Geopolitical shocks threaten optics and substrate supply chains; scenario planning and alternative suppliers/routes cut risk.
Cash policy and central bank stance
Central bank stances—balancing cash resilience against cashless agendas—directly drive banknote demand; global banknotes in circulation remain around $9 trillion (2023–24), sustaining procurement needs. Policy pushes for denomination redesigns or enhanced anti-counterfeiting features trigger multi-year upgrade and replacement cycles that boost minting orders. Conversely, over 90% of central banks were exploring CBDCs by 2024, which could moderate long-term cash growth. Continuous engagement with policy bodies is essential to align Crane NXT’s roadmap.
Public security and anti-counterfeit priorities
Political focus on national security pushes budgets toward advanced authentication, with lawmakers citing the OECD/WCO estimate of ~$509B annual counterfeit trade and governments expanding secure-document procurement in 2024–25. High-profile seizures in 2024 prompted rapid spec changes, accelerating micro-optic adoption where Crane NXT competes; coordination with law enforcement and mints increases procurement influence and pilot wins.
- Policy drivers: national security funding growth 2024–25
- Market signal: ~$509B estimated counterfeit trade (OECD/WCO)
- Opportunity: faster spec changes → micro-optic adoption
- Strategy: align with law enforcement and mints for procurement
Trade policy and tariffs
Tariffs on precision components and specialty chemicals (commonly in the 5–25% range) can raise input costs for micro-optics and substrates, sometimes increasing BOM costs by up to 10–15% in recent supplier cases; regulatory divergence across regions adds compliance complexity for payment devices, lengthening time-to-market by months. Trade agreements such as USMCA and CPTPP expand eligible tender pools, while hedging and localized sourcing reduce FX and tariff exposure.
- tariff range: 5–25%
- BOM cost impact: up to 10–15%
- trade deals: USMCA, CPTPP expand tenders
- mitigation: hedging, localized sourcing
Policy shifts reshape cash tech: $9T notes, $509B counterfeits, >90% CBDC interest
Crane NXT faces multi-year, government-driven procurement cycles where administration changes, budget freezes and national-security priorities determine orders; global banknotes in circulation ≈ $9T (2023–24) sustaining demand. Export controls (US 2023–24 chip curbs) and >60 sanctions on Russia (2024) constrain sales and supply. Over 90% of central banks explored CBDCs by 2024, and OECD/WCO estimate counterfeit trade ≈ $509B (2024).
| Metric | Value |
|---|---|
| Banknotes in circulation | $9T (2023–24) |
| Counterfeit trade | $509B (OECD/WCO, 2024) |
| Central banks exploring CBDCs | >90% (2024) |
| Tariff range / BOM impact | 5–25% / up to 10–15% |
What is included in the product
Detailed Word Document
Explores how Political, Economic, Social, Technological, Environmental and Legal forces uniquely affect Crane NXT, combining data-backed subpoints, forward-looking scenario insights and regional regulatory context to help executives, investors and entrepreneurs identify risks, opportunities and competitive implications for strategic planning and funding.
Customizable Excel Spreadsheet
Provides a concise, visually segmented PESTLE summary of Crane NXT that can be dropped into presentations, annotated with region- or business-specific notes, and easily shared for rapid cross-team alignment during planning sessions.
Economic factors
Cash usage cycles and inflation
Inflation increases banknote replacement and volume needs as higher transaction values and faster note wear push orders — global inflation eased to about 4.3% in 2024, but high-inflation countries saw banknote demand rise roughly 8% year-on-year. Economic slowdowns can defer upgrades as treasuries cut capital spend, while emerging markets, responsible for about 60% of cash transactions, sustain cash growth longer than developed markets. Monitoring velocity of money remains key to forecasting demand shifts.
Capex in retail and automation
Merchants’ capital spending drives adoption of payment recyclers, validators and kiosks, with chains prioritizing in-store automation to cut labor; Crane NXT can target retail tech rollouts as operators refresh POS and self-service fleets. Elevated borrowing costs (fed funds ~5.25–5.50% mid‑2025) and tight credit can delay refresh cycles, while rising labor costs improve automation ROI and lift demand for CPI devices. Offering flexible financing and leasing smooths capex timing and preserves order flow.
FX and global revenue mix
Revenue in multiple currencies exposes margins to FX swings; typical 5–10% currency moves can change reported operating margins and EPS materially. Procurement of specialized materials often invoiced in USD/EUR, adding pass-through risk. Local-cost natural hedges reduce but do not eliminate exposure; financial hedges and indexed pricing clauses are used to protect profitability.
Counterfeit risk tied to macro stress
Economic distress often correlates with higher counterfeiting; OECD/EUIPO estimated global trade in counterfeit goods at about USD 461 billion in 2019, highlighting scale vulnerable to macro shocks. That drives demand for advanced authentication features and detection devices, but sudden spikes can overwhelm production and distribution capacity. Modular features and flexible capacity planning improve Crane NXT responsiveness and reduce time-to-deploy for security upgrades.
- Risk: counterfeiting rises during downturns — USD 461bn (OECD/EUIPO 2019)
- Demand: higher for advanced detection and authentication
- Constraint: spikes strain production capacity
- Mitigation: capacity planning and modular feature design
Digital payments substitution
Digital payments substitution is reducing long-run demand for cash-handling equipment; global digital transaction value reached about $8.4 trillion in 2024 with non-cash transactions ~68% of volume, tempering growth for pure cash devices. Cash-heavy segments—gaming, vending, transit—remain resilient, often retaining 30–60% cash use by region. Hybrid acceptance boosts demand for advanced validation and authentication; product strategy must bridge cash and digital ecosystems via modular, API-enabled validators and firmware.
- Impact: lower pure-cash equipment TAM
- Resilience: gaming/vending/transit still cash-reliant
- Opportunity: hybrid validators + authentication
- Strategy: bridge cash + digital with modular, API-first products
Policy shifts reshape cash tech: $9T notes, $509B counterfeits, >90% CBDC interest
Inflation eased to ~4.3% in 2024 while high‑inflation markets saw banknote demand +8% YoY; emerging markets account for ~60% of cash transactions. Tight credit and fed funds ~5.25–5.50% (mid‑2025) delay upgrades but raise automation ROI; digital transactions reached $8.4T in 2024 (non‑cash ~68%), compressing pure‑cash TAM. Counterfeiting (USD 461bn OECD/EUIPO 2019) boosts demand for authentication.
| Indicator | Value | Year |
|---|---|---|
| Global inflation | ~4.3% | 2024 |
| Banknote demand (hi‑inflation) | +8% YoY | 2024 |
| Fed funds | 5.25–5.50% | mid‑2025 |
| Digital txn value | $8.4T | 2024 |
Preview the Actual Deliverable
Crane NXT PESTLE Analysis
The Crane NXT PESTLE Analysis preview shown here is the exact document you’ll receive after purchase—fully formatted and ready to use. The layout, content, and structure visible are identical to the downloadable file. No placeholders or teasers—this is the real, finished product you’ll own immediately after checkout.
Description
Your Competitive Advantage Starts with This Report
Unlock strategic clarity with our concise PESTLE Analysis of Crane NXT—three to five sentences won't cut it for complex external risks and opportunities. This snapshot highlights political, economic, social, technological, legal, and environmental forces shaping the firm's future. Purchase the full report to access detailed, actionable insights and download instantly for presentations, due diligence, or strategy work.
Political factors
Government procurement exposure
Crane NXT depends on sovereign clients with long, politically overseen bid cycles that can span multiple years. Changes in administrations frequently reprioritize currency redesigns, volumes, and adoption of new security features. Budget delays and spending freezes in client governments often defer large orders. Maintaining nonpartisan relationships and meeting national security standards is critical for contract continuity.
Geopolitical tensions and sanctions
Export controls widened in 2023–24 (US restrictions on advanced chips and related tech to China) can curb Crane NXT sales of security features and payment devices; ASML remains the sole supplier of EUV lithography, illustrating supplier concentration. Over 60 countries had joined sanctions on Russia by 2024, shifting alliances that complicate cross-border support. Geopolitical shocks threaten optics and substrate supply chains; scenario planning and alternative suppliers/routes cut risk.
Cash policy and central bank stance
Central bank stances—balancing cash resilience against cashless agendas—directly drive banknote demand; global banknotes in circulation remain around $9 trillion (2023–24), sustaining procurement needs. Policy pushes for denomination redesigns or enhanced anti-counterfeiting features trigger multi-year upgrade and replacement cycles that boost minting orders. Conversely, over 90% of central banks were exploring CBDCs by 2024, which could moderate long-term cash growth. Continuous engagement with policy bodies is essential to align Crane NXT’s roadmap.
Public security and anti-counterfeit priorities
Political focus on national security pushes budgets toward advanced authentication, with lawmakers citing the OECD/WCO estimate of ~$509B annual counterfeit trade and governments expanding secure-document procurement in 2024–25. High-profile seizures in 2024 prompted rapid spec changes, accelerating micro-optic adoption where Crane NXT competes; coordination with law enforcement and mints increases procurement influence and pilot wins.
- Policy drivers: national security funding growth 2024–25
- Market signal: ~$509B estimated counterfeit trade (OECD/WCO)
- Opportunity: faster spec changes → micro-optic adoption
- Strategy: align with law enforcement and mints for procurement
Trade policy and tariffs
Tariffs on precision components and specialty chemicals (commonly in the 5–25% range) can raise input costs for micro-optics and substrates, sometimes increasing BOM costs by up to 10–15% in recent supplier cases; regulatory divergence across regions adds compliance complexity for payment devices, lengthening time-to-market by months. Trade agreements such as USMCA and CPTPP expand eligible tender pools, while hedging and localized sourcing reduce FX and tariff exposure.
- tariff range: 5–25%
- BOM cost impact: up to 10–15%
- trade deals: USMCA, CPTPP expand tenders
- mitigation: hedging, localized sourcing
Policy shifts reshape cash tech: $9T notes, $509B counterfeits, >90% CBDC interest
Crane NXT faces multi-year, government-driven procurement cycles where administration changes, budget freezes and national-security priorities determine orders; global banknotes in circulation ≈ $9T (2023–24) sustaining demand. Export controls (US 2023–24 chip curbs) and >60 sanctions on Russia (2024) constrain sales and supply. Over 90% of central banks explored CBDCs by 2024, and OECD/WCO estimate counterfeit trade ≈ $509B (2024).
| Metric | Value |
|---|---|
| Banknotes in circulation | $9T (2023–24) |
| Counterfeit trade | $509B (OECD/WCO, 2024) |
| Central banks exploring CBDCs | >90% (2024) |
| Tariff range / BOM impact | 5–25% / up to 10–15% |
What is included in the product
Detailed Word Document
Explores how Political, Economic, Social, Technological, Environmental and Legal forces uniquely affect Crane NXT, combining data-backed subpoints, forward-looking scenario insights and regional regulatory context to help executives, investors and entrepreneurs identify risks, opportunities and competitive implications for strategic planning and funding.
Customizable Excel Spreadsheet
Provides a concise, visually segmented PESTLE summary of Crane NXT that can be dropped into presentations, annotated with region- or business-specific notes, and easily shared for rapid cross-team alignment during planning sessions.
Economic factors
Cash usage cycles and inflation
Inflation increases banknote replacement and volume needs as higher transaction values and faster note wear push orders — global inflation eased to about 4.3% in 2024, but high-inflation countries saw banknote demand rise roughly 8% year-on-year. Economic slowdowns can defer upgrades as treasuries cut capital spend, while emerging markets, responsible for about 60% of cash transactions, sustain cash growth longer than developed markets. Monitoring velocity of money remains key to forecasting demand shifts.
Capex in retail and automation
Merchants’ capital spending drives adoption of payment recyclers, validators and kiosks, with chains prioritizing in-store automation to cut labor; Crane NXT can target retail tech rollouts as operators refresh POS and self-service fleets. Elevated borrowing costs (fed funds ~5.25–5.50% mid‑2025) and tight credit can delay refresh cycles, while rising labor costs improve automation ROI and lift demand for CPI devices. Offering flexible financing and leasing smooths capex timing and preserves order flow.
FX and global revenue mix
Revenue in multiple currencies exposes margins to FX swings; typical 5–10% currency moves can change reported operating margins and EPS materially. Procurement of specialized materials often invoiced in USD/EUR, adding pass-through risk. Local-cost natural hedges reduce but do not eliminate exposure; financial hedges and indexed pricing clauses are used to protect profitability.
Counterfeit risk tied to macro stress
Economic distress often correlates with higher counterfeiting; OECD/EUIPO estimated global trade in counterfeit goods at about USD 461 billion in 2019, highlighting scale vulnerable to macro shocks. That drives demand for advanced authentication features and detection devices, but sudden spikes can overwhelm production and distribution capacity. Modular features and flexible capacity planning improve Crane NXT responsiveness and reduce time-to-deploy for security upgrades.
- Risk: counterfeiting rises during downturns — USD 461bn (OECD/EUIPO 2019)
- Demand: higher for advanced detection and authentication
- Constraint: spikes strain production capacity
- Mitigation: capacity planning and modular feature design
Digital payments substitution
Digital payments substitution is reducing long-run demand for cash-handling equipment; global digital transaction value reached about $8.4 trillion in 2024 with non-cash transactions ~68% of volume, tempering growth for pure cash devices. Cash-heavy segments—gaming, vending, transit—remain resilient, often retaining 30–60% cash use by region. Hybrid acceptance boosts demand for advanced validation and authentication; product strategy must bridge cash and digital ecosystems via modular, API-enabled validators and firmware.
- Impact: lower pure-cash equipment TAM
- Resilience: gaming/vending/transit still cash-reliant
- Opportunity: hybrid validators + authentication
- Strategy: bridge cash + digital with modular, API-first products
Policy shifts reshape cash tech: $9T notes, $509B counterfeits, >90% CBDC interest
Inflation eased to ~4.3% in 2024 while high‑inflation markets saw banknote demand +8% YoY; emerging markets account for ~60% of cash transactions. Tight credit and fed funds ~5.25–5.50% (mid‑2025) delay upgrades but raise automation ROI; digital transactions reached $8.4T in 2024 (non‑cash ~68%), compressing pure‑cash TAM. Counterfeiting (USD 461bn OECD/EUIPO 2019) boosts demand for authentication.
| Indicator | Value | Year |
|---|---|---|
| Global inflation | ~4.3% | 2024 |
| Banknote demand (hi‑inflation) | +8% YoY | 2024 |
| Fed funds | 5.25–5.50% | mid‑2025 |
| Digital txn value | $8.4T | 2024 |
Preview the Actual Deliverable
Crane NXT PESTLE Analysis
The Crane NXT PESTLE Analysis preview shown here is the exact document you’ll receive after purchase—fully formatted and ready to use. The layout, content, and structure visible are identical to the downloadable file. No placeholders or teasers—this is the real, finished product you’ll own immediately after checkout.











