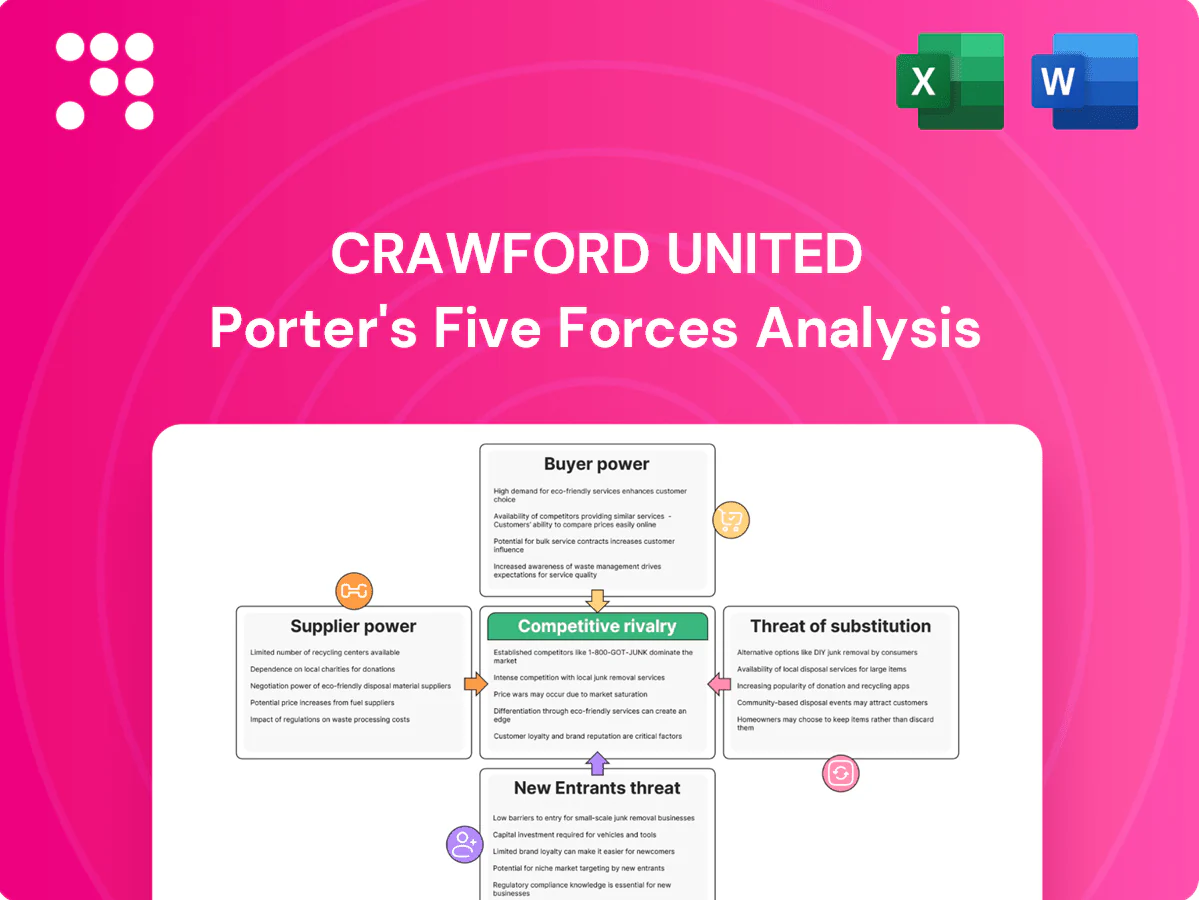
Crawford United Porter's Five Forces Analysis

Go Beyond the Preview—Access the Full Strategic Report
Crawford United’s Porter's Five Forces snapshot highlights competitive intensity, supplier and buyer power, threat of substitutes, and barriers to entry—showing where strategic risk and opportunity lie. This concise overview teases critical pressures shaping performance. Want the full, data-backed breakdown with force ratings and strategic implications? Unlock the complete analysis to inform investment or strategy decisions.
Suppliers Bargaining Power

Specialized components
Precision assemblies for Crawford United rely on niche inputs—HEPA media (global market ~$4.2B in 2024), high-spec sensors, servos, PLCs and machined alloys—where limited qualified vendors raise switching costs and typical lead times often exceed 12 weeks. Dual-sourcing and design-for-supply reduce concentration risk and shorten lead times. Long-term agreements stabilize pricing and availability.
Quality and certification needs
Metrology and calibration demand tightly controlled tolerances (often below 10 µm) and calibration uncertainties down to 1 ppm, so suppliers with ISO/IEC 17025 or ISO 9001-compliant processes gain clear leverage in contracts. Non-conforming inputs can fail customer audits and degrade performance, prompting frequent vendor audits; incoming inspection and vendor qualification markedly reduce risk and protect traceability to national standards like NIST.

Electronics and chips cyclicality
Industrial automation relies heavily on semiconductors, drives and controls that are cyclical and supply-constrained; global semiconductor sales were about $556 billion in 2024 and the market is concentrated, with the top 10 suppliers accounting for roughly 60% of revenue. Allocations and tight lead times (peaked near 24 weeks in 2021, eased toward ~12 weeks by 2024) can raise costs and delay deliveries. Approved alternative parts, redesign buffers, strategic inventory and close supplier partnerships preserve continuity.

Logistics and custom fabrication
Custom housings, filters and frames are bulky and freight-sensitive, raising delivered costs and giving logistics-capable suppliers leverage; air freight can cost roughly 3–5x more than ocean in 2024, widening premiums for speed. Nearshoring and regional fabrication in 2023–24 reduced disruption risk and shortened lead times, while suppliers offering flexible batch sizes command measurable price premiums. Standardizing subassemblies limits dependency and shifts bargaining power toward buyers.
- Logistics premium: air ≈ 3–5x ocean (2024)
- Nearshoring impact: shorter lead times, lower disruption (2023–24)
- Flexible batch suppliers: command price premiums
- Standardized subassemblies: reduce supplier dependency
Commodity inputs volatility
Steel, resins and media pricing remain tied to global commodity markets, with suppliers often passing surcharges through within roughly 30 days; index-linked adjustments were common in 2024. Use of index-based contracts and hedging programs reduced realized price volatility by about 30% in many contracts in 2024, while Crawford United’s value engineering initiatives typically offset 5–8% of input inflation.
- steel: index-linked pass-through ~30 days
- resins/media: global-driven volatility
- hedging: ~30% volatility dampening (2024)
- value engineering: offsets 5–8% input inflation
Supplier power moderate-to-high; hedging cuts volatility ~30%
Supplier power is moderate-to-high: niche HEPA and metrology vendors, concentrated semiconductors and freight-sensitive housings raise switching costs and lead times (HEPA market ~$4.2B; semiconductors $556B; air freight 3–5x ocean). Mitigants: dual-sourcing, long-term contracts, index-linked pricing, hedging (~30% volatility reduction) and value engineering (offsets 5–8%).
| Factor | Impact | 2024 data |
|---|---|---|
| HEPA/precision vendors | High leverage | $4.2B market |
| Semiconductors | Allocation risk | $556B market |
| Freight | Cost premium | Air ≈3–5x ocean |
| Contracts/hedging | Risk reduction | ~30% volatility dampening; 5–8% cost offset |
What is included in the product
 Detailed Word Document
Concise Porter’s Five Forces analysis for Crawford United, identifying competitive intensity, supplier and buyer power, threat of substitutes and entrants, and disruptive trends threatening market share; includes strategic implications and editable Word-ready format for investor decks, business plans, and internal strategy use.

 Customizable Excel Spreadsheet
Clear, one-sheet Crawford United Porter's Five Forces that instantly visualizes competitive pressure with a spider chart and customizable levels—perfect for quick, board-ready decisions. No macros, simple layout, and easy data swaps make it a plug-and-play pain reliever for evolving market scenarios.
Customers Bargaining Power

Diverse industrial customers
End markets for Crawford United span manufacturing, electronics, healthcare and process industries, which together represent roughly 60% of industrial components demand in 2024. Larger enterprise customers—often with procurement > $50m annually—use scale to negotiate price and service-level agreements. Smaller buyers prioritize reliability and total cost of ownership, favoring consistent delivery and lifecycle costs. The mixed customer base moderates aggregate bargaining power.
Specification-driven purchases
Air filtration and metrology purchases are specification-driven with defined performance thresholds, and qualification cycles often take 6–12 months, reducing easy switching. High upfront testing and documentation raise entry costs for vendors, while proven references and certifications such as ISO 14644 and ISO 9001 shift negotiating power back to sellers. Post-sale service contracts, typically 3–5 years, further embed customer stickiness.

Project-based automation
Project-based custom automation is highly competitive and bid-driven, with buyers rigorously comparing designs, cycle times, and payback horizons.
Transparent ROI and faster commissioning win awards; McKinsey (2024) estimates automation can reduce production costs by 20–30%, making clear payback compelling.
Frequent change orders and demand for lifecycle support shift negotiations away from pure price toward total cost of ownership and uptime.

Switching and integration costs
Installed bases create tight integration dependencies with existing PLC, MES and QA systems, making replacements complex; training, validation and potential downtime materially raise switching barriers. Buyers increasingly weigh proven reliability and uptime over headline price — a 2024 Deloitte manufacturing survey found 59% ranked uptime as their top procurement factor. Warranty and SLA terms therefore directly influence customer leverage in negotiations.
- Integration dependencies: PLC/MES/QA
- Hidden switching costs: training, validation, downtime
- Procurement priority 2024: 59% uptime over price
- Leverage drivers: warranty scope and SLA uptime guarantees
Aftermarket and MRO pull
- recurring revenue: 25–35% (2024)
- contract length: 3–5 years
- discounts for bundles: 5–15%
- uptime reduces buyer power
Mixed markets, strong aftermarket and long qualifications tilt leverage toward sellers
Mixed end markets give moderate buyer power; large customers (procurements >$50m) push price, smaller buyers value TCO and reliability. Spec-driven buys have 6–12 month qualifications and high switching costs, boosting seller leverage. Aftermarket = 25–35% revenue; 3–5 year service contracts and 59% uptime priority (Deloitte 2024) reduce buyer leverage.
| Metric | 2024 |
|---|---|
| Aftermarket revenue | 25–35% |
| Qualification cycle | 6–12 months |
| Service contract length | 3–5 years |
| Uptime priority | 59% |
What You See Is What You Get
Crawford United Porter's Five Forces Analysis
This preview displays Crawford United Porter's Five Forces Analysis exactly as delivered—fully formatted, professionally written, and ready to download the moment you purchase. No placeholders, no mockups, and no edits required: what you see here is the full, final document you'll receive instantly after payment.

Go Beyond the Preview—Access the Full Strategic Report
Crawford United’s Porter's Five Forces snapshot highlights competitive intensity, supplier and buyer power, threat of substitutes, and barriers to entry—showing where strategic risk and opportunity lie. This concise overview teases critical pressures shaping performance. Want the full, data-backed breakdown with force ratings and strategic implications? Unlock the complete analysis to inform investment or strategy decisions.
Suppliers Bargaining Power
Specialized components
Precision assemblies for Crawford United rely on niche inputs—HEPA media (global market ~$4.2B in 2024), high-spec sensors, servos, PLCs and machined alloys—where limited qualified vendors raise switching costs and typical lead times often exceed 12 weeks. Dual-sourcing and design-for-supply reduce concentration risk and shorten lead times. Long-term agreements stabilize pricing and availability.
Quality and certification needs
Metrology and calibration demand tightly controlled tolerances (often below 10 µm) and calibration uncertainties down to 1 ppm, so suppliers with ISO/IEC 17025 or ISO 9001-compliant processes gain clear leverage in contracts. Non-conforming inputs can fail customer audits and degrade performance, prompting frequent vendor audits; incoming inspection and vendor qualification markedly reduce risk and protect traceability to national standards like NIST.
Electronics and chips cyclicality
Industrial automation relies heavily on semiconductors, drives and controls that are cyclical and supply-constrained; global semiconductor sales were about $556 billion in 2024 and the market is concentrated, with the top 10 suppliers accounting for roughly 60% of revenue. Allocations and tight lead times (peaked near 24 weeks in 2021, eased toward ~12 weeks by 2024) can raise costs and delay deliveries. Approved alternative parts, redesign buffers, strategic inventory and close supplier partnerships preserve continuity.
Logistics and custom fabrication
Custom housings, filters and frames are bulky and freight-sensitive, raising delivered costs and giving logistics-capable suppliers leverage; air freight can cost roughly 3–5x more than ocean in 2024, widening premiums for speed. Nearshoring and regional fabrication in 2023–24 reduced disruption risk and shortened lead times, while suppliers offering flexible batch sizes command measurable price premiums. Standardizing subassemblies limits dependency and shifts bargaining power toward buyers.
- Logistics premium: air ≈ 3–5x ocean (2024)
- Nearshoring impact: shorter lead times, lower disruption (2023–24)
- Flexible batch suppliers: command price premiums
- Standardized subassemblies: reduce supplier dependency
Commodity inputs volatility
Steel, resins and media pricing remain tied to global commodity markets, with suppliers often passing surcharges through within roughly 30 days; index-linked adjustments were common in 2024. Use of index-based contracts and hedging programs reduced realized price volatility by about 30% in many contracts in 2024, while Crawford United’s value engineering initiatives typically offset 5–8% of input inflation.
- steel: index-linked pass-through ~30 days
- resins/media: global-driven volatility
- hedging: ~30% volatility dampening (2024)
- value engineering: offsets 5–8% input inflation
Supplier power moderate-to-high; hedging cuts volatility ~30%
Supplier power is moderate-to-high: niche HEPA and metrology vendors, concentrated semiconductors and freight-sensitive housings raise switching costs and lead times (HEPA market ~$4.2B; semiconductors $556B; air freight 3–5x ocean). Mitigants: dual-sourcing, long-term contracts, index-linked pricing, hedging (~30% volatility reduction) and value engineering (offsets 5–8%).
| Factor | Impact | 2024 data |
|---|---|---|
| HEPA/precision vendors | High leverage | $4.2B market |
| Semiconductors | Allocation risk | $556B market |
| Freight | Cost premium | Air ≈3–5x ocean |
| Contracts/hedging | Risk reduction | ~30% volatility dampening; 5–8% cost offset |
What is included in the product
Detailed Word Document
Concise Porter’s Five Forces analysis for Crawford United, identifying competitive intensity, supplier and buyer power, threat of substitutes and entrants, and disruptive trends threatening market share; includes strategic implications and editable Word-ready format for investor decks, business plans, and internal strategy use.
Customizable Excel Spreadsheet
Clear, one-sheet Crawford United Porter's Five Forces that instantly visualizes competitive pressure with a spider chart and customizable levels—perfect for quick, board-ready decisions. No macros, simple layout, and easy data swaps make it a plug-and-play pain reliever for evolving market scenarios.
Customers Bargaining Power
Diverse industrial customers
End markets for Crawford United span manufacturing, electronics, healthcare and process industries, which together represent roughly 60% of industrial components demand in 2024. Larger enterprise customers—often with procurement > $50m annually—use scale to negotiate price and service-level agreements. Smaller buyers prioritize reliability and total cost of ownership, favoring consistent delivery and lifecycle costs. The mixed customer base moderates aggregate bargaining power.
Specification-driven purchases
Air filtration and metrology purchases are specification-driven with defined performance thresholds, and qualification cycles often take 6–12 months, reducing easy switching. High upfront testing and documentation raise entry costs for vendors, while proven references and certifications such as ISO 14644 and ISO 9001 shift negotiating power back to sellers. Post-sale service contracts, typically 3–5 years, further embed customer stickiness.
Project-based automation
Project-based custom automation is highly competitive and bid-driven, with buyers rigorously comparing designs, cycle times, and payback horizons.
Transparent ROI and faster commissioning win awards; McKinsey (2024) estimates automation can reduce production costs by 20–30%, making clear payback compelling.
Frequent change orders and demand for lifecycle support shift negotiations away from pure price toward total cost of ownership and uptime.
Switching and integration costs
Installed bases create tight integration dependencies with existing PLC, MES and QA systems, making replacements complex; training, validation and potential downtime materially raise switching barriers. Buyers increasingly weigh proven reliability and uptime over headline price — a 2024 Deloitte manufacturing survey found 59% ranked uptime as their top procurement factor. Warranty and SLA terms therefore directly influence customer leverage in negotiations.
- Integration dependencies: PLC/MES/QA
- Hidden switching costs: training, validation, downtime
- Procurement priority 2024: 59% uptime over price
- Leverage drivers: warranty scope and SLA uptime guarantees
Aftermarket and MRO pull
- recurring revenue: 25–35% (2024)
- contract length: 3–5 years
- discounts for bundles: 5–15%
- uptime reduces buyer power
Mixed markets, strong aftermarket and long qualifications tilt leverage toward sellers
Mixed end markets give moderate buyer power; large customers (procurements >$50m) push price, smaller buyers value TCO and reliability. Spec-driven buys have 6–12 month qualifications and high switching costs, boosting seller leverage. Aftermarket = 25–35% revenue; 3–5 year service contracts and 59% uptime priority (Deloitte 2024) reduce buyer leverage.
| Metric | 2024 |
|---|---|
| Aftermarket revenue | 25–35% |
| Qualification cycle | 6–12 months |
| Service contract length | 3–5 years |
| Uptime priority | 59% |
What You See Is What You Get
Crawford United Porter's Five Forces Analysis
This preview displays Crawford United Porter's Five Forces Analysis exactly as delivered—fully formatted, professionally written, and ready to download the moment you purchase. No placeholders, no mockups, and no edits required: what you see here is the full, final document you'll receive instantly after payment.
Original: $10.00
-65%$10.00
$3.50Description
Go Beyond the Preview—Access the Full Strategic Report
Crawford United’s Porter's Five Forces snapshot highlights competitive intensity, supplier and buyer power, threat of substitutes, and barriers to entry—showing where strategic risk and opportunity lie. This concise overview teases critical pressures shaping performance. Want the full, data-backed breakdown with force ratings and strategic implications? Unlock the complete analysis to inform investment or strategy decisions.
Suppliers Bargaining Power
Specialized components
Precision assemblies for Crawford United rely on niche inputs—HEPA media (global market ~$4.2B in 2024), high-spec sensors, servos, PLCs and machined alloys—where limited qualified vendors raise switching costs and typical lead times often exceed 12 weeks. Dual-sourcing and design-for-supply reduce concentration risk and shorten lead times. Long-term agreements stabilize pricing and availability.
Quality and certification needs
Metrology and calibration demand tightly controlled tolerances (often below 10 µm) and calibration uncertainties down to 1 ppm, so suppliers with ISO/IEC 17025 or ISO 9001-compliant processes gain clear leverage in contracts. Non-conforming inputs can fail customer audits and degrade performance, prompting frequent vendor audits; incoming inspection and vendor qualification markedly reduce risk and protect traceability to national standards like NIST.
Electronics and chips cyclicality
Industrial automation relies heavily on semiconductors, drives and controls that are cyclical and supply-constrained; global semiconductor sales were about $556 billion in 2024 and the market is concentrated, with the top 10 suppliers accounting for roughly 60% of revenue. Allocations and tight lead times (peaked near 24 weeks in 2021, eased toward ~12 weeks by 2024) can raise costs and delay deliveries. Approved alternative parts, redesign buffers, strategic inventory and close supplier partnerships preserve continuity.
Logistics and custom fabrication
Custom housings, filters and frames are bulky and freight-sensitive, raising delivered costs and giving logistics-capable suppliers leverage; air freight can cost roughly 3–5x more than ocean in 2024, widening premiums for speed. Nearshoring and regional fabrication in 2023–24 reduced disruption risk and shortened lead times, while suppliers offering flexible batch sizes command measurable price premiums. Standardizing subassemblies limits dependency and shifts bargaining power toward buyers.
- Logistics premium: air ≈ 3–5x ocean (2024)
- Nearshoring impact: shorter lead times, lower disruption (2023–24)
- Flexible batch suppliers: command price premiums
- Standardized subassemblies: reduce supplier dependency
Commodity inputs volatility
Steel, resins and media pricing remain tied to global commodity markets, with suppliers often passing surcharges through within roughly 30 days; index-linked adjustments were common in 2024. Use of index-based contracts and hedging programs reduced realized price volatility by about 30% in many contracts in 2024, while Crawford United’s value engineering initiatives typically offset 5–8% of input inflation.
- steel: index-linked pass-through ~30 days
- resins/media: global-driven volatility
- hedging: ~30% volatility dampening (2024)
- value engineering: offsets 5–8% input inflation
Supplier power moderate-to-high; hedging cuts volatility ~30%
Supplier power is moderate-to-high: niche HEPA and metrology vendors, concentrated semiconductors and freight-sensitive housings raise switching costs and lead times (HEPA market ~$4.2B; semiconductors $556B; air freight 3–5x ocean). Mitigants: dual-sourcing, long-term contracts, index-linked pricing, hedging (~30% volatility reduction) and value engineering (offsets 5–8%).
| Factor | Impact | 2024 data |
|---|---|---|
| HEPA/precision vendors | High leverage | $4.2B market |
| Semiconductors | Allocation risk | $556B market |
| Freight | Cost premium | Air ≈3–5x ocean |
| Contracts/hedging | Risk reduction | ~30% volatility dampening; 5–8% cost offset |
What is included in the product
Detailed Word Document
Concise Porter’s Five Forces analysis for Crawford United, identifying competitive intensity, supplier and buyer power, threat of substitutes and entrants, and disruptive trends threatening market share; includes strategic implications and editable Word-ready format for investor decks, business plans, and internal strategy use.
Customizable Excel Spreadsheet
Clear, one-sheet Crawford United Porter's Five Forces that instantly visualizes competitive pressure with a spider chart and customizable levels—perfect for quick, board-ready decisions. No macros, simple layout, and easy data swaps make it a plug-and-play pain reliever for evolving market scenarios.
Customers Bargaining Power
Diverse industrial customers
End markets for Crawford United span manufacturing, electronics, healthcare and process industries, which together represent roughly 60% of industrial components demand in 2024. Larger enterprise customers—often with procurement > $50m annually—use scale to negotiate price and service-level agreements. Smaller buyers prioritize reliability and total cost of ownership, favoring consistent delivery and lifecycle costs. The mixed customer base moderates aggregate bargaining power.
Specification-driven purchases
Air filtration and metrology purchases are specification-driven with defined performance thresholds, and qualification cycles often take 6–12 months, reducing easy switching. High upfront testing and documentation raise entry costs for vendors, while proven references and certifications such as ISO 14644 and ISO 9001 shift negotiating power back to sellers. Post-sale service contracts, typically 3–5 years, further embed customer stickiness.
Project-based automation
Project-based custom automation is highly competitive and bid-driven, with buyers rigorously comparing designs, cycle times, and payback horizons.
Transparent ROI and faster commissioning win awards; McKinsey (2024) estimates automation can reduce production costs by 20–30%, making clear payback compelling.
Frequent change orders and demand for lifecycle support shift negotiations away from pure price toward total cost of ownership and uptime.
Switching and integration costs
Installed bases create tight integration dependencies with existing PLC, MES and QA systems, making replacements complex; training, validation and potential downtime materially raise switching barriers. Buyers increasingly weigh proven reliability and uptime over headline price — a 2024 Deloitte manufacturing survey found 59% ranked uptime as their top procurement factor. Warranty and SLA terms therefore directly influence customer leverage in negotiations.
- Integration dependencies: PLC/MES/QA
- Hidden switching costs: training, validation, downtime
- Procurement priority 2024: 59% uptime over price
- Leverage drivers: warranty scope and SLA uptime guarantees
Aftermarket and MRO pull
- recurring revenue: 25–35% (2024)
- contract length: 3–5 years
- discounts for bundles: 5–15%
- uptime reduces buyer power
Mixed markets, strong aftermarket and long qualifications tilt leverage toward sellers
Mixed end markets give moderate buyer power; large customers (procurements >$50m) push price, smaller buyers value TCO and reliability. Spec-driven buys have 6–12 month qualifications and high switching costs, boosting seller leverage. Aftermarket = 25–35% revenue; 3–5 year service contracts and 59% uptime priority (Deloitte 2024) reduce buyer leverage.
| Metric | 2024 |
|---|---|
| Aftermarket revenue | 25–35% |
| Qualification cycle | 6–12 months |
| Service contract length | 3–5 years |
| Uptime priority | 59% |
What You See Is What You Get
Crawford United Porter's Five Forces Analysis
This preview displays Crawford United Porter's Five Forces Analysis exactly as delivered—fully formatted, professionally written, and ready to download the moment you purchase. No placeholders, no mockups, and no edits required: what you see here is the full, final document you'll receive instantly after payment.











