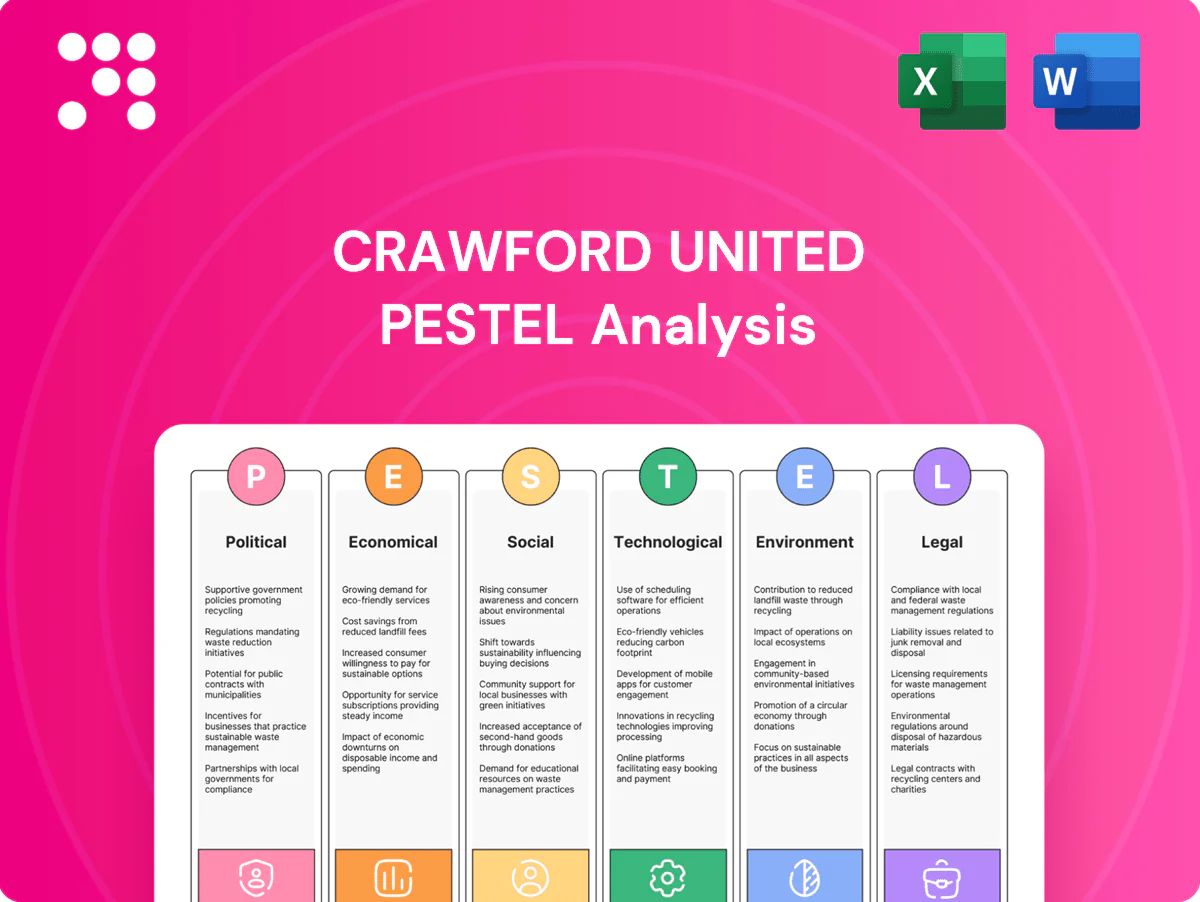
Crawford United PESTLE Analysis

Skip the Research. Get the Strategy.
Unlock strategic clarity with our concise PESTLE Analysis of Crawford United—three to five focused insights reveal how political, economic, social, technological, legal and environmental forces shape its outlook. Ideal for investors and strategists, the full report delivers actionable recommendations. Purchase now to access the complete, ready-to-use analysis.
Political factors

Trade policy and tariffs
Shifts in U.S.–China/EU trade policy can materially change input costs for metals, motors, sensors and electronics used by Crawford United, with U.S. Section 301 tariffs on China remaining at rates up to 25% and Section 232 duties at 25% for steel and 10% for aluminum. Tariffs or anti‑dumping measures can squeeze margins or force price increases across filtration, automation and metrology lines. Proactive sourcing diversification, tariff engineering and leveraging federal incentives such as the CHIPS and Science Act (roughly $52 billion for domestic semiconductor support) can mitigate exposure and favor on‑shore component sourcing.
Industrial policy and incentives
Federal programs such as the Inflation Reduction Act (about $369 billion for energy and climate) and the 2021 Infrastructure Investment and Jobs Act (roughly $1.2 trillion) increase incentives for manufacturing, clean-air and automation investments that can accelerate Crawford United orders and facility expansions. Grants and tax credits under these laws lower upfront cost for energy-efficient equipment and air-filtration upgrades. Buy America provisions in IIJA shape procurement for federally funded projects. Policy stability influences multi-year capex decisions.

Government procurement and infrastructure
Public infrastructure and advanced manufacturing projects increasingly demand high-spec air quality and automation solutions, driven by multi-year programs tied to 3–4 year electoral cycles; government procurement cycles commonly span 12–18 months, with appropriations often set for 3–5 years, which can delay revenue recognition for vendors. Access is gated by registration/compliance to bid lists and panels, while shifting political priorities can reallocate budgets between sectors within a single term.

Export controls and sanctions
Precision measurement and certain automation components used by Crawford United often fall under EAR or ITAR controls, triggering license requirements; US, EU and UK sanctions also restrict sales to jurisdictions such as Russia, Iran and North Korea. Compliance processes increase lead times by weeks and raise overhead; non-compliance carries risks of fines and lost market access.
- Export controls: EAR/ITAR classifications for sensors, servos, control firmware
- Sanctions: restricted sales to sanctioned states/end-users
- Operational impact: added lead time and compliance cost
- Risk: regulatory fines and market access loss
Local permitting and zoning
Facility expansions require local permits and approvals; typical permitting timelines for U.S. manufacturing projects range from 6 to 12 months, often lengthened by local politics. Strong community support and proactive outreach can speed approvals—reports show engagement can cut approval times by up to 30% for manufacturing and testing labs. Multi-month delays directly reduce capacity ramp and can undermine delivery reliability.
- Permitting timelines: 6–12 months
- Engagement impact: up to 30% faster approvals
- Risk: multi-month delays harm ramp/delivery
- Mitigation: local stakeholder engagement reduces project risk
Tariffs, sanctions and export controls raise costs; federal incentives spur automation
Trade tariffs (Section 301 up to 25%, Section 232: steel 25%/aluminum 10%) and sanctions raise input costs and restrict markets, while EAR/ITAR add licensing delays. Federal incentives (CHIPS ~$52B, IRA ~$369B, IIJA ~$1.2T) boost demand for filtration/automation. Permitting averages 6–12 months; local engagement can cut approvals ~30%.
| Factor | Impact | Key number |
|---|---|---|
| Tariffs | Higher costs | 25% |
| Incentives | Demand lift | $52B/$369B/$1.2T |
| Permits | Delay risk | 6–12m (−30%) |
What is included in the product
 Detailed Word Document
Explores how Political, Economic, Social, Technological, Environmental, and Legal forces uniquely impact Crawford United, with each section backed by relevant data and trend analysis. Designed for executives and investors, it offers forward-looking insights and ready-to-use findings for strategy, funding, and scenario planning.

 Customizable Excel Spreadsheet
A concise, visually segmented PESTLE summary for Crawford United that’s easily shareable and editable—ideal for meetings, presentations, and cross-team alignment, allowing notes by region or business line and supporting discussions on external risk and market positioning.
Economic factors

Industrial capex cycles
Customer spending on productivity and quality drives orders for automation, filtration and calibration; the global industrial automation market was about $214 billion in 2024, supporting demand for Crawford United’s systems. Manufacturing PMI averaged near 49.8 in 2024 and US industrial capacity utilization about 76.5%, signaling mixed demand and capacity-led investment. Downturns commonly delay projects and extend sales cycles, while counter-cyclical service and retrofit work — roughly 25% of OEM revenues in 2024 — cushions revenue.
Interest rates and financing
Higher policy rates (Fed funds ~5.25–5.50% in mid‑2025) push customer WACC higher, stretching payback thresholds for automation and air‑handling upgrades and slowing capex. Crawford’s own M&A and equipment borrowing costs (typical equipment loans 6–9%) rise, reducing deal activity. Rate declines could unlock pent‑up demand; flexible pricing and leasing options support conversions and preserve uptake.

Input costs and supply chain
Volatility in steel and aluminum prices (≈20% swing in 2023–24) and episodic shortages of chips and sensors have pushed Crawford United’s COGS higher and more variable, with media and motor components adding supply-side price pressure. Dual-sourcing and higher safety inventory have improved resilience but typically raise working capital by several percentage points of revenue. Periodic logistics disruptions have elongated lead times, sometimes beyond 12–16 weeks. Aggressive cost pass-through and targeted value engineering have protected gross margins.

FX and export competitiveness
Dollar strength through 2023–24 (DXY ~103 average in 2024) depressed international price competitiveness for metrology systems, while currency mismatches squeezed margins on imported components; corporate hedging via forwards and options has reduced realized volatility for many suppliers. Localized sourcing and assembly have been used to offset FX swings and protect gross margins.
- FX impact: DXY ~103 avg 2024
- Margin risk: imported components exposed
- Hedging: forwards/options reduce volatility
- Mitigation: localized sourcing/assembly
Labor availability and wages
Tight manufacturing labor markets are driving up pay for machinists, electricians and calibration techs; US manufacturing average hourly earnings rose 4.1% year‑over‑year in 2024 (BLS). Higher hiring and training costs extend project timelines and margins, while demand for automation climbed (global robot installations up ~10% in 2024) as customers offset labor scarcity. Ongoing productivity programs are essential to sustain profitability.
- Wage pressure: +4.1% manufacturing hourly earnings (2024)
- Automation: robot installations ~+10% (2024)
- Hiring/training inflate project costs and schedules
- Productivity programs preserve margins
Tariffs, sanctions and export controls raise costs; federal incentives spur automation
Customer capex sensitive: global industrial automation ~214B (2024); PMI ~49.8 and US capacity utilization ~76.5% (2024) signal mixed demand. Rates (Fed funds ~5.25–5.50% mid‑2025) and input volatility (steel/aluminum ±20%, DXY ~103 avg 2024) compress margins. Service/retrofits ~25% of OEM revenue and automation uptake (robots +10% 2024) partially cushion revenues.
| Metric | Value |
|---|---|
| Industrial automation market | $214B (2024) |
| Manufacturing PMI | 49.8 (2024) |
| US capacity utilization | 76.5% (2024) |
| Fed funds | 5.25–5.50% (mid‑2025) |
| DXY | ~103 (2024 avg) |
| Retrofit/service share | ~25% OEM revenue (2024) |
| Wage inflation | +4.1% manufacturing hourly earnings (2024) |
What You See Is What You Get
Crawford United PESTLE Analysis
The preview shown here is the exact Crawford United PESTLE Analysis you’ll receive after purchase—fully formatted and ready to use. This is a real screenshot of the product you’re buying, with the same content and structure as the downloadable file. No placeholders or surprises; after checkout you’ll instantly get this exact, professionally structured document.

Skip the Research. Get the Strategy.
Unlock strategic clarity with our concise PESTLE Analysis of Crawford United—three to five focused insights reveal how political, economic, social, technological, legal and environmental forces shape its outlook. Ideal for investors and strategists, the full report delivers actionable recommendations. Purchase now to access the complete, ready-to-use analysis.
Political factors
Trade policy and tariffs
Shifts in U.S.–China/EU trade policy can materially change input costs for metals, motors, sensors and electronics used by Crawford United, with U.S. Section 301 tariffs on China remaining at rates up to 25% and Section 232 duties at 25% for steel and 10% for aluminum. Tariffs or anti‑dumping measures can squeeze margins or force price increases across filtration, automation and metrology lines. Proactive sourcing diversification, tariff engineering and leveraging federal incentives such as the CHIPS and Science Act (roughly $52 billion for domestic semiconductor support) can mitigate exposure and favor on‑shore component sourcing.
Industrial policy and incentives
Federal programs such as the Inflation Reduction Act (about $369 billion for energy and climate) and the 2021 Infrastructure Investment and Jobs Act (roughly $1.2 trillion) increase incentives for manufacturing, clean-air and automation investments that can accelerate Crawford United orders and facility expansions. Grants and tax credits under these laws lower upfront cost for energy-efficient equipment and air-filtration upgrades. Buy America provisions in IIJA shape procurement for federally funded projects. Policy stability influences multi-year capex decisions.
Government procurement and infrastructure
Public infrastructure and advanced manufacturing projects increasingly demand high-spec air quality and automation solutions, driven by multi-year programs tied to 3–4 year electoral cycles; government procurement cycles commonly span 12–18 months, with appropriations often set for 3–5 years, which can delay revenue recognition for vendors. Access is gated by registration/compliance to bid lists and panels, while shifting political priorities can reallocate budgets between sectors within a single term.
Export controls and sanctions
Precision measurement and certain automation components used by Crawford United often fall under EAR or ITAR controls, triggering license requirements; US, EU and UK sanctions also restrict sales to jurisdictions such as Russia, Iran and North Korea. Compliance processes increase lead times by weeks and raise overhead; non-compliance carries risks of fines and lost market access.
- Export controls: EAR/ITAR classifications for sensors, servos, control firmware
- Sanctions: restricted sales to sanctioned states/end-users
- Operational impact: added lead time and compliance cost
- Risk: regulatory fines and market access loss
Local permitting and zoning
Facility expansions require local permits and approvals; typical permitting timelines for U.S. manufacturing projects range from 6 to 12 months, often lengthened by local politics. Strong community support and proactive outreach can speed approvals—reports show engagement can cut approval times by up to 30% for manufacturing and testing labs. Multi-month delays directly reduce capacity ramp and can undermine delivery reliability.
- Permitting timelines: 6–12 months
- Engagement impact: up to 30% faster approvals
- Risk: multi-month delays harm ramp/delivery
- Mitigation: local stakeholder engagement reduces project risk
Tariffs, sanctions and export controls raise costs; federal incentives spur automation
Trade tariffs (Section 301 up to 25%, Section 232: steel 25%/aluminum 10%) and sanctions raise input costs and restrict markets, while EAR/ITAR add licensing delays. Federal incentives (CHIPS ~$52B, IRA ~$369B, IIJA ~$1.2T) boost demand for filtration/automation. Permitting averages 6–12 months; local engagement can cut approvals ~30%.
| Factor | Impact | Key number |
|---|---|---|
| Tariffs | Higher costs | 25% |
| Incentives | Demand lift | $52B/$369B/$1.2T |
| Permits | Delay risk | 6–12m (−30%) |
What is included in the product
Detailed Word Document
Explores how Political, Economic, Social, Technological, Environmental, and Legal forces uniquely impact Crawford United, with each section backed by relevant data and trend analysis. Designed for executives and investors, it offers forward-looking insights and ready-to-use findings for strategy, funding, and scenario planning.
Customizable Excel Spreadsheet
A concise, visually segmented PESTLE summary for Crawford United that’s easily shareable and editable—ideal for meetings, presentations, and cross-team alignment, allowing notes by region or business line and supporting discussions on external risk and market positioning.
Economic factors
Industrial capex cycles
Customer spending on productivity and quality drives orders for automation, filtration and calibration; the global industrial automation market was about $214 billion in 2024, supporting demand for Crawford United’s systems. Manufacturing PMI averaged near 49.8 in 2024 and US industrial capacity utilization about 76.5%, signaling mixed demand and capacity-led investment. Downturns commonly delay projects and extend sales cycles, while counter-cyclical service and retrofit work — roughly 25% of OEM revenues in 2024 — cushions revenue.
Interest rates and financing
Higher policy rates (Fed funds ~5.25–5.50% in mid‑2025) push customer WACC higher, stretching payback thresholds for automation and air‑handling upgrades and slowing capex. Crawford’s own M&A and equipment borrowing costs (typical equipment loans 6–9%) rise, reducing deal activity. Rate declines could unlock pent‑up demand; flexible pricing and leasing options support conversions and preserve uptake.
Input costs and supply chain
Volatility in steel and aluminum prices (≈20% swing in 2023–24) and episodic shortages of chips and sensors have pushed Crawford United’s COGS higher and more variable, with media and motor components adding supply-side price pressure. Dual-sourcing and higher safety inventory have improved resilience but typically raise working capital by several percentage points of revenue. Periodic logistics disruptions have elongated lead times, sometimes beyond 12–16 weeks. Aggressive cost pass-through and targeted value engineering have protected gross margins.
FX and export competitiveness
Dollar strength through 2023–24 (DXY ~103 average in 2024) depressed international price competitiveness for metrology systems, while currency mismatches squeezed margins on imported components; corporate hedging via forwards and options has reduced realized volatility for many suppliers. Localized sourcing and assembly have been used to offset FX swings and protect gross margins.
- FX impact: DXY ~103 avg 2024
- Margin risk: imported components exposed
- Hedging: forwards/options reduce volatility
- Mitigation: localized sourcing/assembly
Labor availability and wages
Tight manufacturing labor markets are driving up pay for machinists, electricians and calibration techs; US manufacturing average hourly earnings rose 4.1% year‑over‑year in 2024 (BLS). Higher hiring and training costs extend project timelines and margins, while demand for automation climbed (global robot installations up ~10% in 2024) as customers offset labor scarcity. Ongoing productivity programs are essential to sustain profitability.
- Wage pressure: +4.1% manufacturing hourly earnings (2024)
- Automation: robot installations ~+10% (2024)
- Hiring/training inflate project costs and schedules
- Productivity programs preserve margins
Tariffs, sanctions and export controls raise costs; federal incentives spur automation
Customer capex sensitive: global industrial automation ~214B (2024); PMI ~49.8 and US capacity utilization ~76.5% (2024) signal mixed demand. Rates (Fed funds ~5.25–5.50% mid‑2025) and input volatility (steel/aluminum ±20%, DXY ~103 avg 2024) compress margins. Service/retrofits ~25% of OEM revenue and automation uptake (robots +10% 2024) partially cushion revenues.
| Metric | Value |
|---|---|
| Industrial automation market | $214B (2024) |
| Manufacturing PMI | 49.8 (2024) |
| US capacity utilization | 76.5% (2024) |
| Fed funds | 5.25–5.50% (mid‑2025) |
| DXY | ~103 (2024 avg) |
| Retrofit/service share | ~25% OEM revenue (2024) |
| Wage inflation | +4.1% manufacturing hourly earnings (2024) |
What You See Is What You Get
Crawford United PESTLE Analysis
The preview shown here is the exact Crawford United PESTLE Analysis you’ll receive after purchase—fully formatted and ready to use. This is a real screenshot of the product you’re buying, with the same content and structure as the downloadable file. No placeholders or surprises; after checkout you’ll instantly get this exact, professionally structured document.
Original: $10.00
-65%$10.00
$3.50Description
Skip the Research. Get the Strategy.
Unlock strategic clarity with our concise PESTLE Analysis of Crawford United—three to five focused insights reveal how political, economic, social, technological, legal and environmental forces shape its outlook. Ideal for investors and strategists, the full report delivers actionable recommendations. Purchase now to access the complete, ready-to-use analysis.
Political factors
Trade policy and tariffs
Shifts in U.S.–China/EU trade policy can materially change input costs for metals, motors, sensors and electronics used by Crawford United, with U.S. Section 301 tariffs on China remaining at rates up to 25% and Section 232 duties at 25% for steel and 10% for aluminum. Tariffs or anti‑dumping measures can squeeze margins or force price increases across filtration, automation and metrology lines. Proactive sourcing diversification, tariff engineering and leveraging federal incentives such as the CHIPS and Science Act (roughly $52 billion for domestic semiconductor support) can mitigate exposure and favor on‑shore component sourcing.
Industrial policy and incentives
Federal programs such as the Inflation Reduction Act (about $369 billion for energy and climate) and the 2021 Infrastructure Investment and Jobs Act (roughly $1.2 trillion) increase incentives for manufacturing, clean-air and automation investments that can accelerate Crawford United orders and facility expansions. Grants and tax credits under these laws lower upfront cost for energy-efficient equipment and air-filtration upgrades. Buy America provisions in IIJA shape procurement for federally funded projects. Policy stability influences multi-year capex decisions.
Government procurement and infrastructure
Public infrastructure and advanced manufacturing projects increasingly demand high-spec air quality and automation solutions, driven by multi-year programs tied to 3–4 year electoral cycles; government procurement cycles commonly span 12–18 months, with appropriations often set for 3–5 years, which can delay revenue recognition for vendors. Access is gated by registration/compliance to bid lists and panels, while shifting political priorities can reallocate budgets between sectors within a single term.
Export controls and sanctions
Precision measurement and certain automation components used by Crawford United often fall under EAR or ITAR controls, triggering license requirements; US, EU and UK sanctions also restrict sales to jurisdictions such as Russia, Iran and North Korea. Compliance processes increase lead times by weeks and raise overhead; non-compliance carries risks of fines and lost market access.
- Export controls: EAR/ITAR classifications for sensors, servos, control firmware
- Sanctions: restricted sales to sanctioned states/end-users
- Operational impact: added lead time and compliance cost
- Risk: regulatory fines and market access loss
Local permitting and zoning
Facility expansions require local permits and approvals; typical permitting timelines for U.S. manufacturing projects range from 6 to 12 months, often lengthened by local politics. Strong community support and proactive outreach can speed approvals—reports show engagement can cut approval times by up to 30% for manufacturing and testing labs. Multi-month delays directly reduce capacity ramp and can undermine delivery reliability.
- Permitting timelines: 6–12 months
- Engagement impact: up to 30% faster approvals
- Risk: multi-month delays harm ramp/delivery
- Mitigation: local stakeholder engagement reduces project risk
Tariffs, sanctions and export controls raise costs; federal incentives spur automation
Trade tariffs (Section 301 up to 25%, Section 232: steel 25%/aluminum 10%) and sanctions raise input costs and restrict markets, while EAR/ITAR add licensing delays. Federal incentives (CHIPS ~$52B, IRA ~$369B, IIJA ~$1.2T) boost demand for filtration/automation. Permitting averages 6–12 months; local engagement can cut approvals ~30%.
| Factor | Impact | Key number |
|---|---|---|
| Tariffs | Higher costs | 25% |
| Incentives | Demand lift | $52B/$369B/$1.2T |
| Permits | Delay risk | 6–12m (−30%) |
What is included in the product
Detailed Word Document
Explores how Political, Economic, Social, Technological, Environmental, and Legal forces uniquely impact Crawford United, with each section backed by relevant data and trend analysis. Designed for executives and investors, it offers forward-looking insights and ready-to-use findings for strategy, funding, and scenario planning.
Customizable Excel Spreadsheet
A concise, visually segmented PESTLE summary for Crawford United that’s easily shareable and editable—ideal for meetings, presentations, and cross-team alignment, allowing notes by region or business line and supporting discussions on external risk and market positioning.
Economic factors
Industrial capex cycles
Customer spending on productivity and quality drives orders for automation, filtration and calibration; the global industrial automation market was about $214 billion in 2024, supporting demand for Crawford United’s systems. Manufacturing PMI averaged near 49.8 in 2024 and US industrial capacity utilization about 76.5%, signaling mixed demand and capacity-led investment. Downturns commonly delay projects and extend sales cycles, while counter-cyclical service and retrofit work — roughly 25% of OEM revenues in 2024 — cushions revenue.
Interest rates and financing
Higher policy rates (Fed funds ~5.25–5.50% in mid‑2025) push customer WACC higher, stretching payback thresholds for automation and air‑handling upgrades and slowing capex. Crawford’s own M&A and equipment borrowing costs (typical equipment loans 6–9%) rise, reducing deal activity. Rate declines could unlock pent‑up demand; flexible pricing and leasing options support conversions and preserve uptake.
Input costs and supply chain
Volatility in steel and aluminum prices (≈20% swing in 2023–24) and episodic shortages of chips and sensors have pushed Crawford United’s COGS higher and more variable, with media and motor components adding supply-side price pressure. Dual-sourcing and higher safety inventory have improved resilience but typically raise working capital by several percentage points of revenue. Periodic logistics disruptions have elongated lead times, sometimes beyond 12–16 weeks. Aggressive cost pass-through and targeted value engineering have protected gross margins.
FX and export competitiveness
Dollar strength through 2023–24 (DXY ~103 average in 2024) depressed international price competitiveness for metrology systems, while currency mismatches squeezed margins on imported components; corporate hedging via forwards and options has reduced realized volatility for many suppliers. Localized sourcing and assembly have been used to offset FX swings and protect gross margins.
- FX impact: DXY ~103 avg 2024
- Margin risk: imported components exposed
- Hedging: forwards/options reduce volatility
- Mitigation: localized sourcing/assembly
Labor availability and wages
Tight manufacturing labor markets are driving up pay for machinists, electricians and calibration techs; US manufacturing average hourly earnings rose 4.1% year‑over‑year in 2024 (BLS). Higher hiring and training costs extend project timelines and margins, while demand for automation climbed (global robot installations up ~10% in 2024) as customers offset labor scarcity. Ongoing productivity programs are essential to sustain profitability.
- Wage pressure: +4.1% manufacturing hourly earnings (2024)
- Automation: robot installations ~+10% (2024)
- Hiring/training inflate project costs and schedules
- Productivity programs preserve margins
Tariffs, sanctions and export controls raise costs; federal incentives spur automation
Customer capex sensitive: global industrial automation ~214B (2024); PMI ~49.8 and US capacity utilization ~76.5% (2024) signal mixed demand. Rates (Fed funds ~5.25–5.50% mid‑2025) and input volatility (steel/aluminum ±20%, DXY ~103 avg 2024) compress margins. Service/retrofits ~25% of OEM revenue and automation uptake (robots +10% 2024) partially cushion revenues.
| Metric | Value |
|---|---|
| Industrial automation market | $214B (2024) |
| Manufacturing PMI | 49.8 (2024) |
| US capacity utilization | 76.5% (2024) |
| Fed funds | 5.25–5.50% (mid‑2025) |
| DXY | ~103 (2024 avg) |
| Retrofit/service share | ~25% OEM revenue (2024) |
| Wage inflation | +4.1% manufacturing hourly earnings (2024) |
What You See Is What You Get
Crawford United PESTLE Analysis
The preview shown here is the exact Crawford United PESTLE Analysis you’ll receive after purchase—fully formatted and ready to use. This is a real screenshot of the product you’re buying, with the same content and structure as the downloadable file. No placeholders or surprises; after checkout you’ll instantly get this exact, professionally structured document.











