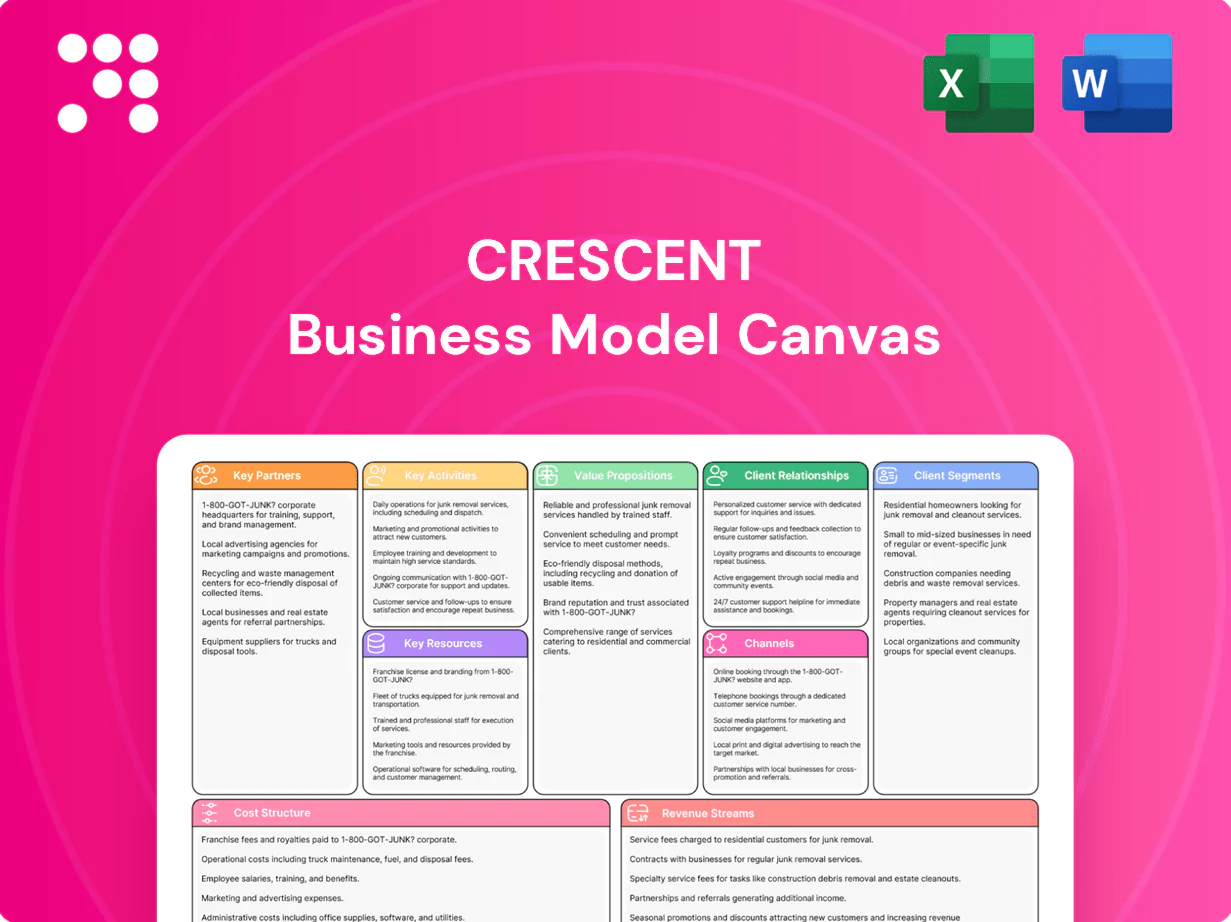
Crescent Business Model Canvas

Business Model Canvas: concise guide to value propositions, customers, revenue
Unlock Crescent’s full strategic blueprint with our complete Business Model Canvas — a concise, section-by-section guide showing value propositions, customer segments, revenue streams, and cost drivers. Perfect for investors, founders, and analysts who need actionable insight; download the Word/Excel files to benchmark and scale faster.
Partnerships

Midstream and pipeline operators
Partnering with gatherers and transporters secures takeaway capacity for oil, gas, and NGLs, with 2024 Permian pipeline additions adding roughly 1 MMbbl/d of crude takeaway capacity to relieve regional constraints.
These relationships reduce basis risk and minimize downtime from bottlenecks, while long-term agreements—commonly 5 to 15 years—provide stable tariffs and priority flow.
Co-planning maintenance windows with midstream partners aligns outages with production schedules, improving uptime and cash flow predictability.
Oilfield service and technology providers
Drilling, completions, and workover contractors enable efficient well execution and uptime, reducing nonproductive time by coordinating crews and assets. Partnerships with frac, logging, and artificial lift vendors drive cost and performance gains, with the global oilfield services market reaching about $224 billion in 2024. Preferred vendor programs lock in service quality and pricing, and joint pilots accelerate adoption of new technologies, shortening deployment cycles and proving ROI.

Data, software, and analytics vendors
Cloud leaders (AWS 32%, Azure 23%, GCP 11% in 2024) plus SCADA and advanced analytics underpin optimization, enabling real-time monitoring with telemetry often under 5 minutes. Predictive maintenance cuts downtime ~30–40% and maintenance spend ≈10–12%. API integrations shorten data latency from hours to minutes; co-development deals tailor subsurface models, delivering 5–10% lift in recovery rates in basin pilots.

Financial institutions and hedge counterparties
- Credit facilities: low hundreds of millions
- Hedging: commodity risk + liquidity
- ISDA & collateral: cash‑flow stability
- Strategic financiers: co‑underwrite large packages
Landowners, leaseholders, and regulators
Landowners, leaseholders, and regulators provide acreage access and operational rights—mineral and surface partners enable drilling and infrastructure while clear agreements reduce title risk and disputes; industry data in 2024 show negotiated title clarity can cut disputes by up to 40% and accelerate project start-up. Constructive regulator relations ensure compliant, timely permitting and community engagement preserves social license to operate.
- Access: mineral + surface partners enable acreage
- Risk: clear agreements lower title disputes (~40% in 2024)
- Regulation: timely permits crucial for schedule
- Community: engagement secures social license
Secure 1 MMbbl/d, cut downtime 30–40%
Partnering with gatherers/transporters secures takeaway capacity—Permian added ~1 MMbbl/d crude takeaway in 2024—reducing basis risk and downtime under long‑term 5–15y contracts.
OSV, frac, and logging vendors plus cloud/SCADA partners cut NPT and enable predictive maintenance (30–40% downtime reduction; oilfield services market ~$224B in 2024).
Banks provide credit lines (low hundreds of millions), hedgers stabilize cash flow; clear title agreements cut disputes ~40% in 2024.
| Metric | 2024 |
|---|---|
| Permian takeaway add | ~1 MMbbl/d |
| Oilfield services market | $224B |
| Predictive maintenance | 30–40% downtime↓ |
| Credit lines (mid‑size) | low $100Ms |
| Title dispute reduction | ~40% |
What is included in the product
 Detailed Word Document
A comprehensive, pre-written Crescent Business Model Canvas outlining customer segments, channels, value propositions, revenue streams and cost structure with strategic insights and competitive analysis for presentations and investor discussions.

 Customizable Excel Spreadsheet
High-level editable one-page canvas that saves hours of formatting, aligns teams quickly, and condenses strategy into a clean, shareable snapshot for fast boardroom decisions and internal collaboration.
Activities

Asset acquisition and portfolio optimization
Sourcing, evaluating, and closing deals expands reserves and scale, allowing Crescent to grow AUM and market presence. Data-driven screening targets undercapitalized assets with clear uplift potential, increasing hit rates and projected returns. Disciplined divestitures sharpen portfolio focus and recycle capital into higher IRR opportunities. As of 2024 private equity dry powder was near 2.5 trillion USD, enabling rapid deployment post-close.
Drilling, completions, and production operations
Executing wells safely and efficiently directly drives volumes and returns, aligning CapEx with production targets. Pad development, optimized frac designs, and artificial lift enhance recovery and lower per‑boe costs. Routine surveillance and workovers sustain base production. Maintenance planning minimizes downtime and costs; U.S. crude oil production averaged 12.9 million b/d in 2024 (EIA).

Technology-enabled optimization
SCADA and IoT stream real-time field data into analytics lakes, enabling high-frequency monitoring across wells and surface assets. Machine learning models drive choke management, chemical dosing and compression setpoints to optimize throughput and lower operating cost. Predictive models have been reported to cut failures and non-productive time by roughly 10–25%, improving uptime and recovery. Integrated subsurface simulation refines development spacing and sequencing to maximize ROI.

Marketing, logistics, and hedging
- Crude/gas/NGL marketing: outlet optimization
- Pipeline/storage: basis and flow balance
- Hedging: cash-flow stabilization
- Blend/quality/timing: capture spreads
HSE, regulatory compliance, and stakeholder engagement
Robust safety systems protect people and assets through certified procedures and incident-rate targets; Crescent aligns to industry TRIR benchmarks and ISO 45001. Emissions monitoring and water stewardship meet evolving standards, backed by EU carbon pricing near €95/ton in 2024. Transparent reporting builds trust with communities and regulators via annual disclosures and independent audits. Proactive remediation and P&A planning address long-term liabilities amid an estimated 3.2 million unplugged US wells in 2024.
- Safety: ISO 45001, TRIR targets
- Emissions: EU ETS ~€95/ton (2024)
- Water: stewardship targets, annual audits
- Liabilities: P&A planning for ~3.2M US wells (2024)
Target undercapitalized oil assets for 15%+ IRR via ops, digital & marketing
Sourcing, ops optimization, digital monitoring and marketing/hedging grow AUM and production, targeting undercapitalized assets with >15% IRR. Efficient development and maintenance sustain volumes; US oil prod ~13.0 MMb/d (2024). Safety, emissions and P&A reduce liability amid ~3.2M unplugged US wells (2024).
| Metric | 2024 |
|---|---|
| US oil prod | 13.0 MMb/d |
| PE dry powder | 2.5 T USD |
| EU ETS | €95/ton |
| Unplugged US wells | 3.2 M |
Delivered as Displayed
Business Model Canvas
The Crescent Business Model Canvas you’re previewing is the actual deliverable, not a mockup or sample. When you purchase, you’ll receive this exact document—fully formatted and complete—in editable Word and Excel files. No surprises: what you see is what you’ll download, ready to present, edit, and share.

Business Model Canvas: concise guide to value propositions, customers, revenue
Unlock Crescent’s full strategic blueprint with our complete Business Model Canvas — a concise, section-by-section guide showing value propositions, customer segments, revenue streams, and cost drivers. Perfect for investors, founders, and analysts who need actionable insight; download the Word/Excel files to benchmark and scale faster.
Partnerships
Midstream and pipeline operators
Partnering with gatherers and transporters secures takeaway capacity for oil, gas, and NGLs, with 2024 Permian pipeline additions adding roughly 1 MMbbl/d of crude takeaway capacity to relieve regional constraints.
These relationships reduce basis risk and minimize downtime from bottlenecks, while long-term agreements—commonly 5 to 15 years—provide stable tariffs and priority flow.
Co-planning maintenance windows with midstream partners aligns outages with production schedules, improving uptime and cash flow predictability.
Oilfield service and technology providers
Drilling, completions, and workover contractors enable efficient well execution and uptime, reducing nonproductive time by coordinating crews and assets. Partnerships with frac, logging, and artificial lift vendors drive cost and performance gains, with the global oilfield services market reaching about $224 billion in 2024. Preferred vendor programs lock in service quality and pricing, and joint pilots accelerate adoption of new technologies, shortening deployment cycles and proving ROI.
Data, software, and analytics vendors
Cloud leaders (AWS 32%, Azure 23%, GCP 11% in 2024) plus SCADA and advanced analytics underpin optimization, enabling real-time monitoring with telemetry often under 5 minutes. Predictive maintenance cuts downtime ~30–40% and maintenance spend ≈10–12%. API integrations shorten data latency from hours to minutes; co-development deals tailor subsurface models, delivering 5–10% lift in recovery rates in basin pilots.
Financial institutions and hedge counterparties
- Credit facilities: low hundreds of millions
- Hedging: commodity risk + liquidity
- ISDA & collateral: cash‑flow stability
- Strategic financiers: co‑underwrite large packages
Landowners, leaseholders, and regulators
Landowners, leaseholders, and regulators provide acreage access and operational rights—mineral and surface partners enable drilling and infrastructure while clear agreements reduce title risk and disputes; industry data in 2024 show negotiated title clarity can cut disputes by up to 40% and accelerate project start-up. Constructive regulator relations ensure compliant, timely permitting and community engagement preserves social license to operate.
- Access: mineral + surface partners enable acreage
- Risk: clear agreements lower title disputes (~40% in 2024)
- Regulation: timely permits crucial for schedule
- Community: engagement secures social license
Secure 1 MMbbl/d, cut downtime 30–40%
Partnering with gatherers/transporters secures takeaway capacity—Permian added ~1 MMbbl/d crude takeaway in 2024—reducing basis risk and downtime under long‑term 5–15y contracts.
OSV, frac, and logging vendors plus cloud/SCADA partners cut NPT and enable predictive maintenance (30–40% downtime reduction; oilfield services market ~$224B in 2024).
Banks provide credit lines (low hundreds of millions), hedgers stabilize cash flow; clear title agreements cut disputes ~40% in 2024.
| Metric | 2024 |
|---|---|
| Permian takeaway add | ~1 MMbbl/d |
| Oilfield services market | $224B |
| Predictive maintenance | 30–40% downtime↓ |
| Credit lines (mid‑size) | low $100Ms |
| Title dispute reduction | ~40% |
What is included in the product
Detailed Word Document
A comprehensive, pre-written Crescent Business Model Canvas outlining customer segments, channels, value propositions, revenue streams and cost structure with strategic insights and competitive analysis for presentations and investor discussions.
Customizable Excel Spreadsheet
High-level editable one-page canvas that saves hours of formatting, aligns teams quickly, and condenses strategy into a clean, shareable snapshot for fast boardroom decisions and internal collaboration.
Activities
Asset acquisition and portfolio optimization
Sourcing, evaluating, and closing deals expands reserves and scale, allowing Crescent to grow AUM and market presence. Data-driven screening targets undercapitalized assets with clear uplift potential, increasing hit rates and projected returns. Disciplined divestitures sharpen portfolio focus and recycle capital into higher IRR opportunities. As of 2024 private equity dry powder was near 2.5 trillion USD, enabling rapid deployment post-close.
Drilling, completions, and production operations
Executing wells safely and efficiently directly drives volumes and returns, aligning CapEx with production targets. Pad development, optimized frac designs, and artificial lift enhance recovery and lower per‑boe costs. Routine surveillance and workovers sustain base production. Maintenance planning minimizes downtime and costs; U.S. crude oil production averaged 12.9 million b/d in 2024 (EIA).
Technology-enabled optimization
SCADA and IoT stream real-time field data into analytics lakes, enabling high-frequency monitoring across wells and surface assets. Machine learning models drive choke management, chemical dosing and compression setpoints to optimize throughput and lower operating cost. Predictive models have been reported to cut failures and non-productive time by roughly 10–25%, improving uptime and recovery. Integrated subsurface simulation refines development spacing and sequencing to maximize ROI.
Marketing, logistics, and hedging
- Crude/gas/NGL marketing: outlet optimization
- Pipeline/storage: basis and flow balance
- Hedging: cash-flow stabilization
- Blend/quality/timing: capture spreads
HSE, regulatory compliance, and stakeholder engagement
Robust safety systems protect people and assets through certified procedures and incident-rate targets; Crescent aligns to industry TRIR benchmarks and ISO 45001. Emissions monitoring and water stewardship meet evolving standards, backed by EU carbon pricing near €95/ton in 2024. Transparent reporting builds trust with communities and regulators via annual disclosures and independent audits. Proactive remediation and P&A planning address long-term liabilities amid an estimated 3.2 million unplugged US wells in 2024.
- Safety: ISO 45001, TRIR targets
- Emissions: EU ETS ~€95/ton (2024)
- Water: stewardship targets, annual audits
- Liabilities: P&A planning for ~3.2M US wells (2024)
Target undercapitalized oil assets for 15%+ IRR via ops, digital & marketing
Sourcing, ops optimization, digital monitoring and marketing/hedging grow AUM and production, targeting undercapitalized assets with >15% IRR. Efficient development and maintenance sustain volumes; US oil prod ~13.0 MMb/d (2024). Safety, emissions and P&A reduce liability amid ~3.2M unplugged US wells (2024).
| Metric | 2024 |
|---|---|
| US oil prod | 13.0 MMb/d |
| PE dry powder | 2.5 T USD |
| EU ETS | €95/ton |
| Unplugged US wells | 3.2 M |
Delivered as Displayed
Business Model Canvas
The Crescent Business Model Canvas you’re previewing is the actual deliverable, not a mockup or sample. When you purchase, you’ll receive this exact document—fully formatted and complete—in editable Word and Excel files. No surprises: what you see is what you’ll download, ready to present, edit, and share.
Original: $10.00
-65%$10.00
$3.50Description
Business Model Canvas: concise guide to value propositions, customers, revenue
Unlock Crescent’s full strategic blueprint with our complete Business Model Canvas — a concise, section-by-section guide showing value propositions, customer segments, revenue streams, and cost drivers. Perfect for investors, founders, and analysts who need actionable insight; download the Word/Excel files to benchmark and scale faster.
Partnerships
Midstream and pipeline operators
Partnering with gatherers and transporters secures takeaway capacity for oil, gas, and NGLs, with 2024 Permian pipeline additions adding roughly 1 MMbbl/d of crude takeaway capacity to relieve regional constraints.
These relationships reduce basis risk and minimize downtime from bottlenecks, while long-term agreements—commonly 5 to 15 years—provide stable tariffs and priority flow.
Co-planning maintenance windows with midstream partners aligns outages with production schedules, improving uptime and cash flow predictability.
Oilfield service and technology providers
Drilling, completions, and workover contractors enable efficient well execution and uptime, reducing nonproductive time by coordinating crews and assets. Partnerships with frac, logging, and artificial lift vendors drive cost and performance gains, with the global oilfield services market reaching about $224 billion in 2024. Preferred vendor programs lock in service quality and pricing, and joint pilots accelerate adoption of new technologies, shortening deployment cycles and proving ROI.
Data, software, and analytics vendors
Cloud leaders (AWS 32%, Azure 23%, GCP 11% in 2024) plus SCADA and advanced analytics underpin optimization, enabling real-time monitoring with telemetry often under 5 minutes. Predictive maintenance cuts downtime ~30–40% and maintenance spend ≈10–12%. API integrations shorten data latency from hours to minutes; co-development deals tailor subsurface models, delivering 5–10% lift in recovery rates in basin pilots.
Financial institutions and hedge counterparties
- Credit facilities: low hundreds of millions
- Hedging: commodity risk + liquidity
- ISDA & collateral: cash‑flow stability
- Strategic financiers: co‑underwrite large packages
Landowners, leaseholders, and regulators
Landowners, leaseholders, and regulators provide acreage access and operational rights—mineral and surface partners enable drilling and infrastructure while clear agreements reduce title risk and disputes; industry data in 2024 show negotiated title clarity can cut disputes by up to 40% and accelerate project start-up. Constructive regulator relations ensure compliant, timely permitting and community engagement preserves social license to operate.
- Access: mineral + surface partners enable acreage
- Risk: clear agreements lower title disputes (~40% in 2024)
- Regulation: timely permits crucial for schedule
- Community: engagement secures social license
Secure 1 MMbbl/d, cut downtime 30–40%
Partnering with gatherers/transporters secures takeaway capacity—Permian added ~1 MMbbl/d crude takeaway in 2024—reducing basis risk and downtime under long‑term 5–15y contracts.
OSV, frac, and logging vendors plus cloud/SCADA partners cut NPT and enable predictive maintenance (30–40% downtime reduction; oilfield services market ~$224B in 2024).
Banks provide credit lines (low hundreds of millions), hedgers stabilize cash flow; clear title agreements cut disputes ~40% in 2024.
| Metric | 2024 |
|---|---|
| Permian takeaway add | ~1 MMbbl/d |
| Oilfield services market | $224B |
| Predictive maintenance | 30–40% downtime↓ |
| Credit lines (mid‑size) | low $100Ms |
| Title dispute reduction | ~40% |
What is included in the product
Detailed Word Document
A comprehensive, pre-written Crescent Business Model Canvas outlining customer segments, channels, value propositions, revenue streams and cost structure with strategic insights and competitive analysis for presentations and investor discussions.
Customizable Excel Spreadsheet
High-level editable one-page canvas that saves hours of formatting, aligns teams quickly, and condenses strategy into a clean, shareable snapshot for fast boardroom decisions and internal collaboration.
Activities
Asset acquisition and portfolio optimization
Sourcing, evaluating, and closing deals expands reserves and scale, allowing Crescent to grow AUM and market presence. Data-driven screening targets undercapitalized assets with clear uplift potential, increasing hit rates and projected returns. Disciplined divestitures sharpen portfolio focus and recycle capital into higher IRR opportunities. As of 2024 private equity dry powder was near 2.5 trillion USD, enabling rapid deployment post-close.
Drilling, completions, and production operations
Executing wells safely and efficiently directly drives volumes and returns, aligning CapEx with production targets. Pad development, optimized frac designs, and artificial lift enhance recovery and lower per‑boe costs. Routine surveillance and workovers sustain base production. Maintenance planning minimizes downtime and costs; U.S. crude oil production averaged 12.9 million b/d in 2024 (EIA).
Technology-enabled optimization
SCADA and IoT stream real-time field data into analytics lakes, enabling high-frequency monitoring across wells and surface assets. Machine learning models drive choke management, chemical dosing and compression setpoints to optimize throughput and lower operating cost. Predictive models have been reported to cut failures and non-productive time by roughly 10–25%, improving uptime and recovery. Integrated subsurface simulation refines development spacing and sequencing to maximize ROI.
Marketing, logistics, and hedging
- Crude/gas/NGL marketing: outlet optimization
- Pipeline/storage: basis and flow balance
- Hedging: cash-flow stabilization
- Blend/quality/timing: capture spreads
HSE, regulatory compliance, and stakeholder engagement
Robust safety systems protect people and assets through certified procedures and incident-rate targets; Crescent aligns to industry TRIR benchmarks and ISO 45001. Emissions monitoring and water stewardship meet evolving standards, backed by EU carbon pricing near €95/ton in 2024. Transparent reporting builds trust with communities and regulators via annual disclosures and independent audits. Proactive remediation and P&A planning address long-term liabilities amid an estimated 3.2 million unplugged US wells in 2024.
- Safety: ISO 45001, TRIR targets
- Emissions: EU ETS ~€95/ton (2024)
- Water: stewardship targets, annual audits
- Liabilities: P&A planning for ~3.2M US wells (2024)
Target undercapitalized oil assets for 15%+ IRR via ops, digital & marketing
Sourcing, ops optimization, digital monitoring and marketing/hedging grow AUM and production, targeting undercapitalized assets with >15% IRR. Efficient development and maintenance sustain volumes; US oil prod ~13.0 MMb/d (2024). Safety, emissions and P&A reduce liability amid ~3.2M unplugged US wells (2024).
| Metric | 2024 |
|---|---|
| US oil prod | 13.0 MMb/d |
| PE dry powder | 2.5 T USD |
| EU ETS | €95/ton |
| Unplugged US wells | 3.2 M |
Delivered as Displayed
Business Model Canvas
The Crescent Business Model Canvas you’re previewing is the actual deliverable, not a mockup or sample. When you purchase, you’ll receive this exact document—fully formatted and complete—in editable Word and Excel files. No surprises: what you see is what you’ll download, ready to present, edit, and share.











