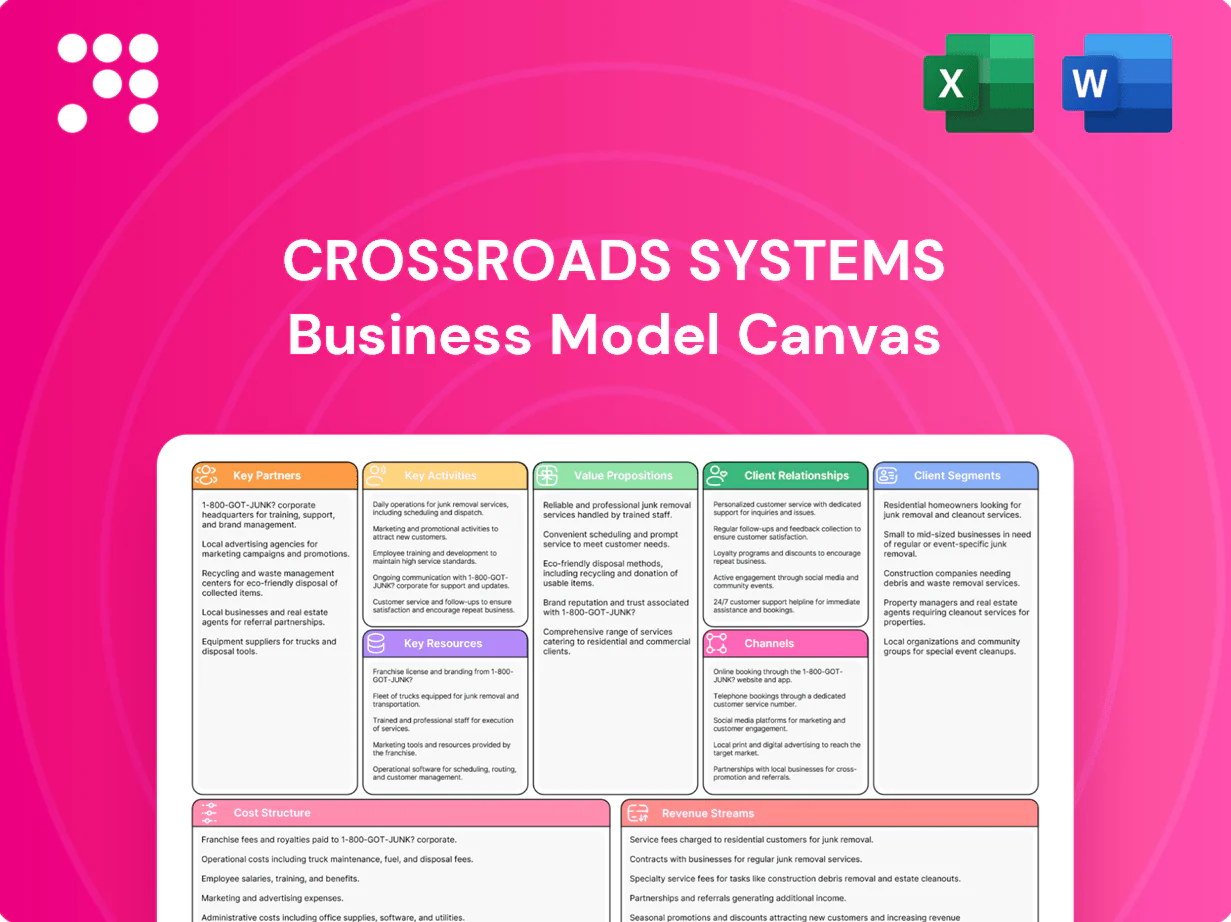
Crossroads Systems Business Model Canvas

Unlock the strategic playbook with a concise, editable Business Model Canvas
Unlock Crossroads Systems’s strategic playbook with our full Business Model Canvas—three to five minutes to read, a lifetime of insight for strategy and investment decisions. This concise, editable canvas maps customer segments, value propositions, channels, and revenue streams with company-specific analysis. Download the Word and Excel files to benchmark, plan, or pitch with confidence—get the complete document now.
Partnerships

Middle-market M&A advisors
Partner with boutique investment banks and buy-side brokers to source proprietary industrial-tech deals in the middle market (EV $10M–$500M). Advisors deliver pipeline visibility, valuation comps and end-to-end process management, and long-term relationships raise deal-flow quality and speed. Success fees, typically 2–4% of deal value, align incentives to disciplined acquisition criteria.
Operating executives & integration firms
Collaborate with seasoned operators and PMI specialists to execute value-creation plans focused on the first 100 days post-close. They deploy playbooks that have driven EBITDA uplifts of 5–20% and working-capital reductions of 1–4% of revenue in comparable 2024 transactions. Contracted operating partners de-risk execution in that window. Incentives are structured to tie materially to EBITDA uplift and cash-conversion improvements.

Lenders & private credit funds
Maintain relationships with banks and non-bank lenders for acquisition financing; private credit AUM exceeded $1.2 trillion in 2023 (Preqin), expanding available capital.
Flexible credit facilities enable timely closings and bolt-ons, often shortening private-debt close times to under 60 days.
Financing partners support covenant structures adapted to industrial cycles, and access to debt expands ROIC without over-diluting equity.

Legal, tax, and compliance advisors
Engage specialized counsel for complex carve-outs and multi-jurisdictional deals to manage legal risk and transaction mechanics; targeted tax structuring—noting US statutory corporate tax remains 21% in 2024—improves after-tax returns and repatriation efficiency. Compliance and ESG partners mitigate regulatory exposure across portfolio companies, and their diligence accelerates approvals and integration readiness.
- Carve-out counsel: cross-border expertise
- Tax structuring: optimize post-tax cash flow (US corp rate 21% in 2024)
- Compliance/ESG: reduce regulatory delay
Technology and industrial vendors
Form vendor alliances to standardize systems across portfolio companies, driving preferred agreements that can lower unit costs by up to 20% and lift service SLAs to enterprise targets such as 99.9% uptime. Co-innovation with OEMs accelerates modernization and digitalization, shortening rollout timelines and lowering integration risk. Shared platforms create scale advantages in procurement and maintenance, consolidating spend and reducing total cost of ownership.
- Preferred pricing: up to 20% unit-cost reduction
- SLAs: target 99.9%+ uptime
- Co-innovation: faster modernization cycles
- Scale: consolidated procurement and lower TCO
Partner network accelerates middle-market industrial tech deals with rapid EBITDA uplift
Partner network sources middle-market industrial-tech deals (EV $10M–$500M) with advisor success fees 2–4% and pipeline visibility. Operating partners drive 5–20% EBITDA uplift and 1–4% working-capital cuts in first 100 days. Financing partners (private credit AUM ~$1.2T in 2023) and flexible facilities shorten close times <60 days; vendors cut unit costs up to 20% and target 99.9% uptime.
| Partner | Role | Key 2024 Metric |
|---|---|---|
| Boutique banks/advisors | Deal sourcing | Fees 2–4% |
| Operating partners | PMI | EBITDA +5–20% |
| Financiers | Debt | Close <60d; private credit $1.2T |
| Vendors/OEMs | Scale | Cost ↓ up to 20%; SLA 99.9% |
What is included in the product
 Detailed Word Document
A comprehensive Business Model Canvas for Crossroads Systems mapping customer segments, channels, value propositions, revenue streams and key resources across the 9 classic BMC blocks with actionable narratives. Includes competitive-advantage analysis, SWOT linkage and a polished format for presentations and investor discussions.

 Customizable Excel Spreadsheet
High-level, editable business model that condenses Crossroads Systems' strategy into a one-page snapshot, quickly surfacing operational pain points and saving teams hours of restructuring for board-ready discussions and fast decision-making.
Activities

Target sourcing & screening
Continuously identify established industrial-tech businesses with defensible niches and growth potential, targeting a top-of-funnel of 200+ screened opportunities annually to offset sector cyclicality. Apply disciplined investment theses and scorecards to qualify deals, emphasizing EBITDA defensibility and 10-15%+ organic growth potential. Maintain focus on proprietary and limited-auction processes, leveraging a private equity market with roughly $2.0 trillion dry powder in 2024.
Financial & operational diligence
Conduct deep dives into quality of earnings, unit economics and operational levers to isolate recurring revenue and normalize one-time adjustments as of 2024. Validate backlog, customer concentration and pricing power, flagging reliance where a small cohort drives outsized revenue. Assess leadership bench and culture fit for integration readiness and turnover risk. Build 100-day plans with quantified value-creation initiatives tied to EBITDA and cash conversion targets.

Deal structuring & execution
Structure deals with cash, earnouts and seller notes to align incentives; practice targets in 2024 favored earnouts for 10-30% of consideration. Optimize capital stack toward 4–5x EBITDA leverage with a 10–20% equity cushion to boost resilience and return. Manage closing workflows, approvals and transition services tightly, and lock key talent with 12–24 month retention packages worth ~15–25% of total comp.

Post-merger integration
Standardize KPIs, monthly reporting cadence, and unified governance across portfolio companies to address the common 70% failure rate in synergy realization; implement shared finance, HR, and IT services to target ~10–20% SG&A reduction and roll out pricing, procurement (2–5% savings), and working-capital programs (1–3 days DSO improvement).
- Standard KPIs; monthly dashboards
- Shared services: finance/HR/IT ≈10–20% savings
- Procurement: 2–5% savings
- Working capital: 1–3 days DSO
- Track synergy capture; course-correct weekly
Portfolio optimization & exits
Portfolio optimization focuses on operational excellence and digital upgrades to lift margins and drive continuous improvement, targeting tuck-in acquisitions to consolidate niches and achieve scale.
Capital is recycled via partial or full exits once value targets are met, with transparent shareholder communications on performance and outlook; private equity dry powder was about $2.3 trillion in 2024 per Preqin.
- Operational excellence & digital upgrades
- Tuck-in acquisitions
- Recycle capital through exits
- Transparent shareholder reporting
Industrial-tech buyout play: Source 200+ targets, 4-5x leverage, capture 10-20% SG&A savings
Source 200+ industrial-tech targets annually; score for EBITDA defensibility and 10–15%+ organic growth. Perform QoE, unit-economics, backlog and leadership diligence; build 100-day EBITDA/cash plans. Use 4–5x leverage, 10–20% equity cushion; prefer 10–30% earnouts and 12–24 month retention (15–25% comp). Standardize KPIs, shared services and procurement to capture 10–20% SG&A and 2–5% procurement savings.
| Metric | 2024 Value |
|---|---|
| Deal funnel | 200+ |
| PE dry powder | $2.3T (Preqin) |
| Leverage | 4–5x EBITDA |
| Equity cushion | 10–20% |
| Earnouts | 10–30% |
| Retention | 12–24 mo / 15–25% comp |
| SG&A savings | 10–20% |
| Procurement savings | 2–5% |
Full Document Unlocks After Purchase
Business Model Canvas
The document previewed here is the exact Crossroads Systems Business Model Canvas you will receive after purchase. It’s not a mockup—this file contains the same content, structure, and formatting visible in the preview. After buying, you’ll download the complete, editable document ready for presentation and use.

Unlock the strategic playbook with a concise, editable Business Model Canvas
Unlock Crossroads Systems’s strategic playbook with our full Business Model Canvas—three to five minutes to read, a lifetime of insight for strategy and investment decisions. This concise, editable canvas maps customer segments, value propositions, channels, and revenue streams with company-specific analysis. Download the Word and Excel files to benchmark, plan, or pitch with confidence—get the complete document now.
Partnerships
Middle-market M&A advisors
Partner with boutique investment banks and buy-side brokers to source proprietary industrial-tech deals in the middle market (EV $10M–$500M). Advisors deliver pipeline visibility, valuation comps and end-to-end process management, and long-term relationships raise deal-flow quality and speed. Success fees, typically 2–4% of deal value, align incentives to disciplined acquisition criteria.
Operating executives & integration firms
Collaborate with seasoned operators and PMI specialists to execute value-creation plans focused on the first 100 days post-close. They deploy playbooks that have driven EBITDA uplifts of 5–20% and working-capital reductions of 1–4% of revenue in comparable 2024 transactions. Contracted operating partners de-risk execution in that window. Incentives are structured to tie materially to EBITDA uplift and cash-conversion improvements.
Lenders & private credit funds
Maintain relationships with banks and non-bank lenders for acquisition financing; private credit AUM exceeded $1.2 trillion in 2023 (Preqin), expanding available capital.
Flexible credit facilities enable timely closings and bolt-ons, often shortening private-debt close times to under 60 days.
Financing partners support covenant structures adapted to industrial cycles, and access to debt expands ROIC without over-diluting equity.
Legal, tax, and compliance advisors
Engage specialized counsel for complex carve-outs and multi-jurisdictional deals to manage legal risk and transaction mechanics; targeted tax structuring—noting US statutory corporate tax remains 21% in 2024—improves after-tax returns and repatriation efficiency. Compliance and ESG partners mitigate regulatory exposure across portfolio companies, and their diligence accelerates approvals and integration readiness.
- Carve-out counsel: cross-border expertise
- Tax structuring: optimize post-tax cash flow (US corp rate 21% in 2024)
- Compliance/ESG: reduce regulatory delay
Technology and industrial vendors
Form vendor alliances to standardize systems across portfolio companies, driving preferred agreements that can lower unit costs by up to 20% and lift service SLAs to enterprise targets such as 99.9% uptime. Co-innovation with OEMs accelerates modernization and digitalization, shortening rollout timelines and lowering integration risk. Shared platforms create scale advantages in procurement and maintenance, consolidating spend and reducing total cost of ownership.
- Preferred pricing: up to 20% unit-cost reduction
- SLAs: target 99.9%+ uptime
- Co-innovation: faster modernization cycles
- Scale: consolidated procurement and lower TCO
Partner network accelerates middle-market industrial tech deals with rapid EBITDA uplift
Partner network sources middle-market industrial-tech deals (EV $10M–$500M) with advisor success fees 2–4% and pipeline visibility. Operating partners drive 5–20% EBITDA uplift and 1–4% working-capital cuts in first 100 days. Financing partners (private credit AUM ~$1.2T in 2023) and flexible facilities shorten close times <60 days; vendors cut unit costs up to 20% and target 99.9% uptime.
| Partner | Role | Key 2024 Metric |
|---|---|---|
| Boutique banks/advisors | Deal sourcing | Fees 2–4% |
| Operating partners | PMI | EBITDA +5–20% |
| Financiers | Debt | Close <60d; private credit $1.2T |
| Vendors/OEMs | Scale | Cost ↓ up to 20%; SLA 99.9% |
What is included in the product
Detailed Word Document
A comprehensive Business Model Canvas for Crossroads Systems mapping customer segments, channels, value propositions, revenue streams and key resources across the 9 classic BMC blocks with actionable narratives. Includes competitive-advantage analysis, SWOT linkage and a polished format for presentations and investor discussions.
Customizable Excel Spreadsheet
High-level, editable business model that condenses Crossroads Systems' strategy into a one-page snapshot, quickly surfacing operational pain points and saving teams hours of restructuring for board-ready discussions and fast decision-making.
Activities
Target sourcing & screening
Continuously identify established industrial-tech businesses with defensible niches and growth potential, targeting a top-of-funnel of 200+ screened opportunities annually to offset sector cyclicality. Apply disciplined investment theses and scorecards to qualify deals, emphasizing EBITDA defensibility and 10-15%+ organic growth potential. Maintain focus on proprietary and limited-auction processes, leveraging a private equity market with roughly $2.0 trillion dry powder in 2024.
Financial & operational diligence
Conduct deep dives into quality of earnings, unit economics and operational levers to isolate recurring revenue and normalize one-time adjustments as of 2024. Validate backlog, customer concentration and pricing power, flagging reliance where a small cohort drives outsized revenue. Assess leadership bench and culture fit for integration readiness and turnover risk. Build 100-day plans with quantified value-creation initiatives tied to EBITDA and cash conversion targets.
Deal structuring & execution
Structure deals with cash, earnouts and seller notes to align incentives; practice targets in 2024 favored earnouts for 10-30% of consideration. Optimize capital stack toward 4–5x EBITDA leverage with a 10–20% equity cushion to boost resilience and return. Manage closing workflows, approvals and transition services tightly, and lock key talent with 12–24 month retention packages worth ~15–25% of total comp.
Post-merger integration
Standardize KPIs, monthly reporting cadence, and unified governance across portfolio companies to address the common 70% failure rate in synergy realization; implement shared finance, HR, and IT services to target ~10–20% SG&A reduction and roll out pricing, procurement (2–5% savings), and working-capital programs (1–3 days DSO improvement).
- Standard KPIs; monthly dashboards
- Shared services: finance/HR/IT ≈10–20% savings
- Procurement: 2–5% savings
- Working capital: 1–3 days DSO
- Track synergy capture; course-correct weekly
Portfolio optimization & exits
Portfolio optimization focuses on operational excellence and digital upgrades to lift margins and drive continuous improvement, targeting tuck-in acquisitions to consolidate niches and achieve scale.
Capital is recycled via partial or full exits once value targets are met, with transparent shareholder communications on performance and outlook; private equity dry powder was about $2.3 trillion in 2024 per Preqin.
- Operational excellence & digital upgrades
- Tuck-in acquisitions
- Recycle capital through exits
- Transparent shareholder reporting
Industrial-tech buyout play: Source 200+ targets, 4-5x leverage, capture 10-20% SG&A savings
Source 200+ industrial-tech targets annually; score for EBITDA defensibility and 10–15%+ organic growth. Perform QoE, unit-economics, backlog and leadership diligence; build 100-day EBITDA/cash plans. Use 4–5x leverage, 10–20% equity cushion; prefer 10–30% earnouts and 12–24 month retention (15–25% comp). Standardize KPIs, shared services and procurement to capture 10–20% SG&A and 2–5% procurement savings.
| Metric | 2024 Value |
|---|---|
| Deal funnel | 200+ |
| PE dry powder | $2.3T (Preqin) |
| Leverage | 4–5x EBITDA |
| Equity cushion | 10–20% |
| Earnouts | 10–30% |
| Retention | 12–24 mo / 15–25% comp |
| SG&A savings | 10–20% |
| Procurement savings | 2–5% |
Full Document Unlocks After Purchase
Business Model Canvas
The document previewed here is the exact Crossroads Systems Business Model Canvas you will receive after purchase. It’s not a mockup—this file contains the same content, structure, and formatting visible in the preview. After buying, you’ll download the complete, editable document ready for presentation and use.
Description
Unlock the strategic playbook with a concise, editable Business Model Canvas
Unlock Crossroads Systems’s strategic playbook with our full Business Model Canvas—three to five minutes to read, a lifetime of insight for strategy and investment decisions. This concise, editable canvas maps customer segments, value propositions, channels, and revenue streams with company-specific analysis. Download the Word and Excel files to benchmark, plan, or pitch with confidence—get the complete document now.
Partnerships
Middle-market M&A advisors
Partner with boutique investment banks and buy-side brokers to source proprietary industrial-tech deals in the middle market (EV $10M–$500M). Advisors deliver pipeline visibility, valuation comps and end-to-end process management, and long-term relationships raise deal-flow quality and speed. Success fees, typically 2–4% of deal value, align incentives to disciplined acquisition criteria.
Operating executives & integration firms
Collaborate with seasoned operators and PMI specialists to execute value-creation plans focused on the first 100 days post-close. They deploy playbooks that have driven EBITDA uplifts of 5–20% and working-capital reductions of 1–4% of revenue in comparable 2024 transactions. Contracted operating partners de-risk execution in that window. Incentives are structured to tie materially to EBITDA uplift and cash-conversion improvements.
Lenders & private credit funds
Maintain relationships with banks and non-bank lenders for acquisition financing; private credit AUM exceeded $1.2 trillion in 2023 (Preqin), expanding available capital.
Flexible credit facilities enable timely closings and bolt-ons, often shortening private-debt close times to under 60 days.
Financing partners support covenant structures adapted to industrial cycles, and access to debt expands ROIC without over-diluting equity.
Legal, tax, and compliance advisors
Engage specialized counsel for complex carve-outs and multi-jurisdictional deals to manage legal risk and transaction mechanics; targeted tax structuring—noting US statutory corporate tax remains 21% in 2024—improves after-tax returns and repatriation efficiency. Compliance and ESG partners mitigate regulatory exposure across portfolio companies, and their diligence accelerates approvals and integration readiness.
- Carve-out counsel: cross-border expertise
- Tax structuring: optimize post-tax cash flow (US corp rate 21% in 2024)
- Compliance/ESG: reduce regulatory delay
Technology and industrial vendors
Form vendor alliances to standardize systems across portfolio companies, driving preferred agreements that can lower unit costs by up to 20% and lift service SLAs to enterprise targets such as 99.9% uptime. Co-innovation with OEMs accelerates modernization and digitalization, shortening rollout timelines and lowering integration risk. Shared platforms create scale advantages in procurement and maintenance, consolidating spend and reducing total cost of ownership.
- Preferred pricing: up to 20% unit-cost reduction
- SLAs: target 99.9%+ uptime
- Co-innovation: faster modernization cycles
- Scale: consolidated procurement and lower TCO
Partner network accelerates middle-market industrial tech deals with rapid EBITDA uplift
Partner network sources middle-market industrial-tech deals (EV $10M–$500M) with advisor success fees 2–4% and pipeline visibility. Operating partners drive 5–20% EBITDA uplift and 1–4% working-capital cuts in first 100 days. Financing partners (private credit AUM ~$1.2T in 2023) and flexible facilities shorten close times <60 days; vendors cut unit costs up to 20% and target 99.9% uptime.
| Partner | Role | Key 2024 Metric |
|---|---|---|
| Boutique banks/advisors | Deal sourcing | Fees 2–4% |
| Operating partners | PMI | EBITDA +5–20% |
| Financiers | Debt | Close <60d; private credit $1.2T |
| Vendors/OEMs | Scale | Cost ↓ up to 20%; SLA 99.9% |
What is included in the product
Detailed Word Document
A comprehensive Business Model Canvas for Crossroads Systems mapping customer segments, channels, value propositions, revenue streams and key resources across the 9 classic BMC blocks with actionable narratives. Includes competitive-advantage analysis, SWOT linkage and a polished format for presentations and investor discussions.
Customizable Excel Spreadsheet
High-level, editable business model that condenses Crossroads Systems' strategy into a one-page snapshot, quickly surfacing operational pain points and saving teams hours of restructuring for board-ready discussions and fast decision-making.
Activities
Target sourcing & screening
Continuously identify established industrial-tech businesses with defensible niches and growth potential, targeting a top-of-funnel of 200+ screened opportunities annually to offset sector cyclicality. Apply disciplined investment theses and scorecards to qualify deals, emphasizing EBITDA defensibility and 10-15%+ organic growth potential. Maintain focus on proprietary and limited-auction processes, leveraging a private equity market with roughly $2.0 trillion dry powder in 2024.
Financial & operational diligence
Conduct deep dives into quality of earnings, unit economics and operational levers to isolate recurring revenue and normalize one-time adjustments as of 2024. Validate backlog, customer concentration and pricing power, flagging reliance where a small cohort drives outsized revenue. Assess leadership bench and culture fit for integration readiness and turnover risk. Build 100-day plans with quantified value-creation initiatives tied to EBITDA and cash conversion targets.
Deal structuring & execution
Structure deals with cash, earnouts and seller notes to align incentives; practice targets in 2024 favored earnouts for 10-30% of consideration. Optimize capital stack toward 4–5x EBITDA leverage with a 10–20% equity cushion to boost resilience and return. Manage closing workflows, approvals and transition services tightly, and lock key talent with 12–24 month retention packages worth ~15–25% of total comp.
Post-merger integration
Standardize KPIs, monthly reporting cadence, and unified governance across portfolio companies to address the common 70% failure rate in synergy realization; implement shared finance, HR, and IT services to target ~10–20% SG&A reduction and roll out pricing, procurement (2–5% savings), and working-capital programs (1–3 days DSO improvement).
- Standard KPIs; monthly dashboards
- Shared services: finance/HR/IT ≈10–20% savings
- Procurement: 2–5% savings
- Working capital: 1–3 days DSO
- Track synergy capture; course-correct weekly
Portfolio optimization & exits
Portfolio optimization focuses on operational excellence and digital upgrades to lift margins and drive continuous improvement, targeting tuck-in acquisitions to consolidate niches and achieve scale.
Capital is recycled via partial or full exits once value targets are met, with transparent shareholder communications on performance and outlook; private equity dry powder was about $2.3 trillion in 2024 per Preqin.
- Operational excellence & digital upgrades
- Tuck-in acquisitions
- Recycle capital through exits
- Transparent shareholder reporting
Industrial-tech buyout play: Source 200+ targets, 4-5x leverage, capture 10-20% SG&A savings
Source 200+ industrial-tech targets annually; score for EBITDA defensibility and 10–15%+ organic growth. Perform QoE, unit-economics, backlog and leadership diligence; build 100-day EBITDA/cash plans. Use 4–5x leverage, 10–20% equity cushion; prefer 10–30% earnouts and 12–24 month retention (15–25% comp). Standardize KPIs, shared services and procurement to capture 10–20% SG&A and 2–5% procurement savings.
| Metric | 2024 Value |
|---|---|
| Deal funnel | 200+ |
| PE dry powder | $2.3T (Preqin) |
| Leverage | 4–5x EBITDA |
| Equity cushion | 10–20% |
| Earnouts | 10–30% |
| Retention | 12–24 mo / 15–25% comp |
| SG&A savings | 10–20% |
| Procurement savings | 2–5% |
Full Document Unlocks After Purchase
Business Model Canvas
The document previewed here is the exact Crossroads Systems Business Model Canvas you will receive after purchase. It’s not a mockup—this file contains the same content, structure, and formatting visible in the preview. After buying, you’ll download the complete, editable document ready for presentation and use.











