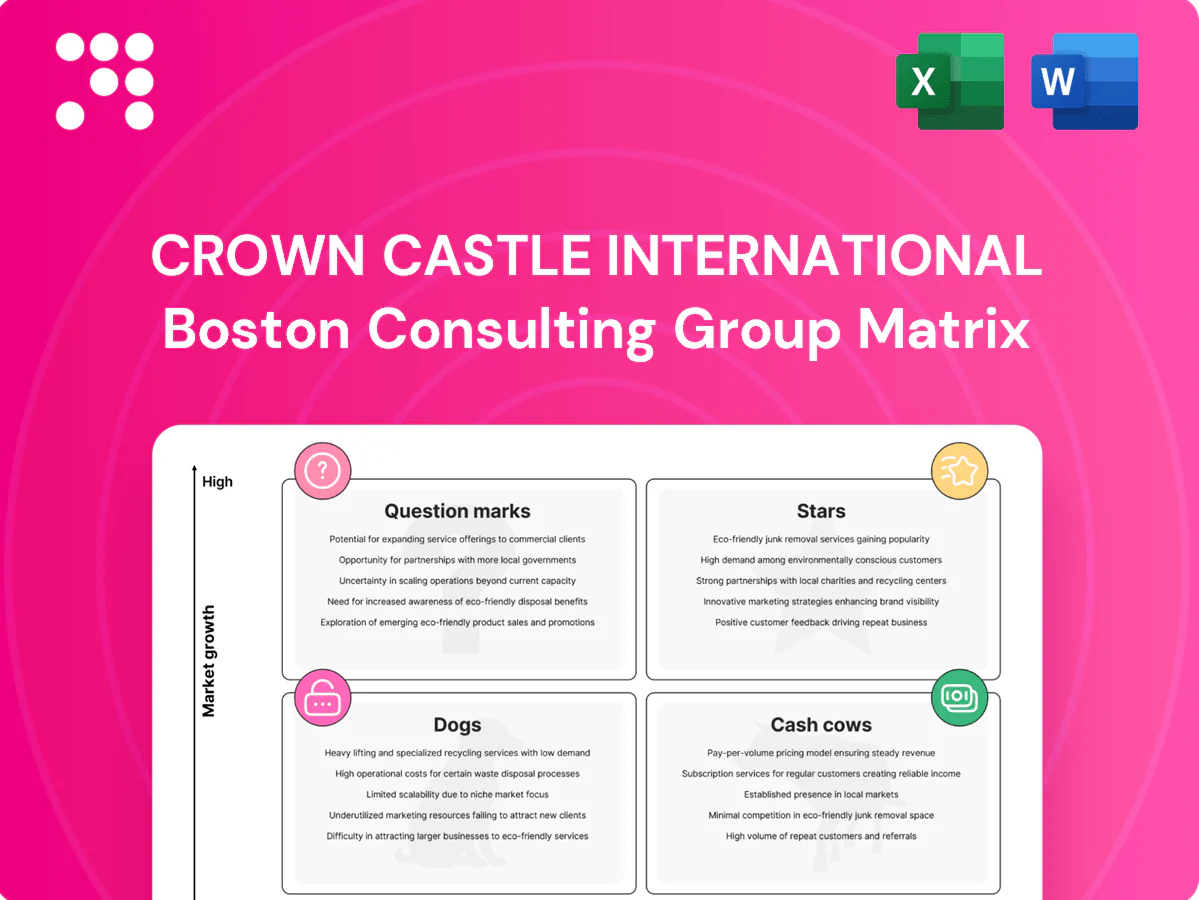
Crown Castle International Boston Consulting Group Matrix

Actionable Strategy Starts Here
Crown Castle’s preview BCG Matrix teases how its towers, small cells, and fiber assets stack up—who’s a Cash Cow, who’s a Question Mark, and where growth really lies. Want the full picture? Purchase the complete BCG Matrix for quadrant-by-quadrant placements, data-backed recommendations, and ready-to-use Word and Excel files to guide your next capital move.
Stars

Dense urban small-cell networks
Dense urban small-cell networks are a high-share asset for Crown Castle in core US metros where carriers are racing to densify; the company operates about 70,000 small cells across key markets (2024). Revenue per node scales materially as second and third tenants attach, boosting site yields by roughly 30–40% versus single-tenant sites. Growth is hot as 5G capacity needs spike on busy streets, so keep investing in permits, power connections, and faster turn-ups to remain the default choice.
Fiber-fed small-cell corridors
Owned fiber — roughly 85,000 route miles in 2024 — plus node rights form CCI’s moat; carriers lighting new 5G spectrum prioritize ready corridors over slow builds. CCI’s integrated fiber-plus-node rollouts shorten deployment cycles, winning speed and share against pure-play contractors. Cash-in equals cash-out today as capex-heavy builds persist, but revenue and tenancy slope is trending upward.

Neutral-host small cells for multi-carrier
Neutral-host small cells let carriers split baseband and RF shelter costs, cutting carrier capex by up to 30% and boosting Crown Castle International yields as site-level EBITDA scales. Once the first tenant is live, adding a second often doubles site-level ROI by amortizing fixed costs across tenants. Rapid urban mobile traffic growth (~30% YoY in 2024) drives utilization higher; standardized designs and playbook deployments protect CCI’s lead.

High-demand transport for 5G mid-band
High-demand transport for 5G mid-band requires dense, low-latency backhaul—exactly where Crown Castle’s footprint is thick, with about 85,000 route miles of fiber and ~40,000 towers across 80+ U.S. metros (2024). Carriers pay premiums for predictable SLAs and known routes, favoring CCI’s entrenched intercity rings. The mid-band market is expanding rapidly; CCI should keep investing in capacity and rings near hotspot metros to capture rising carrier spend.
- Density: footprint aligns with mid-band backhaul needs
- SLA: carriers prioritize predictable routes
- Scale: 85,000 route miles, ~40,000 towers (2024)
- Action: expand capacity and intercity rings near hotspots
Strategic metro franchises (NYC, LA, Houston, etc.)
Strategic metro franchises in NYC, LA, Houston leverage Crown Castle’s scale—about 40,000 towers and ~85,000 route-miles of fiber (2024)—with entrenched brand, operator relationships and permitting advantages that are hard to replicate; market share is high, new small-cell and fiber projects remain queued, and scale drives falling unit costs as deployments grow.
- High entry barriers
- Market share concentration
- Pipeline of projects
- Economies of scale
- Transition to Cash Cow
5G mid-band drove ~30% YoY traffic, lifting tenancy and site yields
Dense urban small-cell and fiber corridors are Crown Castle’s Stars: ~70,000 small cells, ~85,000 route-miles of fiber and ~40,000 towers (2024). Rapid 5G mid-band demand drove ~30% mobile traffic growth YoY (2024), boosting tenancy and site yields ~30–40% with multi-tenant attachments. Continued capex secures market share and transitions these Stars toward Cash Cow as tenancy matures.
| Metric | 2024 |
|---|---|
| Small cells | ~70,000 |
| Fiber route-miles | ~85,000 |
| Towers | ~40,000 |
| Traffic growth | ~30% YoY |
| Site yield lift | 30–40% |
What is included in the product
 Detailed Word Document
Comprehensive BCG Matrix review of Crown Castle’s towers, small cells and fiber — strategic calls on invest, hold or divest per quadrant.

 Customizable Excel Spreadsheet
One-page BCG matrix for Crown Castle International—clarifies portfolio pain points at a glance, export-ready for C-level decks
Cash Cows

Macro towers with multi-tenant leases
Classic REIT engine: long-term, triple-net tower leases with built-in escalators and low churn underpin stable cash flow across Crown Castle’s ~40,000 towers and ~85,000 route miles of fiber (2024). Adding second and third tenants on towers materially expands EBITDA margins per site. Growth is modest—mid-single-digit leasing/organic growth—but highly predictable. Strategy: milk cash, reinvest for uptime and network reliability.
Amendments and colocation on existing towers
New radios and extra antennas on existing steel deliver high-margin add-ons; industry reports show colocation incremental margins above 60% in 2024, so paperwork, not concrete, drives revenue. The tower market is mature but demand stays steady as 5G refresh cycles continue in 2024. Lean operations and predictable attachment economics convert these amendments and colocations into dependable free cash flow.

Owned land or long-dated ground leases
Control of owned land or long-dated ground leases under Crown Castle towers cuts rent exposure and improves site-level economics, leveraging the companys ~40,000 towers and ~85,000 route miles of fiber (2024). Minimal incremental capex preserves persistent value as these sites generate steady cash flow. They quietly print money, and proceeds fund higher-growth small cell and fiber builds.

Recurring maintenance and managed services
Recurring maintenance and managed services are classic cash cows: keep-lights-on work under contracted SLAs with low growth but sticky relationships and high renewal rates; Crown Castle reported roughly $8.1B revenue in 2024 and operates ~40,000 towers and ~85,000 route miles of fiber, making churn costly for customers and limiting competition once embedded.
- SLAs
- Low growth, high stickiness
- Renewal rates >90% (enterprise telecom norms)
- Efficient crews → higher route density & margins
Backhaul on established metro fiber
Backhaul on established metro fiber leverages existing strands serving known carrier routes, with traffic growth in the mid-single digits and churn typically under 3% annually; tight SLAs justify rational pricing and premiums, and the asset throws off steady cash with limited incremental capex, supporting high free-cash-flow generation in 2024.
- Known routes, existing strands
- Traffic +mid-single % (2024)
- Churn <3% (2024)
- Pricing premium for tight SLAs
- Low incremental capex, strong FCF
~40,000 towers, ~85,000 fiber miles - 2024 revenue $8.1B
~40,000 towers and ~85,000 route miles of fiber (2024) produce stable cash; 2024 revenue ~$8.1B. Colocation yields >60% incremental margins; renewals >90%, traffic +mid-single% and churn <3%. Low incremental capex funds small-cell and fiber expansion.
| Metric | 2024 |
|---|---|
| Towers | ~40,000 |
| Fiber | ~85,000 route miles |
| Revenue | $8.1B |
| Coloc margin | >60% |
| Renewals | >90% |
Full Transparency, Always
Crown Castle International BCG Matrix
The file you're previewing is the exact Crown Castle International BCG Matrix you'll receive after purchase. No watermarks, no placeholders—just a fully formatted, analysis-ready report built for decision makers. It arrives immediately and is editable, printable, and presentation-ready. Buy once and use it across strategy sessions, investor decks, or competitive reviews.

Actionable Strategy Starts Here
Crown Castle’s preview BCG Matrix teases how its towers, small cells, and fiber assets stack up—who’s a Cash Cow, who’s a Question Mark, and where growth really lies. Want the full picture? Purchase the complete BCG Matrix for quadrant-by-quadrant placements, data-backed recommendations, and ready-to-use Word and Excel files to guide your next capital move.
Stars
Dense urban small-cell networks
Dense urban small-cell networks are a high-share asset for Crown Castle in core US metros where carriers are racing to densify; the company operates about 70,000 small cells across key markets (2024). Revenue per node scales materially as second and third tenants attach, boosting site yields by roughly 30–40% versus single-tenant sites. Growth is hot as 5G capacity needs spike on busy streets, so keep investing in permits, power connections, and faster turn-ups to remain the default choice.
Fiber-fed small-cell corridors
Owned fiber — roughly 85,000 route miles in 2024 — plus node rights form CCI’s moat; carriers lighting new 5G spectrum prioritize ready corridors over slow builds. CCI’s integrated fiber-plus-node rollouts shorten deployment cycles, winning speed and share against pure-play contractors. Cash-in equals cash-out today as capex-heavy builds persist, but revenue and tenancy slope is trending upward.
Neutral-host small cells for multi-carrier
Neutral-host small cells let carriers split baseband and RF shelter costs, cutting carrier capex by up to 30% and boosting Crown Castle International yields as site-level EBITDA scales. Once the first tenant is live, adding a second often doubles site-level ROI by amortizing fixed costs across tenants. Rapid urban mobile traffic growth (~30% YoY in 2024) drives utilization higher; standardized designs and playbook deployments protect CCI’s lead.
High-demand transport for 5G mid-band
High-demand transport for 5G mid-band requires dense, low-latency backhaul—exactly where Crown Castle’s footprint is thick, with about 85,000 route miles of fiber and ~40,000 towers across 80+ U.S. metros (2024). Carriers pay premiums for predictable SLAs and known routes, favoring CCI’s entrenched intercity rings. The mid-band market is expanding rapidly; CCI should keep investing in capacity and rings near hotspot metros to capture rising carrier spend.
- Density: footprint aligns with mid-band backhaul needs
- SLA: carriers prioritize predictable routes
- Scale: 85,000 route miles, ~40,000 towers (2024)
- Action: expand capacity and intercity rings near hotspots
Strategic metro franchises (NYC, LA, Houston, etc.)
Strategic metro franchises in NYC, LA, Houston leverage Crown Castle’s scale—about 40,000 towers and ~85,000 route-miles of fiber (2024)—with entrenched brand, operator relationships and permitting advantages that are hard to replicate; market share is high, new small-cell and fiber projects remain queued, and scale drives falling unit costs as deployments grow.
- High entry barriers
- Market share concentration
- Pipeline of projects
- Economies of scale
- Transition to Cash Cow
5G mid-band drove ~30% YoY traffic, lifting tenancy and site yields
Dense urban small-cell and fiber corridors are Crown Castle’s Stars: ~70,000 small cells, ~85,000 route-miles of fiber and ~40,000 towers (2024). Rapid 5G mid-band demand drove ~30% mobile traffic growth YoY (2024), boosting tenancy and site yields ~30–40% with multi-tenant attachments. Continued capex secures market share and transitions these Stars toward Cash Cow as tenancy matures.
| Metric | 2024 |
|---|---|
| Small cells | ~70,000 |
| Fiber route-miles | ~85,000 |
| Towers | ~40,000 |
| Traffic growth | ~30% YoY |
| Site yield lift | 30–40% |
What is included in the product
Detailed Word Document
Comprehensive BCG Matrix review of Crown Castle’s towers, small cells and fiber — strategic calls on invest, hold or divest per quadrant.
Customizable Excel Spreadsheet
One-page BCG matrix for Crown Castle International—clarifies portfolio pain points at a glance, export-ready for C-level decks
Cash Cows
Macro towers with multi-tenant leases
Classic REIT engine: long-term, triple-net tower leases with built-in escalators and low churn underpin stable cash flow across Crown Castle’s ~40,000 towers and ~85,000 route miles of fiber (2024). Adding second and third tenants on towers materially expands EBITDA margins per site. Growth is modest—mid-single-digit leasing/organic growth—but highly predictable. Strategy: milk cash, reinvest for uptime and network reliability.
Amendments and colocation on existing towers
New radios and extra antennas on existing steel deliver high-margin add-ons; industry reports show colocation incremental margins above 60% in 2024, so paperwork, not concrete, drives revenue. The tower market is mature but demand stays steady as 5G refresh cycles continue in 2024. Lean operations and predictable attachment economics convert these amendments and colocations into dependable free cash flow.
Owned land or long-dated ground leases
Control of owned land or long-dated ground leases under Crown Castle towers cuts rent exposure and improves site-level economics, leveraging the companys ~40,000 towers and ~85,000 route miles of fiber (2024). Minimal incremental capex preserves persistent value as these sites generate steady cash flow. They quietly print money, and proceeds fund higher-growth small cell and fiber builds.
Recurring maintenance and managed services
Recurring maintenance and managed services are classic cash cows: keep-lights-on work under contracted SLAs with low growth but sticky relationships and high renewal rates; Crown Castle reported roughly $8.1B revenue in 2024 and operates ~40,000 towers and ~85,000 route miles of fiber, making churn costly for customers and limiting competition once embedded.
- SLAs
- Low growth, high stickiness
- Renewal rates >90% (enterprise telecom norms)
- Efficient crews → higher route density & margins
Backhaul on established metro fiber
Backhaul on established metro fiber leverages existing strands serving known carrier routes, with traffic growth in the mid-single digits and churn typically under 3% annually; tight SLAs justify rational pricing and premiums, and the asset throws off steady cash with limited incremental capex, supporting high free-cash-flow generation in 2024.
- Known routes, existing strands
- Traffic +mid-single % (2024)
- Churn <3% (2024)
- Pricing premium for tight SLAs
- Low incremental capex, strong FCF
~40,000 towers, ~85,000 fiber miles - 2024 revenue $8.1B
~40,000 towers and ~85,000 route miles of fiber (2024) produce stable cash; 2024 revenue ~$8.1B. Colocation yields >60% incremental margins; renewals >90%, traffic +mid-single% and churn <3%. Low incremental capex funds small-cell and fiber expansion.
| Metric | 2024 |
|---|---|
| Towers | ~40,000 |
| Fiber | ~85,000 route miles |
| Revenue | $8.1B |
| Coloc margin | >60% |
| Renewals | >90% |
Full Transparency, Always
Crown Castle International BCG Matrix
The file you're previewing is the exact Crown Castle International BCG Matrix you'll receive after purchase. No watermarks, no placeholders—just a fully formatted, analysis-ready report built for decision makers. It arrives immediately and is editable, printable, and presentation-ready. Buy once and use it across strategy sessions, investor decks, or competitive reviews.
Description
Actionable Strategy Starts Here
Crown Castle’s preview BCG Matrix teases how its towers, small cells, and fiber assets stack up—who’s a Cash Cow, who’s a Question Mark, and where growth really lies. Want the full picture? Purchase the complete BCG Matrix for quadrant-by-quadrant placements, data-backed recommendations, and ready-to-use Word and Excel files to guide your next capital move.
Stars
Dense urban small-cell networks
Dense urban small-cell networks are a high-share asset for Crown Castle in core US metros where carriers are racing to densify; the company operates about 70,000 small cells across key markets (2024). Revenue per node scales materially as second and third tenants attach, boosting site yields by roughly 30–40% versus single-tenant sites. Growth is hot as 5G capacity needs spike on busy streets, so keep investing in permits, power connections, and faster turn-ups to remain the default choice.
Fiber-fed small-cell corridors
Owned fiber — roughly 85,000 route miles in 2024 — plus node rights form CCI’s moat; carriers lighting new 5G spectrum prioritize ready corridors over slow builds. CCI’s integrated fiber-plus-node rollouts shorten deployment cycles, winning speed and share against pure-play contractors. Cash-in equals cash-out today as capex-heavy builds persist, but revenue and tenancy slope is trending upward.
Neutral-host small cells for multi-carrier
Neutral-host small cells let carriers split baseband and RF shelter costs, cutting carrier capex by up to 30% and boosting Crown Castle International yields as site-level EBITDA scales. Once the first tenant is live, adding a second often doubles site-level ROI by amortizing fixed costs across tenants. Rapid urban mobile traffic growth (~30% YoY in 2024) drives utilization higher; standardized designs and playbook deployments protect CCI’s lead.
High-demand transport for 5G mid-band
High-demand transport for 5G mid-band requires dense, low-latency backhaul—exactly where Crown Castle’s footprint is thick, with about 85,000 route miles of fiber and ~40,000 towers across 80+ U.S. metros (2024). Carriers pay premiums for predictable SLAs and known routes, favoring CCI’s entrenched intercity rings. The mid-band market is expanding rapidly; CCI should keep investing in capacity and rings near hotspot metros to capture rising carrier spend.
- Density: footprint aligns with mid-band backhaul needs
- SLA: carriers prioritize predictable routes
- Scale: 85,000 route miles, ~40,000 towers (2024)
- Action: expand capacity and intercity rings near hotspots
Strategic metro franchises (NYC, LA, Houston, etc.)
Strategic metro franchises in NYC, LA, Houston leverage Crown Castle’s scale—about 40,000 towers and ~85,000 route-miles of fiber (2024)—with entrenched brand, operator relationships and permitting advantages that are hard to replicate; market share is high, new small-cell and fiber projects remain queued, and scale drives falling unit costs as deployments grow.
- High entry barriers
- Market share concentration
- Pipeline of projects
- Economies of scale
- Transition to Cash Cow
5G mid-band drove ~30% YoY traffic, lifting tenancy and site yields
Dense urban small-cell and fiber corridors are Crown Castle’s Stars: ~70,000 small cells, ~85,000 route-miles of fiber and ~40,000 towers (2024). Rapid 5G mid-band demand drove ~30% mobile traffic growth YoY (2024), boosting tenancy and site yields ~30–40% with multi-tenant attachments. Continued capex secures market share and transitions these Stars toward Cash Cow as tenancy matures.
| Metric | 2024 |
|---|---|
| Small cells | ~70,000 |
| Fiber route-miles | ~85,000 |
| Towers | ~40,000 |
| Traffic growth | ~30% YoY |
| Site yield lift | 30–40% |
What is included in the product
Detailed Word Document
Comprehensive BCG Matrix review of Crown Castle’s towers, small cells and fiber — strategic calls on invest, hold or divest per quadrant.
Customizable Excel Spreadsheet
One-page BCG matrix for Crown Castle International—clarifies portfolio pain points at a glance, export-ready for C-level decks
Cash Cows
Macro towers with multi-tenant leases
Classic REIT engine: long-term, triple-net tower leases with built-in escalators and low churn underpin stable cash flow across Crown Castle’s ~40,000 towers and ~85,000 route miles of fiber (2024). Adding second and third tenants on towers materially expands EBITDA margins per site. Growth is modest—mid-single-digit leasing/organic growth—but highly predictable. Strategy: milk cash, reinvest for uptime and network reliability.
Amendments and colocation on existing towers
New radios and extra antennas on existing steel deliver high-margin add-ons; industry reports show colocation incremental margins above 60% in 2024, so paperwork, not concrete, drives revenue. The tower market is mature but demand stays steady as 5G refresh cycles continue in 2024. Lean operations and predictable attachment economics convert these amendments and colocations into dependable free cash flow.
Owned land or long-dated ground leases
Control of owned land or long-dated ground leases under Crown Castle towers cuts rent exposure and improves site-level economics, leveraging the companys ~40,000 towers and ~85,000 route miles of fiber (2024). Minimal incremental capex preserves persistent value as these sites generate steady cash flow. They quietly print money, and proceeds fund higher-growth small cell and fiber builds.
Recurring maintenance and managed services
Recurring maintenance and managed services are classic cash cows: keep-lights-on work under contracted SLAs with low growth but sticky relationships and high renewal rates; Crown Castle reported roughly $8.1B revenue in 2024 and operates ~40,000 towers and ~85,000 route miles of fiber, making churn costly for customers and limiting competition once embedded.
- SLAs
- Low growth, high stickiness
- Renewal rates >90% (enterprise telecom norms)
- Efficient crews → higher route density & margins
Backhaul on established metro fiber
Backhaul on established metro fiber leverages existing strands serving known carrier routes, with traffic growth in the mid-single digits and churn typically under 3% annually; tight SLAs justify rational pricing and premiums, and the asset throws off steady cash with limited incremental capex, supporting high free-cash-flow generation in 2024.
- Known routes, existing strands
- Traffic +mid-single % (2024)
- Churn <3% (2024)
- Pricing premium for tight SLAs
- Low incremental capex, strong FCF
~40,000 towers, ~85,000 fiber miles - 2024 revenue $8.1B
~40,000 towers and ~85,000 route miles of fiber (2024) produce stable cash; 2024 revenue ~$8.1B. Colocation yields >60% incremental margins; renewals >90%, traffic +mid-single% and churn <3%. Low incremental capex funds small-cell and fiber expansion.
| Metric | 2024 |
|---|---|
| Towers | ~40,000 |
| Fiber | ~85,000 route miles |
| Revenue | $8.1B |
| Coloc margin | >60% |
| Renewals | >90% |
Full Transparency, Always
Crown Castle International BCG Matrix
The file you're previewing is the exact Crown Castle International BCG Matrix you'll receive after purchase. No watermarks, no placeholders—just a fully formatted, analysis-ready report built for decision makers. It arrives immediately and is editable, printable, and presentation-ready. Buy once and use it across strategy sessions, investor decks, or competitive reviews.











