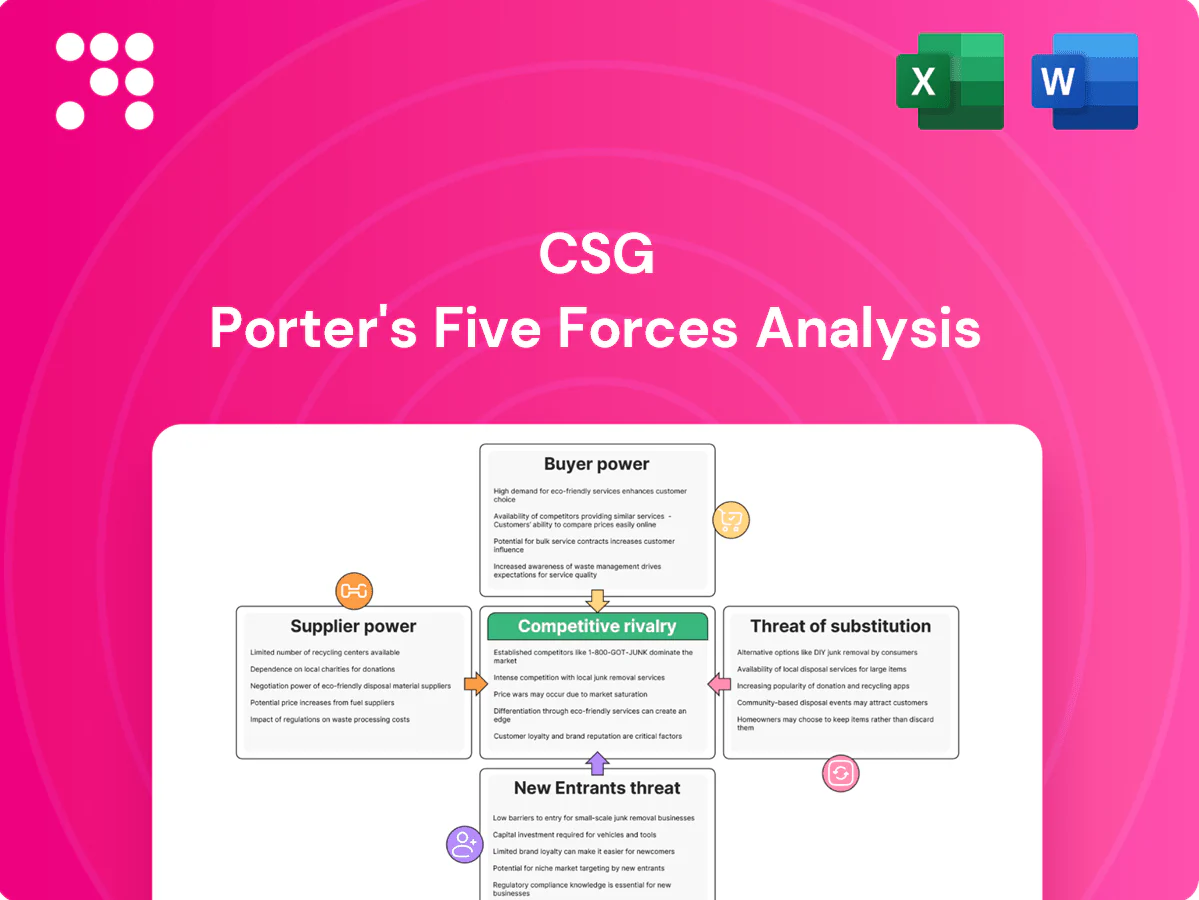
CSG Porter's Five Forces Analysis

Go Beyond the Preview—Access the Full Strategic Report
CSG’s Porter's Five Forces snapshot highlights competitive rivalry, supplier and buyer power, barriers to entry, and substitute threats shaping its niche. We outline strategic implications and risk areas to watch. This preview scratches the surface—unlock the full report for force-by-force ratings, visuals, and actionable recommendations.
Suppliers Bargaining Power

Scarce domain talent
Specialized BSS/OSS engineers, architects and data scientists are scarce, with 54% of employers reporting talent shortages in 2024 (ManpowerGroup), driving wage inflation and higher attrition risk. Niche suppliers command premiums and can pick engagements, raising vendor bargaining power. CSG must invest in training, retention and a nearshore/offshore mix to mitigate. Long delivery cycles amplify exposure to these bottlenecks.
Hyperscaler leverage
Dependence on AWS (≈32% market share), Azure (≈23%) and GCP (≈11%) in 2024 concentrates supplier power for CSG, especially for infra, DB and AI platform services. Pricing moves, egress fees (AWS data transfer out ≈ $0.09/GB for first 10TB) and reserved-instance/savings-plan dynamics (discounts up to 72%) can swing margins. Co-sell programs boost revenue reach but deepen strategic lock-in. Multi-cloud lowers vendor risk yet raises architecture complexity and operating cost.

Proprietary components
Licences for databases, middleware and analytics create high switching costs and vendor power, with audits and version-support windows commonly forcing upgrades on 12–24 month timelines. Negotiating enterprise agreements is critical to retain flexibility and can reduce upgrade spend by roughly 10–15% in large accounts. Open-source substitution is rising (about 50% adoption in 2024) but requires enterprise hardening and support to match proprietary SLAs.

Data and AI dependencies
Third-party data sets, APIs, and model providers materially shape CSGs feature velocity and unit economics; licensed datasets often cost >$100k/year and 2024 fine-tuning estimates range $100k–$1M, while API usage can more than double platform costs as customers scale. Model drift and tightening compliance (2024 regulatory guidance) tether CSG to vendors’ roadmaps. Building internal capabilities reduces supplier power but demands sustained multi-year investment.
- Data cost >$100k/yr
- Fine-tune $100k–$1M (2024)
- API usage can >2x costs
- Internal build ⇒ multi-year capex
SI and channel influence
- SI-driven selection: SIs influence enterprise architecture and vendor choice
- Partner tiers: preferred status can sway pricing and deal awards
- Margin/ownership: SIs gain leverage over scope, timelines, and margins
- Enablement/IP: joint IP and training reduce single-partner risk
Suppliers dominate: 54% talent shortage, cloud lock-in and soaring data/fine-tune costs
Suppliers hold elevated power: talent shortages (54% in 2024) and niche specialists drive wage inflation and attrition. Cloud concentration (AWS ≈32%, Azure ≈23%, GCP ≈11%) and license/legal lock‑in raise switching costs. Data/APIs (> $100k/yr) and fine‑tune spend ($100k–$1M) can double unit costs; SIs steer large deals.
| Metric | 2024 |
|---|---|
| Talent shortage | 54% |
| AWS/Azure/GCP | 32%/23%/11% |
| Data cost | > $100k/yr |
| Fine‑tune | $100k–$1M |
What is included in the product
 Detailed Word Document
Concise Porter's Five Forces analysis tailored to CSG that uncovers competitive drivers, supplier and buyer power, substitution risks, and barriers to entry, identifies emerging threats and disruptive substitutes, and offers strategic insights to inform investor materials, internal strategy, and academic use.

 Customizable Excel Spreadsheet
A single-sheet CSG Porter's Five Forces tool that instantly highlights strategic pressure points, customizable with your data or scenarios, no macros required—ready to drop into decks or dashboards for faster, clearer decision-making.
Customers Bargaining Power

Consolidated telco buyers
Large CSPs, cable MSOs and media groups wield consolidated procurement scale—RFP cycles often exceed 12 months and multi-year frameworks typically run 3–5 years, enabling sustained volume discounts. They demand outcome-based SLAs and penalty regimes often up to 5–10% of contract value, enforced via vendor scorecards. Regional consolidation means the top three buyers can represent over 50% of regional demand, further concentrating bargaining power.
High switching costs
Core billing and customer care migrations are risky and costly, with industry estimates in 2024 putting typical OSS/BSS projects in the $5–50m range and 12–36 month timelines, which moderates churn. Buyers frequently leverage the threat of switching to extract concessions without moving, prompting vendors to accept scope rebids. Proofs of concept and phased rollouts are used to rebid scope and derisk migration. Strong references and TCO evidence are the primary levers to resist discount pressure.

Demand for flexible pricing
By 2024, roughly 45% of enterprise buyers demand flexible pricing, pushing suppliers to absorb more risk as usage- and outcome-based models shift variability to vendors. Customers insist on elasticity, ramp schedules, and explicit price protections while benchmarking clauses can trigger midterm repricing. Clear unit economics and contractual guardrails are essential to control margin volatility and arbitrage.

Customization expectations
Buyers demand heavy configuration to map legacy processes, inflating scope and change control and often locking CSG into client-specific roadmaps; modular productization and extension frameworks cut bespoke work and speed delivery, while strict governance limits requirement creep and preserves strategic value.
- Clients drive bespoke scope
- Modularization reduces custom effort
- Extension frameworks enable reuse
- Governance curbs requirement creep
Insourcing and DIY options
- Insourcing reduces vendor leverage
- Point capabilities (charging/analytics/care) enable bargaining
- Co-creation converts DIY intent into joint value
Buyers dominate: top-3 >50%, RFPs >12 months, ~45% want usage pricing
Buyers concentrate power: top three customers can represent >50% regional demand, RFPs often >12 months and contracts run 3–5 years, enabling sustained discounts and 5–10% SLA penalty regimes. OSS/BSS migrations (2024) typically cost $5–50m and take 12–36 months, reducing churn and raising switching costs. By 2024 ~45% of enterprise buyers demand flexible/usage pricing, shifting risk to vendors and forcing modularization to protect margins.
| Metric | 2023/24 |
|---|---|
| Top-3 buyer share | >50% |
| RFP cycle | >12 months |
| Contract tenor | 3–5 years |
| OSS/BSS cost | $5–50m |
| OSS/BSS timeline | 12–36 months |
| SLA penalties | 5–10% |
| Buyers demanding flexible pricing | ~45% |
Preview the Actual Deliverable
CSG Porter's Five Forces Analysis
This preview shows the exact CSG Porter's Five Forces analysis you'll receive immediately after purchase—no samples or placeholders. The document is fully formatted, professionally written, and ready for download and use the moment you buy. You're viewing the final deliverable, available instantly upon payment.

Go Beyond the Preview—Access the Full Strategic Report
CSG’s Porter's Five Forces snapshot highlights competitive rivalry, supplier and buyer power, barriers to entry, and substitute threats shaping its niche. We outline strategic implications and risk areas to watch. This preview scratches the surface—unlock the full report for force-by-force ratings, visuals, and actionable recommendations.
Suppliers Bargaining Power
Scarce domain talent
Specialized BSS/OSS engineers, architects and data scientists are scarce, with 54% of employers reporting talent shortages in 2024 (ManpowerGroup), driving wage inflation and higher attrition risk. Niche suppliers command premiums and can pick engagements, raising vendor bargaining power. CSG must invest in training, retention and a nearshore/offshore mix to mitigate. Long delivery cycles amplify exposure to these bottlenecks.
Hyperscaler leverage
Dependence on AWS (≈32% market share), Azure (≈23%) and GCP (≈11%) in 2024 concentrates supplier power for CSG, especially for infra, DB and AI platform services. Pricing moves, egress fees (AWS data transfer out ≈ $0.09/GB for first 10TB) and reserved-instance/savings-plan dynamics (discounts up to 72%) can swing margins. Co-sell programs boost revenue reach but deepen strategic lock-in. Multi-cloud lowers vendor risk yet raises architecture complexity and operating cost.
Proprietary components
Licences for databases, middleware and analytics create high switching costs and vendor power, with audits and version-support windows commonly forcing upgrades on 12–24 month timelines. Negotiating enterprise agreements is critical to retain flexibility and can reduce upgrade spend by roughly 10–15% in large accounts. Open-source substitution is rising (about 50% adoption in 2024) but requires enterprise hardening and support to match proprietary SLAs.
Data and AI dependencies
Third-party data sets, APIs, and model providers materially shape CSGs feature velocity and unit economics; licensed datasets often cost >$100k/year and 2024 fine-tuning estimates range $100k–$1M, while API usage can more than double platform costs as customers scale. Model drift and tightening compliance (2024 regulatory guidance) tether CSG to vendors’ roadmaps. Building internal capabilities reduces supplier power but demands sustained multi-year investment.
- Data cost >$100k/yr
- Fine-tune $100k–$1M (2024)
- API usage can >2x costs
- Internal build ⇒ multi-year capex
SI and channel influence
- SI-driven selection: SIs influence enterprise architecture and vendor choice
- Partner tiers: preferred status can sway pricing and deal awards
- Margin/ownership: SIs gain leverage over scope, timelines, and margins
- Enablement/IP: joint IP and training reduce single-partner risk
Suppliers dominate: 54% talent shortage, cloud lock-in and soaring data/fine-tune costs
Suppliers hold elevated power: talent shortages (54% in 2024) and niche specialists drive wage inflation and attrition. Cloud concentration (AWS ≈32%, Azure ≈23%, GCP ≈11%) and license/legal lock‑in raise switching costs. Data/APIs (> $100k/yr) and fine‑tune spend ($100k–$1M) can double unit costs; SIs steer large deals.
| Metric | 2024 |
|---|---|
| Talent shortage | 54% |
| AWS/Azure/GCP | 32%/23%/11% |
| Data cost | > $100k/yr |
| Fine‑tune | $100k–$1M |
What is included in the product
Detailed Word Document
Concise Porter's Five Forces analysis tailored to CSG that uncovers competitive drivers, supplier and buyer power, substitution risks, and barriers to entry, identifies emerging threats and disruptive substitutes, and offers strategic insights to inform investor materials, internal strategy, and academic use.
Customizable Excel Spreadsheet
A single-sheet CSG Porter's Five Forces tool that instantly highlights strategic pressure points, customizable with your data or scenarios, no macros required—ready to drop into decks or dashboards for faster, clearer decision-making.
Customers Bargaining Power
Consolidated telco buyers
Large CSPs, cable MSOs and media groups wield consolidated procurement scale—RFP cycles often exceed 12 months and multi-year frameworks typically run 3–5 years, enabling sustained volume discounts. They demand outcome-based SLAs and penalty regimes often up to 5–10% of contract value, enforced via vendor scorecards. Regional consolidation means the top three buyers can represent over 50% of regional demand, further concentrating bargaining power.
High switching costs
Core billing and customer care migrations are risky and costly, with industry estimates in 2024 putting typical OSS/BSS projects in the $5–50m range and 12–36 month timelines, which moderates churn. Buyers frequently leverage the threat of switching to extract concessions without moving, prompting vendors to accept scope rebids. Proofs of concept and phased rollouts are used to rebid scope and derisk migration. Strong references and TCO evidence are the primary levers to resist discount pressure.
Demand for flexible pricing
By 2024, roughly 45% of enterprise buyers demand flexible pricing, pushing suppliers to absorb more risk as usage- and outcome-based models shift variability to vendors. Customers insist on elasticity, ramp schedules, and explicit price protections while benchmarking clauses can trigger midterm repricing. Clear unit economics and contractual guardrails are essential to control margin volatility and arbitrage.
Customization expectations
Buyers demand heavy configuration to map legacy processes, inflating scope and change control and often locking CSG into client-specific roadmaps; modular productization and extension frameworks cut bespoke work and speed delivery, while strict governance limits requirement creep and preserves strategic value.
- Clients drive bespoke scope
- Modularization reduces custom effort
- Extension frameworks enable reuse
- Governance curbs requirement creep
Insourcing and DIY options
- Insourcing reduces vendor leverage
- Point capabilities (charging/analytics/care) enable bargaining
- Co-creation converts DIY intent into joint value
Buyers dominate: top-3 >50%, RFPs >12 months, ~45% want usage pricing
Buyers concentrate power: top three customers can represent >50% regional demand, RFPs often >12 months and contracts run 3–5 years, enabling sustained discounts and 5–10% SLA penalty regimes. OSS/BSS migrations (2024) typically cost $5–50m and take 12–36 months, reducing churn and raising switching costs. By 2024 ~45% of enterprise buyers demand flexible/usage pricing, shifting risk to vendors and forcing modularization to protect margins.
| Metric | 2023/24 |
|---|---|
| Top-3 buyer share | >50% |
| RFP cycle | >12 months |
| Contract tenor | 3–5 years |
| OSS/BSS cost | $5–50m |
| OSS/BSS timeline | 12–36 months |
| SLA penalties | 5–10% |
| Buyers demanding flexible pricing | ~45% |
Preview the Actual Deliverable
CSG Porter's Five Forces Analysis
This preview shows the exact CSG Porter's Five Forces analysis you'll receive immediately after purchase—no samples or placeholders. The document is fully formatted, professionally written, and ready for download and use the moment you buy. You're viewing the final deliverable, available instantly upon payment.
Original: $10.00
-65%$10.00
$3.50Description
Go Beyond the Preview—Access the Full Strategic Report
CSG’s Porter's Five Forces snapshot highlights competitive rivalry, supplier and buyer power, barriers to entry, and substitute threats shaping its niche. We outline strategic implications and risk areas to watch. This preview scratches the surface—unlock the full report for force-by-force ratings, visuals, and actionable recommendations.
Suppliers Bargaining Power
Scarce domain talent
Specialized BSS/OSS engineers, architects and data scientists are scarce, with 54% of employers reporting talent shortages in 2024 (ManpowerGroup), driving wage inflation and higher attrition risk. Niche suppliers command premiums and can pick engagements, raising vendor bargaining power. CSG must invest in training, retention and a nearshore/offshore mix to mitigate. Long delivery cycles amplify exposure to these bottlenecks.
Hyperscaler leverage
Dependence on AWS (≈32% market share), Azure (≈23%) and GCP (≈11%) in 2024 concentrates supplier power for CSG, especially for infra, DB and AI platform services. Pricing moves, egress fees (AWS data transfer out ≈ $0.09/GB for first 10TB) and reserved-instance/savings-plan dynamics (discounts up to 72%) can swing margins. Co-sell programs boost revenue reach but deepen strategic lock-in. Multi-cloud lowers vendor risk yet raises architecture complexity and operating cost.
Proprietary components
Licences for databases, middleware and analytics create high switching costs and vendor power, with audits and version-support windows commonly forcing upgrades on 12–24 month timelines. Negotiating enterprise agreements is critical to retain flexibility and can reduce upgrade spend by roughly 10–15% in large accounts. Open-source substitution is rising (about 50% adoption in 2024) but requires enterprise hardening and support to match proprietary SLAs.
Data and AI dependencies
Third-party data sets, APIs, and model providers materially shape CSGs feature velocity and unit economics; licensed datasets often cost >$100k/year and 2024 fine-tuning estimates range $100k–$1M, while API usage can more than double platform costs as customers scale. Model drift and tightening compliance (2024 regulatory guidance) tether CSG to vendors’ roadmaps. Building internal capabilities reduces supplier power but demands sustained multi-year investment.
- Data cost >$100k/yr
- Fine-tune $100k–$1M (2024)
- API usage can >2x costs
- Internal build ⇒ multi-year capex
SI and channel influence
- SI-driven selection: SIs influence enterprise architecture and vendor choice
- Partner tiers: preferred status can sway pricing and deal awards
- Margin/ownership: SIs gain leverage over scope, timelines, and margins
- Enablement/IP: joint IP and training reduce single-partner risk
Suppliers dominate: 54% talent shortage, cloud lock-in and soaring data/fine-tune costs
Suppliers hold elevated power: talent shortages (54% in 2024) and niche specialists drive wage inflation and attrition. Cloud concentration (AWS ≈32%, Azure ≈23%, GCP ≈11%) and license/legal lock‑in raise switching costs. Data/APIs (> $100k/yr) and fine‑tune spend ($100k–$1M) can double unit costs; SIs steer large deals.
| Metric | 2024 |
|---|---|
| Talent shortage | 54% |
| AWS/Azure/GCP | 32%/23%/11% |
| Data cost | > $100k/yr |
| Fine‑tune | $100k–$1M |
What is included in the product
Detailed Word Document
Concise Porter's Five Forces analysis tailored to CSG that uncovers competitive drivers, supplier and buyer power, substitution risks, and barriers to entry, identifies emerging threats and disruptive substitutes, and offers strategic insights to inform investor materials, internal strategy, and academic use.
Customizable Excel Spreadsheet
A single-sheet CSG Porter's Five Forces tool that instantly highlights strategic pressure points, customizable with your data or scenarios, no macros required—ready to drop into decks or dashboards for faster, clearer decision-making.
Customers Bargaining Power
Consolidated telco buyers
Large CSPs, cable MSOs and media groups wield consolidated procurement scale—RFP cycles often exceed 12 months and multi-year frameworks typically run 3–5 years, enabling sustained volume discounts. They demand outcome-based SLAs and penalty regimes often up to 5–10% of contract value, enforced via vendor scorecards. Regional consolidation means the top three buyers can represent over 50% of regional demand, further concentrating bargaining power.
High switching costs
Core billing and customer care migrations are risky and costly, with industry estimates in 2024 putting typical OSS/BSS projects in the $5–50m range and 12–36 month timelines, which moderates churn. Buyers frequently leverage the threat of switching to extract concessions without moving, prompting vendors to accept scope rebids. Proofs of concept and phased rollouts are used to rebid scope and derisk migration. Strong references and TCO evidence are the primary levers to resist discount pressure.
Demand for flexible pricing
By 2024, roughly 45% of enterprise buyers demand flexible pricing, pushing suppliers to absorb more risk as usage- and outcome-based models shift variability to vendors. Customers insist on elasticity, ramp schedules, and explicit price protections while benchmarking clauses can trigger midterm repricing. Clear unit economics and contractual guardrails are essential to control margin volatility and arbitrage.
Customization expectations
Buyers demand heavy configuration to map legacy processes, inflating scope and change control and often locking CSG into client-specific roadmaps; modular productization and extension frameworks cut bespoke work and speed delivery, while strict governance limits requirement creep and preserves strategic value.
- Clients drive bespoke scope
- Modularization reduces custom effort
- Extension frameworks enable reuse
- Governance curbs requirement creep
Insourcing and DIY options
- Insourcing reduces vendor leverage
- Point capabilities (charging/analytics/care) enable bargaining
- Co-creation converts DIY intent into joint value
Buyers dominate: top-3 >50%, RFPs >12 months, ~45% want usage pricing
Buyers concentrate power: top three customers can represent >50% regional demand, RFPs often >12 months and contracts run 3–5 years, enabling sustained discounts and 5–10% SLA penalty regimes. OSS/BSS migrations (2024) typically cost $5–50m and take 12–36 months, reducing churn and raising switching costs. By 2024 ~45% of enterprise buyers demand flexible/usage pricing, shifting risk to vendors and forcing modularization to protect margins.
| Metric | 2023/24 |
|---|---|
| Top-3 buyer share | >50% |
| RFP cycle | >12 months |
| Contract tenor | 3–5 years |
| OSS/BSS cost | $5–50m |
| OSS/BSS timeline | 12–36 months |
| SLA penalties | 5–10% |
| Buyers demanding flexible pricing | ~45% |
Preview the Actual Deliverable
CSG Porter's Five Forces Analysis
This preview shows the exact CSG Porter's Five Forces analysis you'll receive immediately after purchase—no samples or placeholders. The document is fully formatted, professionally written, and ready for download and use the moment you buy. You're viewing the final deliverable, available instantly upon payment.











