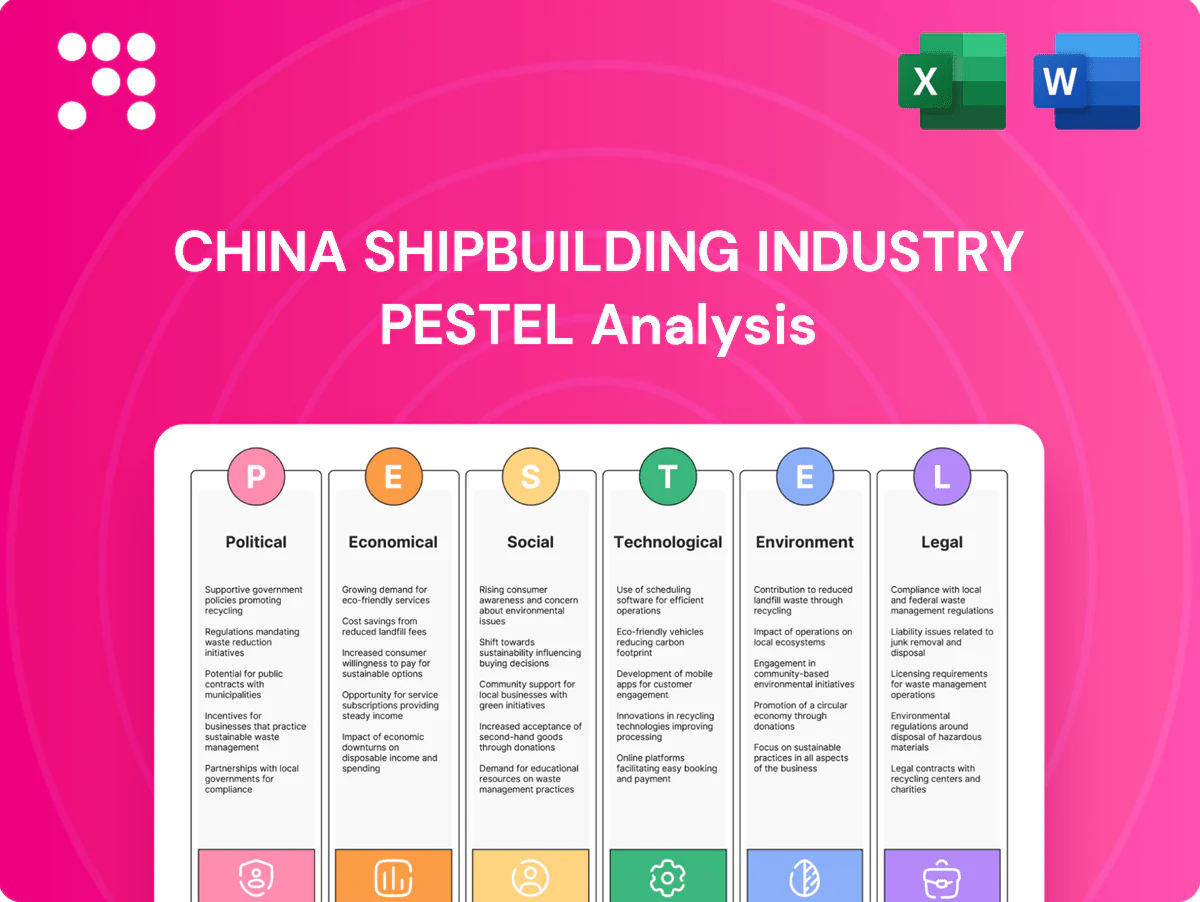
China Shipbuilding Industry PESTLE Analysis

Make Smarter Strategic Decisions with a Complete PESTEL View
Discover how political, economic, social, technological, legal and environmental forces are reshaping China Shipbuilding Industry and influencing strategic outcomes. This concise PESTLE snapshot highlights risks and growth levers for investors and strategists. Ready-made and actionable, it saves you research time. Purchase the full PESTLE for the complete, downloadable analysis and implementable insights.
Political factors

State backing and industrial policy
As a core SASAC SOE formed in 2019, CSSC benefits from central planning and the 14th Five-Year Plan (2021–25), which channels directed credit and stabilizes capex and R&D. Government procurement—notably for the PLA Navy as it expands—anchors demand and keeps capacity utilization high. Policy priorities can rapidly reallocate shipbuilding mix, sometimes trading commercial margins for strategic objectives.
Geopolitical tensions and export controls
US and EU export controls on dual-use technologies and marine electronics have tightened since 2020, constraining key imports and partnerships and contributing to China holding roughly 46% of global shipbuilding orders in 2024. Sanctions risks in dealings with Russia and Iran and heightened end-user scrutiny raise compliance costs and legal exposure for yards and suppliers. Geopolitics is rerouting orders toward friendly markets while limiting access to premium segments. Firms are hedging supply chains and redesigning systems to domestic standards to mitigate risks.

Belt and Road maritime influence
BRI port and shipping initiatives across over 140 partner countries catalyze offshore projects and fleet renewals, creating steady export opportunities for Chinese yards. Strong political ties can unlock concessional financing from policy banks such as China Development Bank and China Export-Import Bank, boosting order intake. Host-country instability and debt sustainability debates, exemplified by Hambantota, create delivery and payment risks. Rigorous project selection and insurance coverage are therefore critical.

Military-civil fusion priorities
China's 2017 military-civil fusion policy drives deliberate spillovers between naval and commercial ship technologies, accelerating innovation and dual-use adoption across yards; the 2019 consolidation into China State Shipbuilding Corporation concentrated naval capabilities under state control, raising security oversight for sensitive projects.
- Policy: national MCF strategy since 2017
- Structure: CSSC consolidation 2019
- Risk: tighter security and export licensing
- Ops: yard scheduling strains timelines
- Governance: secrecy vs commercial transparency
Local government support and coordination
Local governments use provincial subsidies, tax rebates and land-use support to spur yard clustering and expansion, contributing to regional overcapacity; China accounted for roughly 40% of global shipbuilding output by CGT in 2023–24. Central-local coordination since 2019 has accelerated consolidation under CSSC, while SOE performance reviews increasingly include social employment targets that can dampen efficiency.
- Provincial incentives drive clustering
- Inter-provincial competition → overcapacity cycles
- Central push for CSSC consolidation since 2019
- Employment targets in SOE assessments affect efficiency
State-backed demand and export controls reshape global shipbuilding amid Chinese capacity dominance
State control via CSSC (consolidated 2019) anchors demand through the 14th Five-Year Plan and PLA procurement, keeping capex and R&D stable. Tightened US/EU export controls since 2020 and sanctions risks raise compliance costs and push redesigns to domestic standards. BRI (140+ partner countries) and policy-bank financing sustain exports, while provincial incentives drive regional overcapacity (China ~46% orders 2024; ~40% CGT output 2023–24).
| Metric | Value | Note |
|---|---|---|
| China global orders | ~46% | 2024 |
| CGT output share | ~40% | 2023–24 |
| BRI partners | 140+ | 2024 |
What is included in the product
 Detailed Word Document
Explores how Political, Economic, Social, Technological, Environmental and Legal forces uniquely shape the China shipbuilding industry, using current data and trends to identify risks and opportunities. Designed for executives and investors, it offers actionable, forward‑looking insights for strategy, funding and scenario planning.

 Customizable Excel Spreadsheet
A concise PESTLE snapshot of China’s shipbuilding sector, visually segmented for rapid risk assessment and meeting-ready slides; editable notes let teams tailor insights by region or business line for fast alignment and strategic decision-making.
Economic factors

Global shipping cycle and freight rates
Newbuild demand closely follows container, bulk and tanker earnings, which remained volatile as the Baltic Dry Index swung roughly 800–3,500 in 2024–H1 2025 and SCFI volatility persisted; global ship orderbooks were about 12% of world fleet by DWT at end‑2024, pressuring pricing power. Slot scarcity on key trades can lift ASPs, so CSSC must balance backlog quality against cyclical troughs, while after‑sales and retrofit services help smooth revenue streams.
Currency and financing conditions
RMB volatility—USD/CNY averaged about 7.2 in 2024—directly shifts input costs and export competitiveness versus Korean/Japanese yards. Policy banks such as China EXIM and CDB provide export credit and concessional loans that ease buyer financing and support overseas contracts. Higher global rates (US fed funds 5.25–5.5% in 2024–25) squeeze owners’ ROI and can delay orders; hedging and flexible payment terms are used to mitigate deal risk.

Decarbonization capex wave
IMO targets (at least 40% carbon intensity cut by 2030 and 70% by 2050 vs 2008) are driving demand for LNG, methanol, ammonia-ready and dual-fuel newbuilds. Higher-spec green vessels often carry 10–25% ticket premiums, boosting shipyard margins. Owners face TCO uncertainty on alternative fuels, delaying specs; modular, future-proof designs can convert that uncertainty into orders.

Domestic demand resilience
China’s coastal trade, offshore wind and energy-logistics demand provide a baseline for shipyards; coastal shipping still handles over 90% of domestic cargo by tonnage (2024), while state-linked charterers like COSCO (≈1,400 vessels in 2024) underpin demand for specialized vessels. Slower GDP growth has tempered replacement cycles, so yards are diversifying into repair, conversion and offshore EPC to smooth revenue volatility.
- Coastal trade >90% domestic cargo (2024)
- COSCO ≈1,400 vessels (2024)
- Offshore wind & energy logistics = baseline demand
- Repair/conversion/EPC buffers cyclicality
Input costs and supply chain
Steel HRC in China averaged about 4,800 CNY/ton in 2024, and steel, engines and electronics prices directly squeeze margins on fixed-price contracts; marine engine lead times are typically 12–24 months, forcing disciplined procurement and vendor financing to manage cashflow.
- FX risk cut by localized sourcing but tech gaps persist
- Long-lead items need strict scheduling and vendor finance
- Collaborative planning with Tier-1s essential for delivery
State-backed demand and export controls reshape global shipbuilding amid Chinese capacity dominance
Newbuild demand tracks freight earnings; global orderbook ≈12% of world fleet by DWT (end‑2024) while BDI swung ~800–3,500 in 2024–H1 2025, compressing pricing power. RMB avg ~7.2 in 2024 and policy banks (EXIM, CDB) back exports, but US rates (fed funds 5.25–5.5% in 2024–25) tighten owner ROI. IMO carbon targets drive LNG/methanol/ammonia‑ready premiums (≈10–25%), boosting yard margins.
| Metric | Value |
|---|---|
| BDI range 2024–H1 2025 | ~800–3,500 |
| Orderbook (% DWT) | ~12% (end‑2024) |
| USD/CNY avg 2024 | ~7.2 |
| Fed funds | 5.25–5.5% (2024–25) |
| Steel HRC China 2024 | ~4,800 CNY/ton |
| COSCO fleet 2024 | ≈1,400 vessels |
Preview Before You Purchase
China Shipbuilding Industry PESTLE Analysis
The preview shown here is the exact China Shipbuilding Industry PESTLE Analysis document you’ll receive after purchase—fully formatted and ready to use. It contains the full Political, Economic, Social, Technological, Legal and Environmental analysis, charts and executive summary as displayed. No placeholders or teasers—this is the final file you can download immediately after checkout.

Make Smarter Strategic Decisions with a Complete PESTEL View
Discover how political, economic, social, technological, legal and environmental forces are reshaping China Shipbuilding Industry and influencing strategic outcomes. This concise PESTLE snapshot highlights risks and growth levers for investors and strategists. Ready-made and actionable, it saves you research time. Purchase the full PESTLE for the complete, downloadable analysis and implementable insights.
Political factors
State backing and industrial policy
As a core SASAC SOE formed in 2019, CSSC benefits from central planning and the 14th Five-Year Plan (2021–25), which channels directed credit and stabilizes capex and R&D. Government procurement—notably for the PLA Navy as it expands—anchors demand and keeps capacity utilization high. Policy priorities can rapidly reallocate shipbuilding mix, sometimes trading commercial margins for strategic objectives.
Geopolitical tensions and export controls
US and EU export controls on dual-use technologies and marine electronics have tightened since 2020, constraining key imports and partnerships and contributing to China holding roughly 46% of global shipbuilding orders in 2024. Sanctions risks in dealings with Russia and Iran and heightened end-user scrutiny raise compliance costs and legal exposure for yards and suppliers. Geopolitics is rerouting orders toward friendly markets while limiting access to premium segments. Firms are hedging supply chains and redesigning systems to domestic standards to mitigate risks.
Belt and Road maritime influence
BRI port and shipping initiatives across over 140 partner countries catalyze offshore projects and fleet renewals, creating steady export opportunities for Chinese yards. Strong political ties can unlock concessional financing from policy banks such as China Development Bank and China Export-Import Bank, boosting order intake. Host-country instability and debt sustainability debates, exemplified by Hambantota, create delivery and payment risks. Rigorous project selection and insurance coverage are therefore critical.
Military-civil fusion priorities
China's 2017 military-civil fusion policy drives deliberate spillovers between naval and commercial ship technologies, accelerating innovation and dual-use adoption across yards; the 2019 consolidation into China State Shipbuilding Corporation concentrated naval capabilities under state control, raising security oversight for sensitive projects.
- Policy: national MCF strategy since 2017
- Structure: CSSC consolidation 2019
- Risk: tighter security and export licensing
- Ops: yard scheduling strains timelines
- Governance: secrecy vs commercial transparency
Local government support and coordination
Local governments use provincial subsidies, tax rebates and land-use support to spur yard clustering and expansion, contributing to regional overcapacity; China accounted for roughly 40% of global shipbuilding output by CGT in 2023–24. Central-local coordination since 2019 has accelerated consolidation under CSSC, while SOE performance reviews increasingly include social employment targets that can dampen efficiency.
- Provincial incentives drive clustering
- Inter-provincial competition → overcapacity cycles
- Central push for CSSC consolidation since 2019
- Employment targets in SOE assessments affect efficiency
State-backed demand and export controls reshape global shipbuilding amid Chinese capacity dominance
State control via CSSC (consolidated 2019) anchors demand through the 14th Five-Year Plan and PLA procurement, keeping capex and R&D stable. Tightened US/EU export controls since 2020 and sanctions risks raise compliance costs and push redesigns to domestic standards. BRI (140+ partner countries) and policy-bank financing sustain exports, while provincial incentives drive regional overcapacity (China ~46% orders 2024; ~40% CGT output 2023–24).
| Metric | Value | Note |
|---|---|---|
| China global orders | ~46% | 2024 |
| CGT output share | ~40% | 2023–24 |
| BRI partners | 140+ | 2024 |
What is included in the product
Detailed Word Document
Explores how Political, Economic, Social, Technological, Environmental and Legal forces uniquely shape the China shipbuilding industry, using current data and trends to identify risks and opportunities. Designed for executives and investors, it offers actionable, forward‑looking insights for strategy, funding and scenario planning.
Customizable Excel Spreadsheet
A concise PESTLE snapshot of China’s shipbuilding sector, visually segmented for rapid risk assessment and meeting-ready slides; editable notes let teams tailor insights by region or business line for fast alignment and strategic decision-making.
Economic factors
Global shipping cycle and freight rates
Newbuild demand closely follows container, bulk and tanker earnings, which remained volatile as the Baltic Dry Index swung roughly 800–3,500 in 2024–H1 2025 and SCFI volatility persisted; global ship orderbooks were about 12% of world fleet by DWT at end‑2024, pressuring pricing power. Slot scarcity on key trades can lift ASPs, so CSSC must balance backlog quality against cyclical troughs, while after‑sales and retrofit services help smooth revenue streams.
Currency and financing conditions
RMB volatility—USD/CNY averaged about 7.2 in 2024—directly shifts input costs and export competitiveness versus Korean/Japanese yards. Policy banks such as China EXIM and CDB provide export credit and concessional loans that ease buyer financing and support overseas contracts. Higher global rates (US fed funds 5.25–5.5% in 2024–25) squeeze owners’ ROI and can delay orders; hedging and flexible payment terms are used to mitigate deal risk.
Decarbonization capex wave
IMO targets (at least 40% carbon intensity cut by 2030 and 70% by 2050 vs 2008) are driving demand for LNG, methanol, ammonia-ready and dual-fuel newbuilds. Higher-spec green vessels often carry 10–25% ticket premiums, boosting shipyard margins. Owners face TCO uncertainty on alternative fuels, delaying specs; modular, future-proof designs can convert that uncertainty into orders.
Domestic demand resilience
China’s coastal trade, offshore wind and energy-logistics demand provide a baseline for shipyards; coastal shipping still handles over 90% of domestic cargo by tonnage (2024), while state-linked charterers like COSCO (≈1,400 vessels in 2024) underpin demand for specialized vessels. Slower GDP growth has tempered replacement cycles, so yards are diversifying into repair, conversion and offshore EPC to smooth revenue volatility.
- Coastal trade >90% domestic cargo (2024)
- COSCO ≈1,400 vessels (2024)
- Offshore wind & energy logistics = baseline demand
- Repair/conversion/EPC buffers cyclicality
Input costs and supply chain
Steel HRC in China averaged about 4,800 CNY/ton in 2024, and steel, engines and electronics prices directly squeeze margins on fixed-price contracts; marine engine lead times are typically 12–24 months, forcing disciplined procurement and vendor financing to manage cashflow.
- FX risk cut by localized sourcing but tech gaps persist
- Long-lead items need strict scheduling and vendor finance
- Collaborative planning with Tier-1s essential for delivery
State-backed demand and export controls reshape global shipbuilding amid Chinese capacity dominance
Newbuild demand tracks freight earnings; global orderbook ≈12% of world fleet by DWT (end‑2024) while BDI swung ~800–3,500 in 2024–H1 2025, compressing pricing power. RMB avg ~7.2 in 2024 and policy banks (EXIM, CDB) back exports, but US rates (fed funds 5.25–5.5% in 2024–25) tighten owner ROI. IMO carbon targets drive LNG/methanol/ammonia‑ready premiums (≈10–25%), boosting yard margins.
| Metric | Value |
|---|---|
| BDI range 2024–H1 2025 | ~800–3,500 |
| Orderbook (% DWT) | ~12% (end‑2024) |
| USD/CNY avg 2024 | ~7.2 |
| Fed funds | 5.25–5.5% (2024–25) |
| Steel HRC China 2024 | ~4,800 CNY/ton |
| COSCO fleet 2024 | ≈1,400 vessels |
Preview Before You Purchase
China Shipbuilding Industry PESTLE Analysis
The preview shown here is the exact China Shipbuilding Industry PESTLE Analysis document you’ll receive after purchase—fully formatted and ready to use. It contains the full Political, Economic, Social, Technological, Legal and Environmental analysis, charts and executive summary as displayed. No placeholders or teasers—this is the final file you can download immediately after checkout.
Original: $10.00
-65%$10.00
$3.50Description
Make Smarter Strategic Decisions with a Complete PESTEL View
Discover how political, economic, social, technological, legal and environmental forces are reshaping China Shipbuilding Industry and influencing strategic outcomes. This concise PESTLE snapshot highlights risks and growth levers for investors and strategists. Ready-made and actionable, it saves you research time. Purchase the full PESTLE for the complete, downloadable analysis and implementable insights.
Political factors
State backing and industrial policy
As a core SASAC SOE formed in 2019, CSSC benefits from central planning and the 14th Five-Year Plan (2021–25), which channels directed credit and stabilizes capex and R&D. Government procurement—notably for the PLA Navy as it expands—anchors demand and keeps capacity utilization high. Policy priorities can rapidly reallocate shipbuilding mix, sometimes trading commercial margins for strategic objectives.
Geopolitical tensions and export controls
US and EU export controls on dual-use technologies and marine electronics have tightened since 2020, constraining key imports and partnerships and contributing to China holding roughly 46% of global shipbuilding orders in 2024. Sanctions risks in dealings with Russia and Iran and heightened end-user scrutiny raise compliance costs and legal exposure for yards and suppliers. Geopolitics is rerouting orders toward friendly markets while limiting access to premium segments. Firms are hedging supply chains and redesigning systems to domestic standards to mitigate risks.
Belt and Road maritime influence
BRI port and shipping initiatives across over 140 partner countries catalyze offshore projects and fleet renewals, creating steady export opportunities for Chinese yards. Strong political ties can unlock concessional financing from policy banks such as China Development Bank and China Export-Import Bank, boosting order intake. Host-country instability and debt sustainability debates, exemplified by Hambantota, create delivery and payment risks. Rigorous project selection and insurance coverage are therefore critical.
Military-civil fusion priorities
China's 2017 military-civil fusion policy drives deliberate spillovers between naval and commercial ship technologies, accelerating innovation and dual-use adoption across yards; the 2019 consolidation into China State Shipbuilding Corporation concentrated naval capabilities under state control, raising security oversight for sensitive projects.
- Policy: national MCF strategy since 2017
- Structure: CSSC consolidation 2019
- Risk: tighter security and export licensing
- Ops: yard scheduling strains timelines
- Governance: secrecy vs commercial transparency
Local government support and coordination
Local governments use provincial subsidies, tax rebates and land-use support to spur yard clustering and expansion, contributing to regional overcapacity; China accounted for roughly 40% of global shipbuilding output by CGT in 2023–24. Central-local coordination since 2019 has accelerated consolidation under CSSC, while SOE performance reviews increasingly include social employment targets that can dampen efficiency.
- Provincial incentives drive clustering
- Inter-provincial competition → overcapacity cycles
- Central push for CSSC consolidation since 2019
- Employment targets in SOE assessments affect efficiency
State-backed demand and export controls reshape global shipbuilding amid Chinese capacity dominance
State control via CSSC (consolidated 2019) anchors demand through the 14th Five-Year Plan and PLA procurement, keeping capex and R&D stable. Tightened US/EU export controls since 2020 and sanctions risks raise compliance costs and push redesigns to domestic standards. BRI (140+ partner countries) and policy-bank financing sustain exports, while provincial incentives drive regional overcapacity (China ~46% orders 2024; ~40% CGT output 2023–24).
| Metric | Value | Note |
|---|---|---|
| China global orders | ~46% | 2024 |
| CGT output share | ~40% | 2023–24 |
| BRI partners | 140+ | 2024 |
What is included in the product
Detailed Word Document
Explores how Political, Economic, Social, Technological, Environmental and Legal forces uniquely shape the China shipbuilding industry, using current data and trends to identify risks and opportunities. Designed for executives and investors, it offers actionable, forward‑looking insights for strategy, funding and scenario planning.
Customizable Excel Spreadsheet
A concise PESTLE snapshot of China’s shipbuilding sector, visually segmented for rapid risk assessment and meeting-ready slides; editable notes let teams tailor insights by region or business line for fast alignment and strategic decision-making.
Economic factors
Global shipping cycle and freight rates
Newbuild demand closely follows container, bulk and tanker earnings, which remained volatile as the Baltic Dry Index swung roughly 800–3,500 in 2024–H1 2025 and SCFI volatility persisted; global ship orderbooks were about 12% of world fleet by DWT at end‑2024, pressuring pricing power. Slot scarcity on key trades can lift ASPs, so CSSC must balance backlog quality against cyclical troughs, while after‑sales and retrofit services help smooth revenue streams.
Currency and financing conditions
RMB volatility—USD/CNY averaged about 7.2 in 2024—directly shifts input costs and export competitiveness versus Korean/Japanese yards. Policy banks such as China EXIM and CDB provide export credit and concessional loans that ease buyer financing and support overseas contracts. Higher global rates (US fed funds 5.25–5.5% in 2024–25) squeeze owners’ ROI and can delay orders; hedging and flexible payment terms are used to mitigate deal risk.
Decarbonization capex wave
IMO targets (at least 40% carbon intensity cut by 2030 and 70% by 2050 vs 2008) are driving demand for LNG, methanol, ammonia-ready and dual-fuel newbuilds. Higher-spec green vessels often carry 10–25% ticket premiums, boosting shipyard margins. Owners face TCO uncertainty on alternative fuels, delaying specs; modular, future-proof designs can convert that uncertainty into orders.
Domestic demand resilience
China’s coastal trade, offshore wind and energy-logistics demand provide a baseline for shipyards; coastal shipping still handles over 90% of domestic cargo by tonnage (2024), while state-linked charterers like COSCO (≈1,400 vessels in 2024) underpin demand for specialized vessels. Slower GDP growth has tempered replacement cycles, so yards are diversifying into repair, conversion and offshore EPC to smooth revenue volatility.
- Coastal trade >90% domestic cargo (2024)
- COSCO ≈1,400 vessels (2024)
- Offshore wind & energy logistics = baseline demand
- Repair/conversion/EPC buffers cyclicality
Input costs and supply chain
Steel HRC in China averaged about 4,800 CNY/ton in 2024, and steel, engines and electronics prices directly squeeze margins on fixed-price contracts; marine engine lead times are typically 12–24 months, forcing disciplined procurement and vendor financing to manage cashflow.
- FX risk cut by localized sourcing but tech gaps persist
- Long-lead items need strict scheduling and vendor finance
- Collaborative planning with Tier-1s essential for delivery
State-backed demand and export controls reshape global shipbuilding amid Chinese capacity dominance
Newbuild demand tracks freight earnings; global orderbook ≈12% of world fleet by DWT (end‑2024) while BDI swung ~800–3,500 in 2024–H1 2025, compressing pricing power. RMB avg ~7.2 in 2024 and policy banks (EXIM, CDB) back exports, but US rates (fed funds 5.25–5.5% in 2024–25) tighten owner ROI. IMO carbon targets drive LNG/methanol/ammonia‑ready premiums (≈10–25%), boosting yard margins.
| Metric | Value |
|---|---|
| BDI range 2024–H1 2025 | ~800–3,500 |
| Orderbook (% DWT) | ~12% (end‑2024) |
| USD/CNY avg 2024 | ~7.2 |
| Fed funds | 5.25–5.5% (2024–25) |
| Steel HRC China 2024 | ~4,800 CNY/ton |
| COSCO fleet 2024 | ≈1,400 vessels |
Preview Before You Purchase
China Shipbuilding Industry PESTLE Analysis
The preview shown here is the exact China Shipbuilding Industry PESTLE Analysis document you’ll receive after purchase—fully formatted and ready to use. It contains the full Political, Economic, Social, Technological, Legal and Environmental analysis, charts and executive summary as displayed. No placeholders or teasers—this is the final file you can download immediately after checkout.











