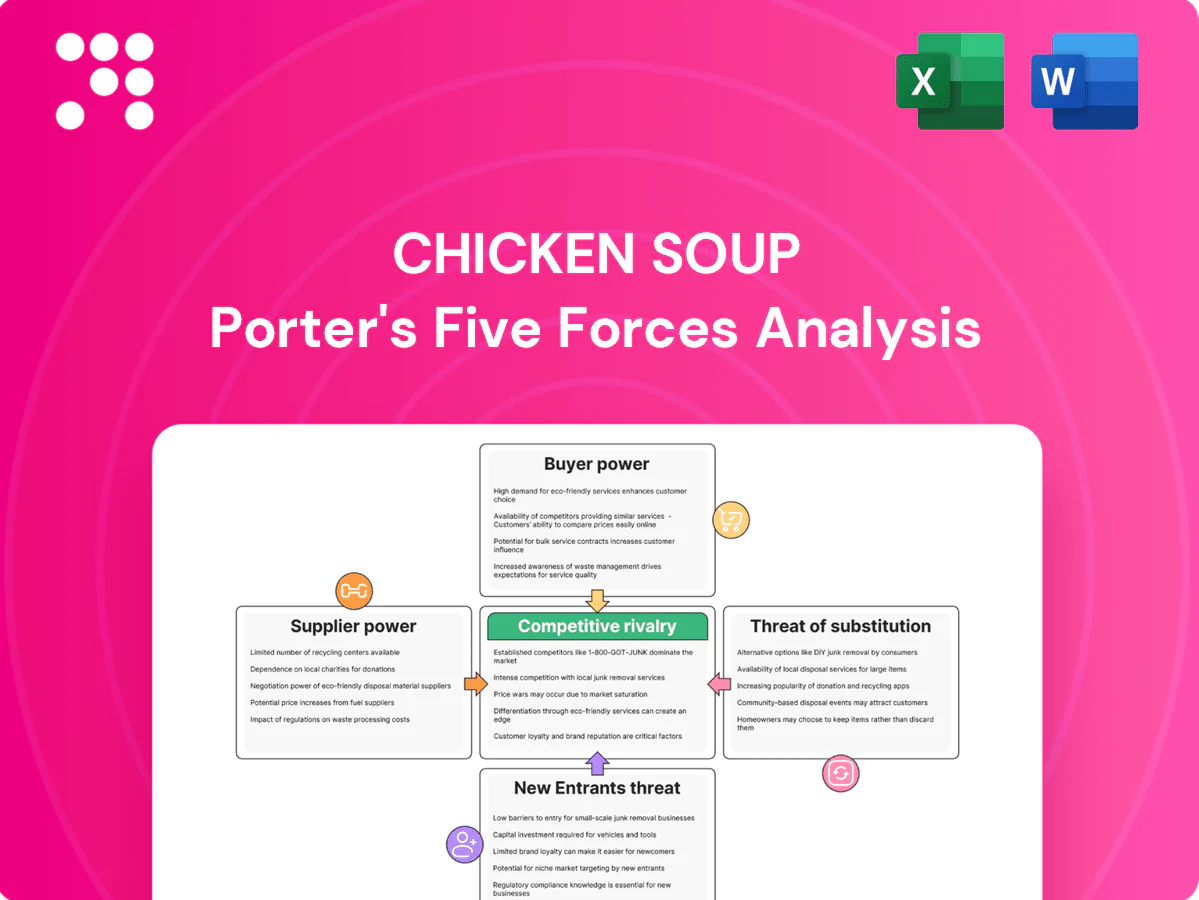
Chicken Soup Porter's Five Forces Analysis

From Overview to Strategy Blueprint
Chicken Soup faces varied pressures—from supplier concentration to low switching costs for buyers—and this snapshot highlights where risks and advantages concentrate across the value chain. Want a force-by-force breakdown with ratings, visuals, and strategy implications tailored to Chicken Soup? Unlock the full Porter's Five Forces Analysis to inform investment decisions and strategic action.
Suppliers Bargaining Power

Hit content owners leverage scarcity
Major studios, independents and talent agencies control premium IP, driving license fees often in the $5–15M per-episode range for hits and dictating restrictive windowing; in 2024 market reports showed licensing bid activity rose roughly 10–20% YoY. As a mid-scale AVOD/FAST operator the company lacks the clout of top SVODs in bidding wars, which can compress margins or force payback periods from ~12–24 months out to 24–48 months. Owning catalog reduces exposure but does not fully offset dependence on star-driven IP.
Platform gatekeepers shape access
Connected TV OEMs, app stores, and smart TV channels act as gatekeepers controlling placement, data access, and revenue-share terms.
Prominent placement on Roku, Amazon, Samsung TV Plus, and LG Channels often requires negotiation and revenue concessions; app stores commonly take 15–30% commission.
Restricted discovery visibility and limited audience data amplify supplier-like power, directly constraining reach and lowering ad yield.

Ad-tech and measurement dependencies
SSPs, ad servers and measurement vendors set fill rates, CPMs and verification bars, and their integration complexity and switching costs give them strong bargaining leverage; industry studies in 2024 show ad-tech fee stacks often exceed 30% of gross ad spend, eroding publishers net take-rate. Demand-path optimization continues to favor large publishers and platforms, squeezing smaller networks on yield and access.

Cloud, CDN, and workflow vendors
Streaming reliability depends on cloud, encoding, DRM and CDN partners; the top three cloud providers held about 64% of the IaaS/PaaS market in 2024, limiting negotiating leverage for smaller players. Service-level and egress fees (around 0.09 USD/GB on major providers) create recurring fixed costs. Outages risk revenue and reputation, increasing reliance on top-tier vendors, and multi-vendor strategies reduce but do not eliminate dependency.
- Market share: top 3 ≈ 64% (2024)
- Typical egress: ~0.09 USD/GB on major clouds
- Multi-vendor lowers but never removes single-supplier risk
Physical media studios for Redbox
Licensing bids $5–15M/ep, apps 15–30%, ad-tech over 30% squeeze AVOD margins
Studios, talent agencies and licensors command premium IP (licenses often $5–15M/episode) and saw licensing bid activity rise ~10–20% YoY in 2024, squeezing margins for mid-scale AVOD/FAST operators. Platform gatekeepers and app stores (commissions 15–30%) restrict placement and data, while ad-tech stacks (>30% fees) and top-3 cloud share (~64%) further reduce negotiating leverage.
| Supplier | 2024 metric | Impact |
|---|---|---|
| Studios/IP | $5–15M/ep; +10–20% bids | High licensing cost |
| App stores | 15–30% fee | Lower revenue |
| Cloud | Top3 ≈64%; egress ~$0.09/GB | Fixed ops cost |
What is included in the product
 Detailed Word Document
Comprehensive Porter's Five Forces analysis tailored for Chicken Soup, uncovering competitive drivers, buyer and supplier influence on pricing and profitability, and barriers deterring new entrants. Identifies disruptive threats and substitutes, with strategic commentary and editable Word format for easy integration into investor decks or strategy plans.

 Customizable Excel Spreadsheet
A concise Porter's Five Forces one-sheet tailored for Chicken Soup—instantly highlight competitive pressures, swap in your own data, and drop the clean radar chart straight into decks to relieve strategic decision-making pain points.
Customers Bargaining Power

Viewers multi-home and churn easily
AVOD/FAST users face effectively zero switching costs and abundant free options, and industry reports in 2024 show double-digit growth in AVOD engagement while annual churn for ad-supported services hovers around 20–30%, highlighting volatile loyalty. Content parity across platforms makes session time fragile and small UX frictions can shift viewers to rivals. That dynamic forces constant content refreshes and frequent UI/UX improvements to defend engagement.
Advertisers demand performance and safety
In 2024 advertisers increasingly benchmark CPMs, completion rates and incrementality across AVOD sellers, demanding favorable pricing, category exclusivity and strict brand-safety controls. Budget consolidation toward larger, data-rich platforms has amplified buyer leverage, enabling tougher terms and leverage over inventory. Persistent under-delivery triggers make-goods that further compress yield for publishers.

Distribution partners seek rev share
Aggregators and CTV platforms negotiate carriage, rev-share (commonly 30–50%), and data access, and can relegate channels in guides to cut traffic. Prioritization or demotion in EPGs materially shifts viewership and ad yield, while demands for higher revenue splits or promotional fees (often tens of thousands of dollars per campaign) erode publisher economics. Dependence on a platform’s large user base strengthens their bargaining position.

Licensing counterparties benchmark prices
When licensing content to third parties, buyers benchmark against market comps and larger catalogs—platform scale matters as top streamers held combined content budgets >40 billion USD in 2024—letting buyers push for lower per-title fees. Abundant supply lets buyers delay deals to extract better terms; global rights fragmentation creates deal-by-deal leverage and package pricing typically favors scale sellers.
- Benchmarking: compare to large catalogs
- Delay power: abundant supply
- Fragmentation: deal-level leverage
- Package bias: favors scale sellers
Price transparency in programmatic
Auctions and supply-path transparency now expose rate cards and take-rates, letting buyers re-route spend in real time and compressing CPMs for undifferentiated inventory; programmatic accounted for roughly 80–85% of digital display spend in 2024, increasing buyer leverage. Publishers lean on unique audiences and first-party data to sustain higher yields and resist commoditization.
- Exposed take-rates accelerate price competition
- Real-time routing enables swift spend shifts
- Undifferentiated CPMs compress; premium data preserves value
AVOD pressure cooker: 20–30% churn, 80–85% programmatic, 30–50% rev-share
Customers wield strong leverage: AVOD users have near-zero switching costs and 20–30% annual churn, pushing constant content/UI investment. Advertisers consolidate spend (programmatic 80–85% in 2024), demanding lower CPMs and exclusivity, while aggregators extract 30–50% rev-share. Large streamers (>40B content budgets in 2024) set pricing comps, empowering buyers.
| Metric | 2024 |
|---|---|
| AVOD churn | 20–30% |
| Programmatic share | 80–85% |
| Top streamers' budgets | >40B USD |
| Rev-share | 30–50% |
Preview the Actual Deliverable
Chicken Soup Porter's Five Forces Analysis
This preview shows the exact Porter’s Five Forces analysis for Chicken Soup that you’ll receive immediately after purchase—no mockups or placeholders. The file is fully formatted, professionally written, and ready for download and use the moment you buy. What you see here is the complete deliverable, identical to the document provided upon payment.

From Overview to Strategy Blueprint
Chicken Soup faces varied pressures—from supplier concentration to low switching costs for buyers—and this snapshot highlights where risks and advantages concentrate across the value chain. Want a force-by-force breakdown with ratings, visuals, and strategy implications tailored to Chicken Soup? Unlock the full Porter's Five Forces Analysis to inform investment decisions and strategic action.
Suppliers Bargaining Power
Hit content owners leverage scarcity
Major studios, independents and talent agencies control premium IP, driving license fees often in the $5–15M per-episode range for hits and dictating restrictive windowing; in 2024 market reports showed licensing bid activity rose roughly 10–20% YoY. As a mid-scale AVOD/FAST operator the company lacks the clout of top SVODs in bidding wars, which can compress margins or force payback periods from ~12–24 months out to 24–48 months. Owning catalog reduces exposure but does not fully offset dependence on star-driven IP.
Platform gatekeepers shape access
Connected TV OEMs, app stores, and smart TV channels act as gatekeepers controlling placement, data access, and revenue-share terms.
Prominent placement on Roku, Amazon, Samsung TV Plus, and LG Channels often requires negotiation and revenue concessions; app stores commonly take 15–30% commission.
Restricted discovery visibility and limited audience data amplify supplier-like power, directly constraining reach and lowering ad yield.
Ad-tech and measurement dependencies
SSPs, ad servers and measurement vendors set fill rates, CPMs and verification bars, and their integration complexity and switching costs give them strong bargaining leverage; industry studies in 2024 show ad-tech fee stacks often exceed 30% of gross ad spend, eroding publishers net take-rate. Demand-path optimization continues to favor large publishers and platforms, squeezing smaller networks on yield and access.
Cloud, CDN, and workflow vendors
Streaming reliability depends on cloud, encoding, DRM and CDN partners; the top three cloud providers held about 64% of the IaaS/PaaS market in 2024, limiting negotiating leverage for smaller players. Service-level and egress fees (around 0.09 USD/GB on major providers) create recurring fixed costs. Outages risk revenue and reputation, increasing reliance on top-tier vendors, and multi-vendor strategies reduce but do not eliminate dependency.
- Market share: top 3 ≈ 64% (2024)
- Typical egress: ~0.09 USD/GB on major clouds
- Multi-vendor lowers but never removes single-supplier risk
Physical media studios for Redbox
Licensing bids $5–15M/ep, apps 15–30%, ad-tech over 30% squeeze AVOD margins
Studios, talent agencies and licensors command premium IP (licenses often $5–15M/episode) and saw licensing bid activity rise ~10–20% YoY in 2024, squeezing margins for mid-scale AVOD/FAST operators. Platform gatekeepers and app stores (commissions 15–30%) restrict placement and data, while ad-tech stacks (>30% fees) and top-3 cloud share (~64%) further reduce negotiating leverage.
| Supplier | 2024 metric | Impact |
|---|---|---|
| Studios/IP | $5–15M/ep; +10–20% bids | High licensing cost |
| App stores | 15–30% fee | Lower revenue |
| Cloud | Top3 ≈64%; egress ~$0.09/GB | Fixed ops cost |
What is included in the product
Detailed Word Document
Comprehensive Porter's Five Forces analysis tailored for Chicken Soup, uncovering competitive drivers, buyer and supplier influence on pricing and profitability, and barriers deterring new entrants. Identifies disruptive threats and substitutes, with strategic commentary and editable Word format for easy integration into investor decks or strategy plans.
Customizable Excel Spreadsheet
A concise Porter's Five Forces one-sheet tailored for Chicken Soup—instantly highlight competitive pressures, swap in your own data, and drop the clean radar chart straight into decks to relieve strategic decision-making pain points.
Customers Bargaining Power
Viewers multi-home and churn easily
AVOD/FAST users face effectively zero switching costs and abundant free options, and industry reports in 2024 show double-digit growth in AVOD engagement while annual churn for ad-supported services hovers around 20–30%, highlighting volatile loyalty. Content parity across platforms makes session time fragile and small UX frictions can shift viewers to rivals. That dynamic forces constant content refreshes and frequent UI/UX improvements to defend engagement.
Advertisers demand performance and safety
In 2024 advertisers increasingly benchmark CPMs, completion rates and incrementality across AVOD sellers, demanding favorable pricing, category exclusivity and strict brand-safety controls. Budget consolidation toward larger, data-rich platforms has amplified buyer leverage, enabling tougher terms and leverage over inventory. Persistent under-delivery triggers make-goods that further compress yield for publishers.
Distribution partners seek rev share
Aggregators and CTV platforms negotiate carriage, rev-share (commonly 30–50%), and data access, and can relegate channels in guides to cut traffic. Prioritization or demotion in EPGs materially shifts viewership and ad yield, while demands for higher revenue splits or promotional fees (often tens of thousands of dollars per campaign) erode publisher economics. Dependence on a platform’s large user base strengthens their bargaining position.
Licensing counterparties benchmark prices
When licensing content to third parties, buyers benchmark against market comps and larger catalogs—platform scale matters as top streamers held combined content budgets >40 billion USD in 2024—letting buyers push for lower per-title fees. Abundant supply lets buyers delay deals to extract better terms; global rights fragmentation creates deal-by-deal leverage and package pricing typically favors scale sellers.
- Benchmarking: compare to large catalogs
- Delay power: abundant supply
- Fragmentation: deal-level leverage
- Package bias: favors scale sellers
Price transparency in programmatic
Auctions and supply-path transparency now expose rate cards and take-rates, letting buyers re-route spend in real time and compressing CPMs for undifferentiated inventory; programmatic accounted for roughly 80–85% of digital display spend in 2024, increasing buyer leverage. Publishers lean on unique audiences and first-party data to sustain higher yields and resist commoditization.
- Exposed take-rates accelerate price competition
- Real-time routing enables swift spend shifts
- Undifferentiated CPMs compress; premium data preserves value
AVOD pressure cooker: 20–30% churn, 80–85% programmatic, 30–50% rev-share
Customers wield strong leverage: AVOD users have near-zero switching costs and 20–30% annual churn, pushing constant content/UI investment. Advertisers consolidate spend (programmatic 80–85% in 2024), demanding lower CPMs and exclusivity, while aggregators extract 30–50% rev-share. Large streamers (>40B content budgets in 2024) set pricing comps, empowering buyers.
| Metric | 2024 |
|---|---|
| AVOD churn | 20–30% |
| Programmatic share | 80–85% |
| Top streamers' budgets | >40B USD |
| Rev-share | 30–50% |
Preview the Actual Deliverable
Chicken Soup Porter's Five Forces Analysis
This preview shows the exact Porter’s Five Forces analysis for Chicken Soup that you’ll receive immediately after purchase—no mockups or placeholders. The file is fully formatted, professionally written, and ready for download and use the moment you buy. What you see here is the complete deliverable, identical to the document provided upon payment.
Original: $10.00
-65%$10.00
$3.50Description
From Overview to Strategy Blueprint
Chicken Soup faces varied pressures—from supplier concentration to low switching costs for buyers—and this snapshot highlights where risks and advantages concentrate across the value chain. Want a force-by-force breakdown with ratings, visuals, and strategy implications tailored to Chicken Soup? Unlock the full Porter's Five Forces Analysis to inform investment decisions and strategic action.
Suppliers Bargaining Power
Hit content owners leverage scarcity
Major studios, independents and talent agencies control premium IP, driving license fees often in the $5–15M per-episode range for hits and dictating restrictive windowing; in 2024 market reports showed licensing bid activity rose roughly 10–20% YoY. As a mid-scale AVOD/FAST operator the company lacks the clout of top SVODs in bidding wars, which can compress margins or force payback periods from ~12–24 months out to 24–48 months. Owning catalog reduces exposure but does not fully offset dependence on star-driven IP.
Platform gatekeepers shape access
Connected TV OEMs, app stores, and smart TV channels act as gatekeepers controlling placement, data access, and revenue-share terms.
Prominent placement on Roku, Amazon, Samsung TV Plus, and LG Channels often requires negotiation and revenue concessions; app stores commonly take 15–30% commission.
Restricted discovery visibility and limited audience data amplify supplier-like power, directly constraining reach and lowering ad yield.
Ad-tech and measurement dependencies
SSPs, ad servers and measurement vendors set fill rates, CPMs and verification bars, and their integration complexity and switching costs give them strong bargaining leverage; industry studies in 2024 show ad-tech fee stacks often exceed 30% of gross ad spend, eroding publishers net take-rate. Demand-path optimization continues to favor large publishers and platforms, squeezing smaller networks on yield and access.
Cloud, CDN, and workflow vendors
Streaming reliability depends on cloud, encoding, DRM and CDN partners; the top three cloud providers held about 64% of the IaaS/PaaS market in 2024, limiting negotiating leverage for smaller players. Service-level and egress fees (around 0.09 USD/GB on major providers) create recurring fixed costs. Outages risk revenue and reputation, increasing reliance on top-tier vendors, and multi-vendor strategies reduce but do not eliminate dependency.
- Market share: top 3 ≈ 64% (2024)
- Typical egress: ~0.09 USD/GB on major clouds
- Multi-vendor lowers but never removes single-supplier risk
Physical media studios for Redbox
Licensing bids $5–15M/ep, apps 15–30%, ad-tech over 30% squeeze AVOD margins
Studios, talent agencies and licensors command premium IP (licenses often $5–15M/episode) and saw licensing bid activity rise ~10–20% YoY in 2024, squeezing margins for mid-scale AVOD/FAST operators. Platform gatekeepers and app stores (commissions 15–30%) restrict placement and data, while ad-tech stacks (>30% fees) and top-3 cloud share (~64%) further reduce negotiating leverage.
| Supplier | 2024 metric | Impact |
|---|---|---|
| Studios/IP | $5–15M/ep; +10–20% bids | High licensing cost |
| App stores | 15–30% fee | Lower revenue |
| Cloud | Top3 ≈64%; egress ~$0.09/GB | Fixed ops cost |
What is included in the product
Detailed Word Document
Comprehensive Porter's Five Forces analysis tailored for Chicken Soup, uncovering competitive drivers, buyer and supplier influence on pricing and profitability, and barriers deterring new entrants. Identifies disruptive threats and substitutes, with strategic commentary and editable Word format for easy integration into investor decks or strategy plans.
Customizable Excel Spreadsheet
A concise Porter's Five Forces one-sheet tailored for Chicken Soup—instantly highlight competitive pressures, swap in your own data, and drop the clean radar chart straight into decks to relieve strategic decision-making pain points.
Customers Bargaining Power
Viewers multi-home and churn easily
AVOD/FAST users face effectively zero switching costs and abundant free options, and industry reports in 2024 show double-digit growth in AVOD engagement while annual churn for ad-supported services hovers around 20–30%, highlighting volatile loyalty. Content parity across platforms makes session time fragile and small UX frictions can shift viewers to rivals. That dynamic forces constant content refreshes and frequent UI/UX improvements to defend engagement.
Advertisers demand performance and safety
In 2024 advertisers increasingly benchmark CPMs, completion rates and incrementality across AVOD sellers, demanding favorable pricing, category exclusivity and strict brand-safety controls. Budget consolidation toward larger, data-rich platforms has amplified buyer leverage, enabling tougher terms and leverage over inventory. Persistent under-delivery triggers make-goods that further compress yield for publishers.
Distribution partners seek rev share
Aggregators and CTV platforms negotiate carriage, rev-share (commonly 30–50%), and data access, and can relegate channels in guides to cut traffic. Prioritization or demotion in EPGs materially shifts viewership and ad yield, while demands for higher revenue splits or promotional fees (often tens of thousands of dollars per campaign) erode publisher economics. Dependence on a platform’s large user base strengthens their bargaining position.
Licensing counterparties benchmark prices
When licensing content to third parties, buyers benchmark against market comps and larger catalogs—platform scale matters as top streamers held combined content budgets >40 billion USD in 2024—letting buyers push for lower per-title fees. Abundant supply lets buyers delay deals to extract better terms; global rights fragmentation creates deal-by-deal leverage and package pricing typically favors scale sellers.
- Benchmarking: compare to large catalogs
- Delay power: abundant supply
- Fragmentation: deal-level leverage
- Package bias: favors scale sellers
Price transparency in programmatic
Auctions and supply-path transparency now expose rate cards and take-rates, letting buyers re-route spend in real time and compressing CPMs for undifferentiated inventory; programmatic accounted for roughly 80–85% of digital display spend in 2024, increasing buyer leverage. Publishers lean on unique audiences and first-party data to sustain higher yields and resist commoditization.
- Exposed take-rates accelerate price competition
- Real-time routing enables swift spend shifts
- Undifferentiated CPMs compress; premium data preserves value
AVOD pressure cooker: 20–30% churn, 80–85% programmatic, 30–50% rev-share
Customers wield strong leverage: AVOD users have near-zero switching costs and 20–30% annual churn, pushing constant content/UI investment. Advertisers consolidate spend (programmatic 80–85% in 2024), demanding lower CPMs and exclusivity, while aggregators extract 30–50% rev-share. Large streamers (>40B content budgets in 2024) set pricing comps, empowering buyers.
| Metric | 2024 |
|---|---|
| AVOD churn | 20–30% |
| Programmatic share | 80–85% |
| Top streamers' budgets | >40B USD |
| Rev-share | 30–50% |
Preview the Actual Deliverable
Chicken Soup Porter's Five Forces Analysis
This preview shows the exact Porter’s Five Forces analysis for Chicken Soup that you’ll receive immediately after purchase—no mockups or placeholders. The file is fully formatted, professionally written, and ready for download and use the moment you buy. What you see here is the complete deliverable, identical to the document provided upon payment.











