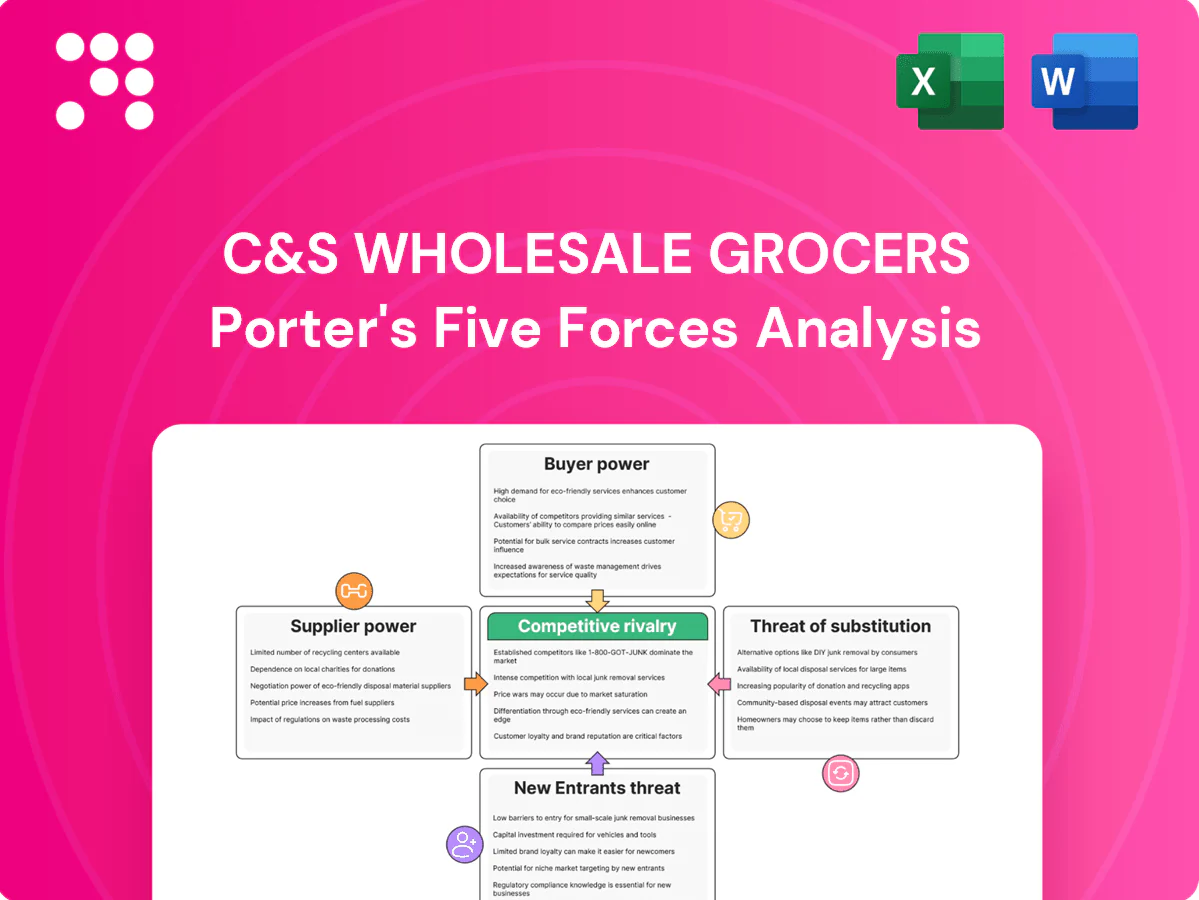
C&S Wholesale Grocers Porter's Five Forces Analysis

Go Beyond the Preview—Access the Full Strategic Report
C&S Wholesale Grocers faces intense rivalry from national distributors, moderate supplier leverage via private-label sourcing, strong buyer power from large retailers, and limited new-entrant risk but rising e‑commerce substitution. This brief snapshot only scratches the surface. Unlock the full Porter's Five Forces Analysis to explore C&S Wholesale Grocers’s competitive dynamics, market pressures, and strategic advantages in detail.
Suppliers Bargaining Power

Concentrated branded manufacturers
Concentrated branded manufacturers like PepsiCo and Coca‑Cola command shelf pull and can dictate pricing, promotions and allocations, limiting C&S’s ability to switch without denting retailer demand. C&S—which serves roughly 7,700 retailers—uses volume aggregation and joint business planning to push back, but leverage is shared rather than dominant. Supplier power spikes during constrained supply cycles (eg 2020–22 COVID disruptions).
Fragmented perishables and local producers
Produce, meat and local specialty suppliers remain highly fragmented, diluting individual supplier leverage against C&S, which reported roughly $28.5 billion in revenue in 2024 and can economically re-source and tier suppliers to optimize cost and fill rates. Variability in quality and seasonality gives select growers episodic pricing power during peak shortages. C&S’s advanced cold-chain network and temperature-controlled capacity materially strengthen its negotiating position.

Private label as a counterweight
Owned and controlled private-label brands reduce C&S Wholesale Grocers dependence on high-power national brands by shifting assortment toward in-house SKUs; private-label penetration in US grocery reached about 18% in 2023–24. C&S leverages private label to negotiate better trade terms and improve margin mix, but success hinges on quality, on-shelf availability, and retailer adoption rates. Its scale in sourcing and packaging—serving thousands of stores—lowers supplier leverage and sourcing costs.

Logistics and packaging inputs
Logistics and packaging inputs — carriers, fuel, pallets and packaging — materially influence C&S delivered cost given its national distribution network of about 20 DCs. Tight freight capacity or fuel spikes in 2024 temporarily raise supplier bargaining power. C&S mitigates via multi-carrier strategies, routing optimization, fuel hedging and long-term contracts to stabilize terms.
- Carriers: diversify lanes, spot vs contract mix
- Fuel: hedging and surcharges
- Pallets/packaging: bulk agreements
- Contracts: long-term to cap volatility
Compliance and allocation dynamics
Vendor OTIF standards and chargeback policies materially shape supplier leverage: strict chargebacks and allocation rules mean that in shortages suppliers favor strategic partners, raising supplier bargaining power. C&S counters by investing in forecast accuracy and end-to-end visibility to secure priority from suppliers. Industry OTIF target was about 95% in 2024 and data sharing has been shown to cut stockouts by up to 30%, converting adversarial terms into collaborative agreements.
- OTIF target: 95% (2024)
- Allocation favors strategic partners in shortages
- Forecasting and visibility investments secure priority
- Data sharing can reduce stockouts up to 30%
Scale and logistics counter brand power - $28.5B, OTIF 95%
Branded manufacturers (eg PepsiCo, Coca‑Cola) exert significant pricing and allocation power, especially in constrained cycles, while C&S’s $28.5B scale and ~20 DCs provide counter-leverage. Private‑label penetration (~18% 2023–24) and sourcing scale reduce reliance on national brands but hinge on quality and retailer adoption. OTIF target ~95% (2024); forecasting, data sharing and long‑term logistics contracts are key mitigants.
| Metric | 2024 / 2023–24 |
|---|---|
| Revenue | $28.5B (2024) |
| DCs | ~20 |
| Private‑label | ~18% |
| OTIF target | 95% |
What is included in the product
 Detailed Word Document
Tailored analysis of C&S Wholesale Grocers that uncovers key drivers of competition, supplier and buyer power, barriers to entry, substitutes and emerging threats, with strategic commentary to inform pricing, profitability and defensive growth strategies.

 Customizable Excel Spreadsheet
One-sheet Porter's Five Forces for C&S Wholesale Grocers that distills competitive pressures into a single view—ideal for fast decisions and boardroom slides. Customizable pressure levels, radar chart output, and simple Excel integration make it effortless to update and share without coding.
Customers Bargaining Power

Large chains with scale leverage
Regional and national chains, led by players like Walmart (≈26% grocery share) and Kroger (≈8%), negotiate sharply on price, service levels, and rebates, leveraging volume concentration and alternative sourcing to raise buyer power. C&S must tailor SLAs and co-invest in merchandising and analytics to retain shelf space and margins. Multi-year contracts help anchor volumes but compress margins, forcing efficiency gains.
Independents and co-ops
Independent grocers are highly fragmented—C&S serves more than 7,700 independent, chain and military commissary stores—so individual bargaining power is limited. Many independents pay for turnkey services from C&S, increasing C&S’s influence over assortment and operations. Co-ops and group purchasing pool demand to secure better terms, while service differentiation (logistics, category management) often matters more than pure price.

Switching and multi-sourcing
Buyers routinely dual-source to benchmark prices and limit dependency, pressuring C&S despite its scale as the largest U.S. wholesaler serving over 7,700 independent stores (2024). Switching costs from EDI, planograms, delivery windows and credit terms create friction but are not prohibitive, so performance gaps or stockouts prompt rapid share shifts. C&S invests in on-time delivery and inventory accuracy to raise implicit switching costs and protect margins.

Backward integration risk
Large grocers like Walmart (FY2024 revenue $611.3 billion) and major regional chains operate self-distribution centers, reducing reliance on wholesalers and strengthening buyer bargaining power; strong self-distribution cases push harder on pricing and service terms. C&S, supplying over 7,700 stores, can position as a flexible overflow and specialty complement, with negotiations centered on total landed cost comparisons.
Price transparency and pass-through
Price transparency in commodities and promos forces retailers to push >80% pass-through and insist on predictable landed costs, pressuring C&S to standardize pricing across ~7,700 client stores and roughly $30B annual throughput (2023 estimate).
C&S balances rebates, off-invoice allowances and freight terms to hit retailer targets while using data-driven joint planning to trade margin for volume and loyalty.
- Pass-through pressure: >80%
- Client footprint: ~7,700 stores
- Throughput: ≈$30B (2023 est.)
- Levers: rebates, off-invoice, freight, joint planning
Large grocers set prices; regional distributor (~$30B) trades rebates for volume
Large chains (Walmart ≈26% grocery share, Kroger ≈8%) exert strong price/service leverage; independents are fragmented (C&S serves >7,700 stores) lowering individual buyer power. Dual-sourcing, self-distribution and >80% promo pass-through squeeze margins, forcing C&S to trade rebates, freight and analytics for volume. C&S ≈$30B throughput (2023 est.) positions it as overflow/specialty partner while anchoring multi-year contracts.
| Metric | Value | Year/Source |
|---|---|---|
| Walmart grocery share | ≈26% | 2024 |
| Kroger grocery share | ≈8% | 2024 |
| C&S client footprint | >7,700 stores | 2024 |
| Throughput | ≈$30B | 2023 est. |
| Promo pass-through | >80% | 2024 |
Preview the Actual Deliverable
C&S Wholesale Grocers Porter's Five Forces Analysis
This Porter’s Five Forces analysis of C&S Wholesale Grocers evaluates supplier power, buyer power, competitive rivalry, and the threats of new entrants and substitutes to inform strategic decision-making. This preview is the exact, fully formatted document you’ll receive instantly after purchase—no placeholders or samples. Download and use it immediately.

Go Beyond the Preview—Access the Full Strategic Report
C&S Wholesale Grocers faces intense rivalry from national distributors, moderate supplier leverage via private-label sourcing, strong buyer power from large retailers, and limited new-entrant risk but rising e‑commerce substitution. This brief snapshot only scratches the surface. Unlock the full Porter's Five Forces Analysis to explore C&S Wholesale Grocers’s competitive dynamics, market pressures, and strategic advantages in detail.
Suppliers Bargaining Power
Concentrated branded manufacturers
Concentrated branded manufacturers like PepsiCo and Coca‑Cola command shelf pull and can dictate pricing, promotions and allocations, limiting C&S’s ability to switch without denting retailer demand. C&S—which serves roughly 7,700 retailers—uses volume aggregation and joint business planning to push back, but leverage is shared rather than dominant. Supplier power spikes during constrained supply cycles (eg 2020–22 COVID disruptions).
Fragmented perishables and local producers
Produce, meat and local specialty suppliers remain highly fragmented, diluting individual supplier leverage against C&S, which reported roughly $28.5 billion in revenue in 2024 and can economically re-source and tier suppliers to optimize cost and fill rates. Variability in quality and seasonality gives select growers episodic pricing power during peak shortages. C&S’s advanced cold-chain network and temperature-controlled capacity materially strengthen its negotiating position.
Private label as a counterweight
Owned and controlled private-label brands reduce C&S Wholesale Grocers dependence on high-power national brands by shifting assortment toward in-house SKUs; private-label penetration in US grocery reached about 18% in 2023–24. C&S leverages private label to negotiate better trade terms and improve margin mix, but success hinges on quality, on-shelf availability, and retailer adoption rates. Its scale in sourcing and packaging—serving thousands of stores—lowers supplier leverage and sourcing costs.
Logistics and packaging inputs
Logistics and packaging inputs — carriers, fuel, pallets and packaging — materially influence C&S delivered cost given its national distribution network of about 20 DCs. Tight freight capacity or fuel spikes in 2024 temporarily raise supplier bargaining power. C&S mitigates via multi-carrier strategies, routing optimization, fuel hedging and long-term contracts to stabilize terms.
- Carriers: diversify lanes, spot vs contract mix
- Fuel: hedging and surcharges
- Pallets/packaging: bulk agreements
- Contracts: long-term to cap volatility
Compliance and allocation dynamics
Vendor OTIF standards and chargeback policies materially shape supplier leverage: strict chargebacks and allocation rules mean that in shortages suppliers favor strategic partners, raising supplier bargaining power. C&S counters by investing in forecast accuracy and end-to-end visibility to secure priority from suppliers. Industry OTIF target was about 95% in 2024 and data sharing has been shown to cut stockouts by up to 30%, converting adversarial terms into collaborative agreements.
- OTIF target: 95% (2024)
- Allocation favors strategic partners in shortages
- Forecasting and visibility investments secure priority
- Data sharing can reduce stockouts up to 30%
Scale and logistics counter brand power - $28.5B, OTIF 95%
Branded manufacturers (eg PepsiCo, Coca‑Cola) exert significant pricing and allocation power, especially in constrained cycles, while C&S’s $28.5B scale and ~20 DCs provide counter-leverage. Private‑label penetration (~18% 2023–24) and sourcing scale reduce reliance on national brands but hinge on quality and retailer adoption. OTIF target ~95% (2024); forecasting, data sharing and long‑term logistics contracts are key mitigants.
| Metric | 2024 / 2023–24 |
|---|---|
| Revenue | $28.5B (2024) |
| DCs | ~20 |
| Private‑label | ~18% |
| OTIF target | 95% |
What is included in the product
Detailed Word Document
Tailored analysis of C&S Wholesale Grocers that uncovers key drivers of competition, supplier and buyer power, barriers to entry, substitutes and emerging threats, with strategic commentary to inform pricing, profitability and defensive growth strategies.
Customizable Excel Spreadsheet
One-sheet Porter's Five Forces for C&S Wholesale Grocers that distills competitive pressures into a single view—ideal for fast decisions and boardroom slides. Customizable pressure levels, radar chart output, and simple Excel integration make it effortless to update and share without coding.
Customers Bargaining Power
Large chains with scale leverage
Regional and national chains, led by players like Walmart (≈26% grocery share) and Kroger (≈8%), negotiate sharply on price, service levels, and rebates, leveraging volume concentration and alternative sourcing to raise buyer power. C&S must tailor SLAs and co-invest in merchandising and analytics to retain shelf space and margins. Multi-year contracts help anchor volumes but compress margins, forcing efficiency gains.
Independents and co-ops
Independent grocers are highly fragmented—C&S serves more than 7,700 independent, chain and military commissary stores—so individual bargaining power is limited. Many independents pay for turnkey services from C&S, increasing C&S’s influence over assortment and operations. Co-ops and group purchasing pool demand to secure better terms, while service differentiation (logistics, category management) often matters more than pure price.
Switching and multi-sourcing
Buyers routinely dual-source to benchmark prices and limit dependency, pressuring C&S despite its scale as the largest U.S. wholesaler serving over 7,700 independent stores (2024). Switching costs from EDI, planograms, delivery windows and credit terms create friction but are not prohibitive, so performance gaps or stockouts prompt rapid share shifts. C&S invests in on-time delivery and inventory accuracy to raise implicit switching costs and protect margins.
Backward integration risk
Large grocers like Walmart (FY2024 revenue $611.3 billion) and major regional chains operate self-distribution centers, reducing reliance on wholesalers and strengthening buyer bargaining power; strong self-distribution cases push harder on pricing and service terms. C&S, supplying over 7,700 stores, can position as a flexible overflow and specialty complement, with negotiations centered on total landed cost comparisons.
Price transparency and pass-through
Price transparency in commodities and promos forces retailers to push >80% pass-through and insist on predictable landed costs, pressuring C&S to standardize pricing across ~7,700 client stores and roughly $30B annual throughput (2023 estimate).
C&S balances rebates, off-invoice allowances and freight terms to hit retailer targets while using data-driven joint planning to trade margin for volume and loyalty.
- Pass-through pressure: >80%
- Client footprint: ~7,700 stores
- Throughput: ≈$30B (2023 est.)
- Levers: rebates, off-invoice, freight, joint planning
Large grocers set prices; regional distributor (~$30B) trades rebates for volume
Large chains (Walmart ≈26% grocery share, Kroger ≈8%) exert strong price/service leverage; independents are fragmented (C&S serves >7,700 stores) lowering individual buyer power. Dual-sourcing, self-distribution and >80% promo pass-through squeeze margins, forcing C&S to trade rebates, freight and analytics for volume. C&S ≈$30B throughput (2023 est.) positions it as overflow/specialty partner while anchoring multi-year contracts.
| Metric | Value | Year/Source |
|---|---|---|
| Walmart grocery share | ≈26% | 2024 |
| Kroger grocery share | ≈8% | 2024 |
| C&S client footprint | >7,700 stores | 2024 |
| Throughput | ≈$30B | 2023 est. |
| Promo pass-through | >80% | 2024 |
Preview the Actual Deliverable
C&S Wholesale Grocers Porter's Five Forces Analysis
This Porter’s Five Forces analysis of C&S Wholesale Grocers evaluates supplier power, buyer power, competitive rivalry, and the threats of new entrants and substitutes to inform strategic decision-making. This preview is the exact, fully formatted document you’ll receive instantly after purchase—no placeholders or samples. Download and use it immediately.
Description
Go Beyond the Preview—Access the Full Strategic Report
C&S Wholesale Grocers faces intense rivalry from national distributors, moderate supplier leverage via private-label sourcing, strong buyer power from large retailers, and limited new-entrant risk but rising e‑commerce substitution. This brief snapshot only scratches the surface. Unlock the full Porter's Five Forces Analysis to explore C&S Wholesale Grocers’s competitive dynamics, market pressures, and strategic advantages in detail.
Suppliers Bargaining Power
Concentrated branded manufacturers
Concentrated branded manufacturers like PepsiCo and Coca‑Cola command shelf pull and can dictate pricing, promotions and allocations, limiting C&S’s ability to switch without denting retailer demand. C&S—which serves roughly 7,700 retailers—uses volume aggregation and joint business planning to push back, but leverage is shared rather than dominant. Supplier power spikes during constrained supply cycles (eg 2020–22 COVID disruptions).
Fragmented perishables and local producers
Produce, meat and local specialty suppliers remain highly fragmented, diluting individual supplier leverage against C&S, which reported roughly $28.5 billion in revenue in 2024 and can economically re-source and tier suppliers to optimize cost and fill rates. Variability in quality and seasonality gives select growers episodic pricing power during peak shortages. C&S’s advanced cold-chain network and temperature-controlled capacity materially strengthen its negotiating position.
Private label as a counterweight
Owned and controlled private-label brands reduce C&S Wholesale Grocers dependence on high-power national brands by shifting assortment toward in-house SKUs; private-label penetration in US grocery reached about 18% in 2023–24. C&S leverages private label to negotiate better trade terms and improve margin mix, but success hinges on quality, on-shelf availability, and retailer adoption rates. Its scale in sourcing and packaging—serving thousands of stores—lowers supplier leverage and sourcing costs.
Logistics and packaging inputs
Logistics and packaging inputs — carriers, fuel, pallets and packaging — materially influence C&S delivered cost given its national distribution network of about 20 DCs. Tight freight capacity or fuel spikes in 2024 temporarily raise supplier bargaining power. C&S mitigates via multi-carrier strategies, routing optimization, fuel hedging and long-term contracts to stabilize terms.
- Carriers: diversify lanes, spot vs contract mix
- Fuel: hedging and surcharges
- Pallets/packaging: bulk agreements
- Contracts: long-term to cap volatility
Compliance and allocation dynamics
Vendor OTIF standards and chargeback policies materially shape supplier leverage: strict chargebacks and allocation rules mean that in shortages suppliers favor strategic partners, raising supplier bargaining power. C&S counters by investing in forecast accuracy and end-to-end visibility to secure priority from suppliers. Industry OTIF target was about 95% in 2024 and data sharing has been shown to cut stockouts by up to 30%, converting adversarial terms into collaborative agreements.
- OTIF target: 95% (2024)
- Allocation favors strategic partners in shortages
- Forecasting and visibility investments secure priority
- Data sharing can reduce stockouts up to 30%
Scale and logistics counter brand power - $28.5B, OTIF 95%
Branded manufacturers (eg PepsiCo, Coca‑Cola) exert significant pricing and allocation power, especially in constrained cycles, while C&S’s $28.5B scale and ~20 DCs provide counter-leverage. Private‑label penetration (~18% 2023–24) and sourcing scale reduce reliance on national brands but hinge on quality and retailer adoption. OTIF target ~95% (2024); forecasting, data sharing and long‑term logistics contracts are key mitigants.
| Metric | 2024 / 2023–24 |
|---|---|
| Revenue | $28.5B (2024) |
| DCs | ~20 |
| Private‑label | ~18% |
| OTIF target | 95% |
What is included in the product
Detailed Word Document
Tailored analysis of C&S Wholesale Grocers that uncovers key drivers of competition, supplier and buyer power, barriers to entry, substitutes and emerging threats, with strategic commentary to inform pricing, profitability and defensive growth strategies.
Customizable Excel Spreadsheet
One-sheet Porter's Five Forces for C&S Wholesale Grocers that distills competitive pressures into a single view—ideal for fast decisions and boardroom slides. Customizable pressure levels, radar chart output, and simple Excel integration make it effortless to update and share without coding.
Customers Bargaining Power
Large chains with scale leverage
Regional and national chains, led by players like Walmart (≈26% grocery share) and Kroger (≈8%), negotiate sharply on price, service levels, and rebates, leveraging volume concentration and alternative sourcing to raise buyer power. C&S must tailor SLAs and co-invest in merchandising and analytics to retain shelf space and margins. Multi-year contracts help anchor volumes but compress margins, forcing efficiency gains.
Independents and co-ops
Independent grocers are highly fragmented—C&S serves more than 7,700 independent, chain and military commissary stores—so individual bargaining power is limited. Many independents pay for turnkey services from C&S, increasing C&S’s influence over assortment and operations. Co-ops and group purchasing pool demand to secure better terms, while service differentiation (logistics, category management) often matters more than pure price.
Switching and multi-sourcing
Buyers routinely dual-source to benchmark prices and limit dependency, pressuring C&S despite its scale as the largest U.S. wholesaler serving over 7,700 independent stores (2024). Switching costs from EDI, planograms, delivery windows and credit terms create friction but are not prohibitive, so performance gaps or stockouts prompt rapid share shifts. C&S invests in on-time delivery and inventory accuracy to raise implicit switching costs and protect margins.
Backward integration risk
Large grocers like Walmart (FY2024 revenue $611.3 billion) and major regional chains operate self-distribution centers, reducing reliance on wholesalers and strengthening buyer bargaining power; strong self-distribution cases push harder on pricing and service terms. C&S, supplying over 7,700 stores, can position as a flexible overflow and specialty complement, with negotiations centered on total landed cost comparisons.
Price transparency and pass-through
Price transparency in commodities and promos forces retailers to push >80% pass-through and insist on predictable landed costs, pressuring C&S to standardize pricing across ~7,700 client stores and roughly $30B annual throughput (2023 estimate).
C&S balances rebates, off-invoice allowances and freight terms to hit retailer targets while using data-driven joint planning to trade margin for volume and loyalty.
- Pass-through pressure: >80%
- Client footprint: ~7,700 stores
- Throughput: ≈$30B (2023 est.)
- Levers: rebates, off-invoice, freight, joint planning
Large grocers set prices; regional distributor (~$30B) trades rebates for volume
Large chains (Walmart ≈26% grocery share, Kroger ≈8%) exert strong price/service leverage; independents are fragmented (C&S serves >7,700 stores) lowering individual buyer power. Dual-sourcing, self-distribution and >80% promo pass-through squeeze margins, forcing C&S to trade rebates, freight and analytics for volume. C&S ≈$30B throughput (2023 est.) positions it as overflow/specialty partner while anchoring multi-year contracts.
| Metric | Value | Year/Source |
|---|---|---|
| Walmart grocery share | ≈26% | 2024 |
| Kroger grocery share | ≈8% | 2024 |
| C&S client footprint | >7,700 stores | 2024 |
| Throughput | ≈$30B | 2023 est. |
| Promo pass-through | >80% | 2024 |
Preview the Actual Deliverable
C&S Wholesale Grocers Porter's Five Forces Analysis
This Porter’s Five Forces analysis of C&S Wholesale Grocers evaluates supplier power, buyer power, competitive rivalry, and the threats of new entrants and substitutes to inform strategic decision-making. This preview is the exact, fully formatted document you’ll receive instantly after purchase—no placeholders or samples. Download and use it immediately.











