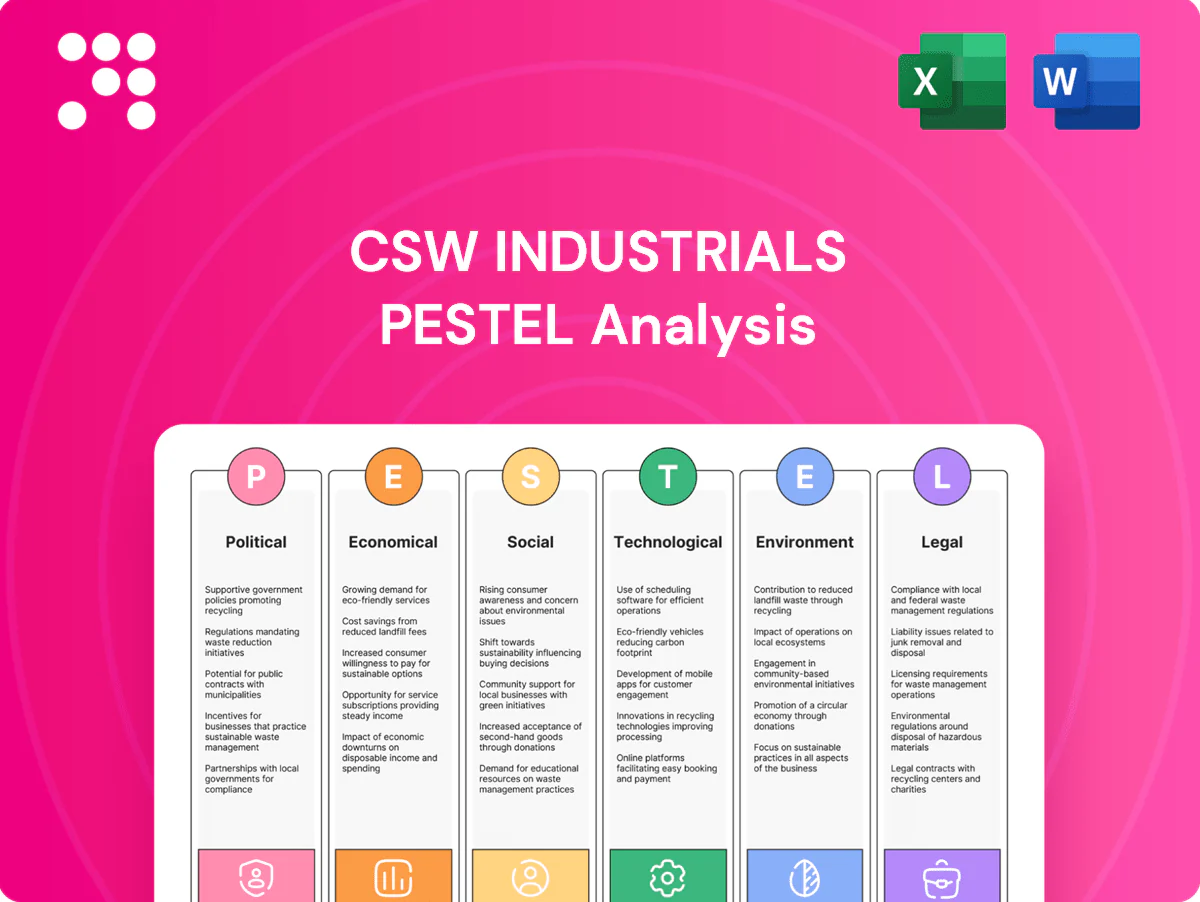
CSW Industrials PESTLE Analysis

Skip the Research. Get the Strategy.
Discover how political shifts, supply-chain dynamics, and evolving environmental standards are shaping CSW Industrials' strategic outlook in our concise PESTLE snapshot; use these insights to refine investment and operational decisions. This expert-ready analysis highlights risks and growth levers you can act on today. Purchase the full PESTLE for a complete, editable breakdown and instant download.
Political factors

Infrastructure and industrial policy tailwinds
Federal programs like the 2021 Infrastructure Investment and Jobs Act (roughly 1.2 trillion) and the Inflation Reduction Act (about 369 billion for energy and climate) boost demand across HVAC/R, plumbing and engineered building solutions by funding public facility, grid and efficiency upgrades. These programs favor durable, high-performance products but timing and allocation variability produce lumpy order patterns. CSW Industrials can align product roadmaps to funded priorities to capture market share.
Trade policy, tariffs, and supply-chain localization
Tariffs such as Section 232 steel (25%) and aluminum (10%) and US-China tariffs on many industrial goods raise CSW Industrials input costs and shift sourcing. Federal incentives like the CHIPS Act (52 billion USD) and Inflation Reduction Act (~369 billion USD) favor reshoring and domestic footprints. Policy swings force pricing and margin volatility that firms hedge or pass through, while diversified regional suppliers reduce trade-risk exposure.

Energy policy and HVAC efficiency agendas
Government pushes for building energy efficiency — buildings consume roughly 40% of global energy — elevate demand for high-performance HVAC/R and sealing solutions, directly benefiting CSW Industrials’ specialty chemicals and engineered-product lines.
Expanded incentives and rebate programs (eg, US Inflation Reduction Act measures and EU retrofit funding) have accelerated retrofits, improving addressable markets for sealants and HVAC components.
Policy reversals or implementation delays could slow adoption curves and cap near-term growth; proactive certification and advocacy preserve eligibility across programs and revenue streams.

State and municipal code enforcement intensity
Local governments drive differing enforcement levels for building and safety standards, creating a patchwork across roughly 19,500 U.S. municipal governments (U.S. Census Bureau). Stricter enforcement increases demand for compliant sealing, ventilation, and safety products and accelerates retrofit cycles. Fragmentation raises complexity in labeling, approvals, and inventory, while a robust code‑compliance library and local relationships speed specification wins.
- 19,500 U.S. municipalities: fragmented enforcement
- Stricter codes → higher demand for compliant products
- Fragmentation increases labeling/approval complexity
- Local relationships and compliance library shorten spec timelines
Geopolitical stability and critical inputs
Global tensions since 2022 have disrupted specialty chemical precursors and industrial components, with sanctions on Russia and export controls on advanced materials persisting into 2024 and constraining suppliers and customers. Freight and marine insurance premiums have spiked during episodes of uncertainty, raising landed costs and lead-time risk. CSW's multi-sourcing and inventory buffers help sustain service levels.
- Sanctions on Russia (2022–2024) limited feedstock sources
- Export controls on advanced-tech materials affected supplier access
- Higher freight/insurance during crises increased logistics costs
- Multi-sourcing + inventory buffers mitigate service disruptions
IIJA/IRA funds drive HVAC/plumbing demand; tariffs raise costs; local codes decide winners
Federal acts (IIJA ~1.2T; IRA ~US$369B) boost HVAC/plumbing demand but create lumpy orders; Section 232 steel/aluminum tariffs (25%/10%) and 2022–24 sanctions raise input costs; buildings ~40% of energy use and ~19,500 US municipalities create patchwork codes—local compliance wins market share.
| Factor | Stat | Impact |
|---|---|---|
| Infrastructure/energy | IIJA 1.2T; IRA US$369B | ↑ addressable market |
| Tariffs/sanctions | Steel 25%/Al 10%; 2022–24 sanctions | ↑ input costs |
What is included in the product
 Detailed Word Document
Explores how Political, Economic, Social, Technological, Environmental, and Legal forces uniquely impact CSW Industrials, combining data-backed trends and region-specific regulatory context; designed by strategy professionals to support executives and investors with forward-looking, insert-ready insights for planning and risk mitigation.

 Customizable Excel Spreadsheet
Provides a concise, presentation-ready PESTLE summary for CSW Industrials that’s visually segmented for quick interpretation, easily editable for region or business-line notes, and instantly shareable to align teams during planning or client-facing reports.
Economic factors

Construction and industrial cycle sensitivity
CSW Industrials end markets are closely tied to non-residential construction, maintenance and industrial production, with FY2024 net sales of about $1.3 billion reflecting that exposure. New starts, retrofit activity and MRO budgets drive demand amplitude; Dodge data showed nonresidential starts down roughly 5% in 2024, while MRO spending stayed resilient. Counter-cyclical MRO work helps cushion new-build downturns and CSW’s balanced segment mix reduces earnings volatility.
Interest rates and capital spending
Higher policy rates (federal funds ~5.25–5.50% in mid‑2025) depress construction financing and developer ROI, delaying projects and reducing near‑term demand for CSW Industrials' building products. Easing cycles historically unlock backlogs and boost contractor confidence, accelerating orderbooks. Customer affordability—30‑year mortgage rates near 7%—shapes price elasticity and SKU mix. Rate trajectory guidance is critical for inventory and capacity planning.

Raw material inflation and cost pass-through
Metals, resins and chemical inputs create margin risk when prices spike, with commodity inputs swinging roughly 10–30% across 2023–2024 in key markets, pressuring OEM margins. Effective surcharges and dynamic pricing actions are vital to maintain profitability, and timely index-based surcharges helped many industrials recoup input inflation in 2024. Contract structures and lead times dictate pass-through speed, with long-term fixed contracts delaying recovery. Supplier partnerships and formulation flexibility enhance resilience by enabling substitution and joint cost programs.

Labor availability and contractor productivity
Labor shortages in skilled trades are slowing installations and shifting demand toward labor-saving products; US construction employment was about 7.6 million in 2024 (BLS), keeping contractor capacity tight. Premiums for reliability and ease-of-use enable value pricing, while wage inflation raises customers' total cost of ownership; training and field support shorten adoption cycles.
- Labor scarcity → demand for labor-saving solutions
- 7.6M construction jobs (BLS 2024)
- Reliability supports premium pricing
- Wage inflation raises TCO
- Training/field support accelerates adoption
FX and geographic revenue mix
CSW Industrials is predominantly U.S.-centric, which limits direct FX exposure but concentrates macro risk in the U.S.; FY2024 revenue was about $1.0 billion, with over 70% of sales domestic, reducing currency translation impacts.
Currency swings affect import costs and export competitiveness, with a stronger USD in 2022–24 compressing imported input costs but making exports less competitive.
Diversifying sales by region and currency and increasing local sourcing creates natural hedges that can stabilize margin volatility.
- FY2024 revenue ~ $1.0B
- Domestic sales >70%
- Stronger USD 2022–24 eased import inflation
- Local sourcing = natural hedge
IIJA/IRA funds drive HVAC/plumbing demand; tariffs raise costs; local codes decide winners
CSW Industrials’ demand links to nonresidential construction and MRO; FY2024 net sales ~$1.3B with >70% domestic, while nonresidential starts fell ~5% in 2024. Fed funds ~5.25–5.50% (mid‑2025) and 30y mortgage ~7% weigh on new-builds; MRO and labor‑saving products cushion downturns. Commodity inputs swung ~10–30% in 2023–24, pressuring margins amid wage inflation and 7.6M construction jobs (BLS 2024).
| Metric | Value |
|---|---|
| FY2024 net sales | $1.3B |
| Domestic share | >70% |
| Nonresidential starts 2024 | −5% |
| Fed funds (mid‑2025) | 5.25–5.50% |
| Construction jobs 2024 | 7.6M |
Preview Before You Purchase
CSW Industrials PESTLE Analysis
The CSW Industrials PESTLE Analysis presents a concise, professionally formatted review of political, economic, social, technological, legal, and environmental factors affecting the company. This preview is the exact document you’ll receive after purchase—fully formatted and ready to use, with no placeholders or surprises.

Skip the Research. Get the Strategy.
Discover how political shifts, supply-chain dynamics, and evolving environmental standards are shaping CSW Industrials' strategic outlook in our concise PESTLE snapshot; use these insights to refine investment and operational decisions. This expert-ready analysis highlights risks and growth levers you can act on today. Purchase the full PESTLE for a complete, editable breakdown and instant download.
Political factors
Infrastructure and industrial policy tailwinds
Federal programs like the 2021 Infrastructure Investment and Jobs Act (roughly 1.2 trillion) and the Inflation Reduction Act (about 369 billion for energy and climate) boost demand across HVAC/R, plumbing and engineered building solutions by funding public facility, grid and efficiency upgrades. These programs favor durable, high-performance products but timing and allocation variability produce lumpy order patterns. CSW Industrials can align product roadmaps to funded priorities to capture market share.
Trade policy, tariffs, and supply-chain localization
Tariffs such as Section 232 steel (25%) and aluminum (10%) and US-China tariffs on many industrial goods raise CSW Industrials input costs and shift sourcing. Federal incentives like the CHIPS Act (52 billion USD) and Inflation Reduction Act (~369 billion USD) favor reshoring and domestic footprints. Policy swings force pricing and margin volatility that firms hedge or pass through, while diversified regional suppliers reduce trade-risk exposure.
Energy policy and HVAC efficiency agendas
Government pushes for building energy efficiency — buildings consume roughly 40% of global energy — elevate demand for high-performance HVAC/R and sealing solutions, directly benefiting CSW Industrials’ specialty chemicals and engineered-product lines.
Expanded incentives and rebate programs (eg, US Inflation Reduction Act measures and EU retrofit funding) have accelerated retrofits, improving addressable markets for sealants and HVAC components.
Policy reversals or implementation delays could slow adoption curves and cap near-term growth; proactive certification and advocacy preserve eligibility across programs and revenue streams.
State and municipal code enforcement intensity
Local governments drive differing enforcement levels for building and safety standards, creating a patchwork across roughly 19,500 U.S. municipal governments (U.S. Census Bureau). Stricter enforcement increases demand for compliant sealing, ventilation, and safety products and accelerates retrofit cycles. Fragmentation raises complexity in labeling, approvals, and inventory, while a robust code‑compliance library and local relationships speed specification wins.
- 19,500 U.S. municipalities: fragmented enforcement
- Stricter codes → higher demand for compliant products
- Fragmentation increases labeling/approval complexity
- Local relationships and compliance library shorten spec timelines
Geopolitical stability and critical inputs
Global tensions since 2022 have disrupted specialty chemical precursors and industrial components, with sanctions on Russia and export controls on advanced materials persisting into 2024 and constraining suppliers and customers. Freight and marine insurance premiums have spiked during episodes of uncertainty, raising landed costs and lead-time risk. CSW's multi-sourcing and inventory buffers help sustain service levels.
- Sanctions on Russia (2022–2024) limited feedstock sources
- Export controls on advanced-tech materials affected supplier access
- Higher freight/insurance during crises increased logistics costs
- Multi-sourcing + inventory buffers mitigate service disruptions
IIJA/IRA funds drive HVAC/plumbing demand; tariffs raise costs; local codes decide winners
Federal acts (IIJA ~1.2T; IRA ~US$369B) boost HVAC/plumbing demand but create lumpy orders; Section 232 steel/aluminum tariffs (25%/10%) and 2022–24 sanctions raise input costs; buildings ~40% of energy use and ~19,500 US municipalities create patchwork codes—local compliance wins market share.
| Factor | Stat | Impact |
|---|---|---|
| Infrastructure/energy | IIJA 1.2T; IRA US$369B | ↑ addressable market |
| Tariffs/sanctions | Steel 25%/Al 10%; 2022–24 sanctions | ↑ input costs |
What is included in the product
Detailed Word Document
Explores how Political, Economic, Social, Technological, Environmental, and Legal forces uniquely impact CSW Industrials, combining data-backed trends and region-specific regulatory context; designed by strategy professionals to support executives and investors with forward-looking, insert-ready insights for planning and risk mitigation.
Customizable Excel Spreadsheet
Provides a concise, presentation-ready PESTLE summary for CSW Industrials that’s visually segmented for quick interpretation, easily editable for region or business-line notes, and instantly shareable to align teams during planning or client-facing reports.
Economic factors
Construction and industrial cycle sensitivity
CSW Industrials end markets are closely tied to non-residential construction, maintenance and industrial production, with FY2024 net sales of about $1.3 billion reflecting that exposure. New starts, retrofit activity and MRO budgets drive demand amplitude; Dodge data showed nonresidential starts down roughly 5% in 2024, while MRO spending stayed resilient. Counter-cyclical MRO work helps cushion new-build downturns and CSW’s balanced segment mix reduces earnings volatility.
Interest rates and capital spending
Higher policy rates (federal funds ~5.25–5.50% in mid‑2025) depress construction financing and developer ROI, delaying projects and reducing near‑term demand for CSW Industrials' building products. Easing cycles historically unlock backlogs and boost contractor confidence, accelerating orderbooks. Customer affordability—30‑year mortgage rates near 7%—shapes price elasticity and SKU mix. Rate trajectory guidance is critical for inventory and capacity planning.
Raw material inflation and cost pass-through
Metals, resins and chemical inputs create margin risk when prices spike, with commodity inputs swinging roughly 10–30% across 2023–2024 in key markets, pressuring OEM margins. Effective surcharges and dynamic pricing actions are vital to maintain profitability, and timely index-based surcharges helped many industrials recoup input inflation in 2024. Contract structures and lead times dictate pass-through speed, with long-term fixed contracts delaying recovery. Supplier partnerships and formulation flexibility enhance resilience by enabling substitution and joint cost programs.
Labor availability and contractor productivity
Labor shortages in skilled trades are slowing installations and shifting demand toward labor-saving products; US construction employment was about 7.6 million in 2024 (BLS), keeping contractor capacity tight. Premiums for reliability and ease-of-use enable value pricing, while wage inflation raises customers' total cost of ownership; training and field support shorten adoption cycles.
- Labor scarcity → demand for labor-saving solutions
- 7.6M construction jobs (BLS 2024)
- Reliability supports premium pricing
- Wage inflation raises TCO
- Training/field support accelerates adoption
FX and geographic revenue mix
CSW Industrials is predominantly U.S.-centric, which limits direct FX exposure but concentrates macro risk in the U.S.; FY2024 revenue was about $1.0 billion, with over 70% of sales domestic, reducing currency translation impacts.
Currency swings affect import costs and export competitiveness, with a stronger USD in 2022–24 compressing imported input costs but making exports less competitive.
Diversifying sales by region and currency and increasing local sourcing creates natural hedges that can stabilize margin volatility.
- FY2024 revenue ~ $1.0B
- Domestic sales >70%
- Stronger USD 2022–24 eased import inflation
- Local sourcing = natural hedge
IIJA/IRA funds drive HVAC/plumbing demand; tariffs raise costs; local codes decide winners
CSW Industrials’ demand links to nonresidential construction and MRO; FY2024 net sales ~$1.3B with >70% domestic, while nonresidential starts fell ~5% in 2024. Fed funds ~5.25–5.50% (mid‑2025) and 30y mortgage ~7% weigh on new-builds; MRO and labor‑saving products cushion downturns. Commodity inputs swung ~10–30% in 2023–24, pressuring margins amid wage inflation and 7.6M construction jobs (BLS 2024).
| Metric | Value |
|---|---|
| FY2024 net sales | $1.3B |
| Domestic share | >70% |
| Nonresidential starts 2024 | −5% |
| Fed funds (mid‑2025) | 5.25–5.50% |
| Construction jobs 2024 | 7.6M |
Preview Before You Purchase
CSW Industrials PESTLE Analysis
The CSW Industrials PESTLE Analysis presents a concise, professionally formatted review of political, economic, social, technological, legal, and environmental factors affecting the company. This preview is the exact document you’ll receive after purchase—fully formatted and ready to use, with no placeholders or surprises.
Original: $10.00
-65%$10.00
$3.50Description
Skip the Research. Get the Strategy.
Discover how political shifts, supply-chain dynamics, and evolving environmental standards are shaping CSW Industrials' strategic outlook in our concise PESTLE snapshot; use these insights to refine investment and operational decisions. This expert-ready analysis highlights risks and growth levers you can act on today. Purchase the full PESTLE for a complete, editable breakdown and instant download.
Political factors
Infrastructure and industrial policy tailwinds
Federal programs like the 2021 Infrastructure Investment and Jobs Act (roughly 1.2 trillion) and the Inflation Reduction Act (about 369 billion for energy and climate) boost demand across HVAC/R, plumbing and engineered building solutions by funding public facility, grid and efficiency upgrades. These programs favor durable, high-performance products but timing and allocation variability produce lumpy order patterns. CSW Industrials can align product roadmaps to funded priorities to capture market share.
Trade policy, tariffs, and supply-chain localization
Tariffs such as Section 232 steel (25%) and aluminum (10%) and US-China tariffs on many industrial goods raise CSW Industrials input costs and shift sourcing. Federal incentives like the CHIPS Act (52 billion USD) and Inflation Reduction Act (~369 billion USD) favor reshoring and domestic footprints. Policy swings force pricing and margin volatility that firms hedge or pass through, while diversified regional suppliers reduce trade-risk exposure.
Energy policy and HVAC efficiency agendas
Government pushes for building energy efficiency — buildings consume roughly 40% of global energy — elevate demand for high-performance HVAC/R and sealing solutions, directly benefiting CSW Industrials’ specialty chemicals and engineered-product lines.
Expanded incentives and rebate programs (eg, US Inflation Reduction Act measures and EU retrofit funding) have accelerated retrofits, improving addressable markets for sealants and HVAC components.
Policy reversals or implementation delays could slow adoption curves and cap near-term growth; proactive certification and advocacy preserve eligibility across programs and revenue streams.
State and municipal code enforcement intensity
Local governments drive differing enforcement levels for building and safety standards, creating a patchwork across roughly 19,500 U.S. municipal governments (U.S. Census Bureau). Stricter enforcement increases demand for compliant sealing, ventilation, and safety products and accelerates retrofit cycles. Fragmentation raises complexity in labeling, approvals, and inventory, while a robust code‑compliance library and local relationships speed specification wins.
- 19,500 U.S. municipalities: fragmented enforcement
- Stricter codes → higher demand for compliant products
- Fragmentation increases labeling/approval complexity
- Local relationships and compliance library shorten spec timelines
Geopolitical stability and critical inputs
Global tensions since 2022 have disrupted specialty chemical precursors and industrial components, with sanctions on Russia and export controls on advanced materials persisting into 2024 and constraining suppliers and customers. Freight and marine insurance premiums have spiked during episodes of uncertainty, raising landed costs and lead-time risk. CSW's multi-sourcing and inventory buffers help sustain service levels.
- Sanctions on Russia (2022–2024) limited feedstock sources
- Export controls on advanced-tech materials affected supplier access
- Higher freight/insurance during crises increased logistics costs
- Multi-sourcing + inventory buffers mitigate service disruptions
IIJA/IRA funds drive HVAC/plumbing demand; tariffs raise costs; local codes decide winners
Federal acts (IIJA ~1.2T; IRA ~US$369B) boost HVAC/plumbing demand but create lumpy orders; Section 232 steel/aluminum tariffs (25%/10%) and 2022–24 sanctions raise input costs; buildings ~40% of energy use and ~19,500 US municipalities create patchwork codes—local compliance wins market share.
| Factor | Stat | Impact |
|---|---|---|
| Infrastructure/energy | IIJA 1.2T; IRA US$369B | ↑ addressable market |
| Tariffs/sanctions | Steel 25%/Al 10%; 2022–24 sanctions | ↑ input costs |
What is included in the product
Detailed Word Document
Explores how Political, Economic, Social, Technological, Environmental, and Legal forces uniquely impact CSW Industrials, combining data-backed trends and region-specific regulatory context; designed by strategy professionals to support executives and investors with forward-looking, insert-ready insights for planning and risk mitigation.
Customizable Excel Spreadsheet
Provides a concise, presentation-ready PESTLE summary for CSW Industrials that’s visually segmented for quick interpretation, easily editable for region or business-line notes, and instantly shareable to align teams during planning or client-facing reports.
Economic factors
Construction and industrial cycle sensitivity
CSW Industrials end markets are closely tied to non-residential construction, maintenance and industrial production, with FY2024 net sales of about $1.3 billion reflecting that exposure. New starts, retrofit activity and MRO budgets drive demand amplitude; Dodge data showed nonresidential starts down roughly 5% in 2024, while MRO spending stayed resilient. Counter-cyclical MRO work helps cushion new-build downturns and CSW’s balanced segment mix reduces earnings volatility.
Interest rates and capital spending
Higher policy rates (federal funds ~5.25–5.50% in mid‑2025) depress construction financing and developer ROI, delaying projects and reducing near‑term demand for CSW Industrials' building products. Easing cycles historically unlock backlogs and boost contractor confidence, accelerating orderbooks. Customer affordability—30‑year mortgage rates near 7%—shapes price elasticity and SKU mix. Rate trajectory guidance is critical for inventory and capacity planning.
Raw material inflation and cost pass-through
Metals, resins and chemical inputs create margin risk when prices spike, with commodity inputs swinging roughly 10–30% across 2023–2024 in key markets, pressuring OEM margins. Effective surcharges and dynamic pricing actions are vital to maintain profitability, and timely index-based surcharges helped many industrials recoup input inflation in 2024. Contract structures and lead times dictate pass-through speed, with long-term fixed contracts delaying recovery. Supplier partnerships and formulation flexibility enhance resilience by enabling substitution and joint cost programs.
Labor availability and contractor productivity
Labor shortages in skilled trades are slowing installations and shifting demand toward labor-saving products; US construction employment was about 7.6 million in 2024 (BLS), keeping contractor capacity tight. Premiums for reliability and ease-of-use enable value pricing, while wage inflation raises customers' total cost of ownership; training and field support shorten adoption cycles.
- Labor scarcity → demand for labor-saving solutions
- 7.6M construction jobs (BLS 2024)
- Reliability supports premium pricing
- Wage inflation raises TCO
- Training/field support accelerates adoption
FX and geographic revenue mix
CSW Industrials is predominantly U.S.-centric, which limits direct FX exposure but concentrates macro risk in the U.S.; FY2024 revenue was about $1.0 billion, with over 70% of sales domestic, reducing currency translation impacts.
Currency swings affect import costs and export competitiveness, with a stronger USD in 2022–24 compressing imported input costs but making exports less competitive.
Diversifying sales by region and currency and increasing local sourcing creates natural hedges that can stabilize margin volatility.
- FY2024 revenue ~ $1.0B
- Domestic sales >70%
- Stronger USD 2022–24 eased import inflation
- Local sourcing = natural hedge
IIJA/IRA funds drive HVAC/plumbing demand; tariffs raise costs; local codes decide winners
CSW Industrials’ demand links to nonresidential construction and MRO; FY2024 net sales ~$1.3B with >70% domestic, while nonresidential starts fell ~5% in 2024. Fed funds ~5.25–5.50% (mid‑2025) and 30y mortgage ~7% weigh on new-builds; MRO and labor‑saving products cushion downturns. Commodity inputs swung ~10–30% in 2023–24, pressuring margins amid wage inflation and 7.6M construction jobs (BLS 2024).
| Metric | Value |
|---|---|
| FY2024 net sales | $1.3B |
| Domestic share | >70% |
| Nonresidential starts 2024 | −5% |
| Fed funds (mid‑2025) | 5.25–5.50% |
| Construction jobs 2024 | 7.6M |
Preview Before You Purchase
CSW Industrials PESTLE Analysis
The CSW Industrials PESTLE Analysis presents a concise, professionally formatted review of political, economic, social, technological, legal, and environmental factors affecting the company. This preview is the exact document you’ll receive after purchase—fully formatted and ready to use, with no placeholders or surprises.











