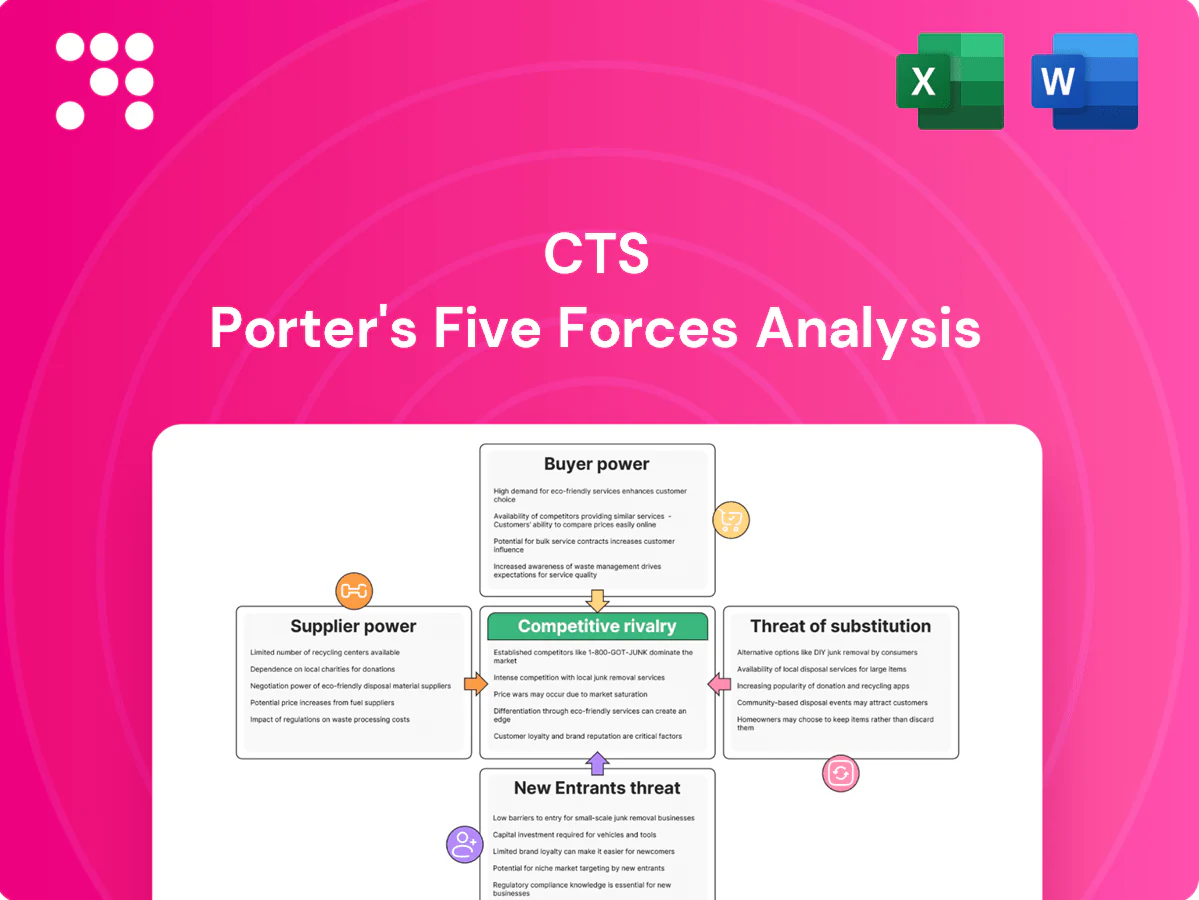
CTS Porter's Five Forces Analysis

Don't Miss the Bigger Picture
CTS’s Porter's Five Forces snapshot highlights buyer and supplier power, competitive rivalry, substitute threats, and entry barriers that shape profitability. This brief distills key pressures and strategic vulnerabilities in clear terms. Want deeper, data-driven force ratings, visuals and actionable implications tailored to CTS? Unlock the full Porter's Five Forces Analysis for a consultant-grade strategic toolkit.
Suppliers Bargaining Power

Specialty materials concentration
CTS relies on piezoelectric ceramics, rare earths and precision metals sourced from a few qualified suppliers, with China supplying over 60% of global rare-earth output in 2024, concentrating leverage; niche vendors can influence pricing and allocation. Qualification of alternates is slow given stringent reliability standards, extending lead times and certification cycles. Resulting switching costs and single-source dependencies materially elevate supplier bargaining power.
Certification and compliance barriers
Certification requirements such as AS9100, ISO 13485 and automotive-grade specs shrink CTS’s eligible supplier pool—by 2024 roughly 11,000 AS9100 and 27,000 ISO 13485 certificates existed globally, concentrating capacity among approved vendors. Suppliers holding these standards can demand tighter pricing, payment and lead-time terms. Mandatory audits plus PPAP/FAI workflows typically extend onboarding by several weeks and increase dependence on certified suppliers.

Semiconductor and PCB capacity cycles
Cyclical tightness in semiconductors and advanced PCBs shifts bargaining power upstream, with advanced IC lead times often extending 26+ weeks during peak cycles, forcing CTS into NCNR orders to secure capacity. Suppliers commonly prioritize larger-volume customers, increasing CTS exposure to allocation risk and price escalators; spot-premium spikes during past tight cycles exceeded 20–30% on select parts.

Tooling and custom process lock-in
Custom dies, ceramic formulations and proprietary test fixtures create single-source supply; tooling amortization (dies often $50k–$500k) ties volume commitments to specific suppliers. Re-qualification for new tooling can take 3–12 months and cost up to $1M in regulated sectors, entrenching supplier bargaining leverage and raising switching costs.
- Single-source risk: custom tooling
- Tooling cost: $50k–$500k
- Re-qual time/cost: 3–12 months, up to $1M
- Result: higher supplier leverage
Mitigants via scale and dual-sourcing
CTS’s global footprint and category-management approach aggregates demand across regions, improving negotiating leverage with suppliers and enabling volume rebates; dual-sourcing combined with should-cost analytics reduces pricing pressure and improves margin visibility, while long-term agreements lock in capacity and stabilize input costs; localized sourcing lowers logistics risk and supplier dependency.
- Scale: aggregated spend improves leverage
- Dual-sourcing: splits risk, sustains supply
- Should-cost: validates prices
- Long-term contracts: secure capacity
- Localization: reduces logistics exposure
Supply risk: China rare-earth >60%, IC lead 26+wks
CTS faces high supplier power due to >60% China rare-earth share (2024), long IC lead times (26+ weeks) and single-source tooling ($50k–$500k) that drive switching costs and re-qual costs (3–12 months, up to $1M). Certification concentration (AS9100 ~11,000; ISO13485 ~27,000) further narrows eligible vendors. Aggregated spend and dual-sourcing partially mitigate risk.
| Metric | Value |
|---|---|
| China rare-earth (2024) | ~60% |
| IC lead times | 26+ weeks |
| Tooling cost / re-qual | $50k–$500k / up to $1M, 3–12m |
What is included in the product
 Detailed Word Document
Concise Porter’s Five Forces for CTS, uncovering competitive intensity, buyer/supplier power, entry barriers, substitutes, and emerging disruptors with industry data and strategic commentary—fully editable for use in investor decks and strategy reports.

 Customizable Excel Spreadsheet
Clear one-sheet Porter's Five Forces summary with an instant spider/radar visualization to pinpoint strategic pressure, customizable pressure levels and labels you can swap with your own data—easy to use, no code, and ready to drop into decks or Excel dashboards for rapid decision-making.
Customers Bargaining Power

Concentrated OEM customer base
Large aerospace, medical and transportation OEMs exert outsized negotiating power, with major OEMs accounting for over 50% of supplier spend in these sectors (2024). Their volume commitments and brand leverage compress pricing and tighten payment and delivery terms. Vendor‑managed inventory and penalty clauses appear in a substantial share of contracts, shifting inventory risk onto suppliers. CTS must therefore deliver measurable value beyond price to protect margins.
High switching costs and qualification
Design-in cycles and regulatory qualifications, such as PPAP in automotive, commonly span 3–18 months and make replacements risky. Field reliability data and formal PPAP evidence create strong inertia against supplier changes, reducing buyer leverage after award. This stickiness generates multi-year revenue tails for CTS.

Design influence and spec ownership
Customers often control specifications and approved vendor lists, and 70–80% of product lifecycle costs are committed during design, so early design engagement can lock CTS in as a preferred source. If CTS is late to design it faces commoditization and margin compression from competitive bidding. Value engineering initiatives can either entrench CTS by adding proprietary value or shift bargaining power back to customers by enabling alternative suppliers.

LTAs and cost-down expectations
Multi-year LTAs frequently include annual price reductions, commonly 1–3% per year in manufacturing contracts in 2024; productivity-sharing clauses and index-based adjustments shift cost cuts to suppliers and compress margins. CTS must offset via yield gains and product-mix improvement or face rising buyer leverage over time.
- Annual LTA cuts: 1–3% (2024)
- Productivity-sharing compresses supplier margins
- Index clauses pass volatility to suppliers
- Need yield & mix gains to neutralize buyer power
Aftermarket and lifecycle dynamics
Aftermarket demand in A&D and medical segments delivers steadier, higher-margin revenue streams, often 20–30% above new-product margins in 2024, strengthening supplier leverage versus buyers.
Obsolescence management and last-time-buys concentrate purchase windows, shrinking buyer options and raising switching costs.
Lifecycle services — spares, repairs, training — now represent 20–35% of lifetime spend, moderating buyer power in later phases.
- Aftermarket margin uplift: 20–30%
- Lifecycle revenue share: 20–35%
- Concentrated last-time-buy windows reduce buyer alternatives
- Net effect: reduced buyer bargaining in later product phases
OEMs control >50% spend; LTAs force 1-3% cuts, aftermarket lifts margins
Large OEMs drive >50% supplier spend (2024), compressing pricing and terms; LTAs typically mandate 1–3% annual price cuts. Design-in stickiness (3–18 month quals) creates multi-year tails, while aftermarket margins run 20–30% higher and lifecycle revenues 20–35%, shifting bargaining power back to suppliers later.
| Metric | 2024 | Impact |
|---|---|---|
| OEM spend share | >50% | High buyer leverage |
| Annual LTA cuts | 1–3% | Margin pressure |
| Aftermarket margin uplift | 20–30% | Supplier leverage |
| Lifecycle rev share | 20–35% | Reduces buyer power |
Full Version Awaits
CTS Porter's Five Forces Analysis
This preview shows the exact CTS Porter's Five Forces Analysis you'll receive after purchase—no placeholders or mockups. The file is the full, professionally formatted analysis, ready for immediate download and use. Once you complete payment, you'll gain instant access to this same document.

Don't Miss the Bigger Picture
CTS’s Porter's Five Forces snapshot highlights buyer and supplier power, competitive rivalry, substitute threats, and entry barriers that shape profitability. This brief distills key pressures and strategic vulnerabilities in clear terms. Want deeper, data-driven force ratings, visuals and actionable implications tailored to CTS? Unlock the full Porter's Five Forces Analysis for a consultant-grade strategic toolkit.
Suppliers Bargaining Power
Specialty materials concentration
CTS relies on piezoelectric ceramics, rare earths and precision metals sourced from a few qualified suppliers, with China supplying over 60% of global rare-earth output in 2024, concentrating leverage; niche vendors can influence pricing and allocation. Qualification of alternates is slow given stringent reliability standards, extending lead times and certification cycles. Resulting switching costs and single-source dependencies materially elevate supplier bargaining power.
Certification and compliance barriers
Certification requirements such as AS9100, ISO 13485 and automotive-grade specs shrink CTS’s eligible supplier pool—by 2024 roughly 11,000 AS9100 and 27,000 ISO 13485 certificates existed globally, concentrating capacity among approved vendors. Suppliers holding these standards can demand tighter pricing, payment and lead-time terms. Mandatory audits plus PPAP/FAI workflows typically extend onboarding by several weeks and increase dependence on certified suppliers.
Semiconductor and PCB capacity cycles
Cyclical tightness in semiconductors and advanced PCBs shifts bargaining power upstream, with advanced IC lead times often extending 26+ weeks during peak cycles, forcing CTS into NCNR orders to secure capacity. Suppliers commonly prioritize larger-volume customers, increasing CTS exposure to allocation risk and price escalators; spot-premium spikes during past tight cycles exceeded 20–30% on select parts.
Tooling and custom process lock-in
Custom dies, ceramic formulations and proprietary test fixtures create single-source supply; tooling amortization (dies often $50k–$500k) ties volume commitments to specific suppliers. Re-qualification for new tooling can take 3–12 months and cost up to $1M in regulated sectors, entrenching supplier bargaining leverage and raising switching costs.
- Single-source risk: custom tooling
- Tooling cost: $50k–$500k
- Re-qual time/cost: 3–12 months, up to $1M
- Result: higher supplier leverage
Mitigants via scale and dual-sourcing
CTS’s global footprint and category-management approach aggregates demand across regions, improving negotiating leverage with suppliers and enabling volume rebates; dual-sourcing combined with should-cost analytics reduces pricing pressure and improves margin visibility, while long-term agreements lock in capacity and stabilize input costs; localized sourcing lowers logistics risk and supplier dependency.
- Scale: aggregated spend improves leverage
- Dual-sourcing: splits risk, sustains supply
- Should-cost: validates prices
- Long-term contracts: secure capacity
- Localization: reduces logistics exposure
Supply risk: China rare-earth >60%, IC lead 26+wks
CTS faces high supplier power due to >60% China rare-earth share (2024), long IC lead times (26+ weeks) and single-source tooling ($50k–$500k) that drive switching costs and re-qual costs (3–12 months, up to $1M). Certification concentration (AS9100 ~11,000; ISO13485 ~27,000) further narrows eligible vendors. Aggregated spend and dual-sourcing partially mitigate risk.
| Metric | Value |
|---|---|
| China rare-earth (2024) | ~60% |
| IC lead times | 26+ weeks |
| Tooling cost / re-qual | $50k–$500k / up to $1M, 3–12m |
What is included in the product
Detailed Word Document
Concise Porter’s Five Forces for CTS, uncovering competitive intensity, buyer/supplier power, entry barriers, substitutes, and emerging disruptors with industry data and strategic commentary—fully editable for use in investor decks and strategy reports.
Customizable Excel Spreadsheet
Clear one-sheet Porter's Five Forces summary with an instant spider/radar visualization to pinpoint strategic pressure, customizable pressure levels and labels you can swap with your own data—easy to use, no code, and ready to drop into decks or Excel dashboards for rapid decision-making.
Customers Bargaining Power
Concentrated OEM customer base
Large aerospace, medical and transportation OEMs exert outsized negotiating power, with major OEMs accounting for over 50% of supplier spend in these sectors (2024). Their volume commitments and brand leverage compress pricing and tighten payment and delivery terms. Vendor‑managed inventory and penalty clauses appear in a substantial share of contracts, shifting inventory risk onto suppliers. CTS must therefore deliver measurable value beyond price to protect margins.
High switching costs and qualification
Design-in cycles and regulatory qualifications, such as PPAP in automotive, commonly span 3–18 months and make replacements risky. Field reliability data and formal PPAP evidence create strong inertia against supplier changes, reducing buyer leverage after award. This stickiness generates multi-year revenue tails for CTS.
Design influence and spec ownership
Customers often control specifications and approved vendor lists, and 70–80% of product lifecycle costs are committed during design, so early design engagement can lock CTS in as a preferred source. If CTS is late to design it faces commoditization and margin compression from competitive bidding. Value engineering initiatives can either entrench CTS by adding proprietary value or shift bargaining power back to customers by enabling alternative suppliers.
LTAs and cost-down expectations
Multi-year LTAs frequently include annual price reductions, commonly 1–3% per year in manufacturing contracts in 2024; productivity-sharing clauses and index-based adjustments shift cost cuts to suppliers and compress margins. CTS must offset via yield gains and product-mix improvement or face rising buyer leverage over time.
- Annual LTA cuts: 1–3% (2024)
- Productivity-sharing compresses supplier margins
- Index clauses pass volatility to suppliers
- Need yield & mix gains to neutralize buyer power
Aftermarket and lifecycle dynamics
Aftermarket demand in A&D and medical segments delivers steadier, higher-margin revenue streams, often 20–30% above new-product margins in 2024, strengthening supplier leverage versus buyers.
Obsolescence management and last-time-buys concentrate purchase windows, shrinking buyer options and raising switching costs.
Lifecycle services — spares, repairs, training — now represent 20–35% of lifetime spend, moderating buyer power in later phases.
- Aftermarket margin uplift: 20–30%
- Lifecycle revenue share: 20–35%
- Concentrated last-time-buy windows reduce buyer alternatives
- Net effect: reduced buyer bargaining in later product phases
OEMs control >50% spend; LTAs force 1-3% cuts, aftermarket lifts margins
Large OEMs drive >50% supplier spend (2024), compressing pricing and terms; LTAs typically mandate 1–3% annual price cuts. Design-in stickiness (3–18 month quals) creates multi-year tails, while aftermarket margins run 20–30% higher and lifecycle revenues 20–35%, shifting bargaining power back to suppliers later.
| Metric | 2024 | Impact |
|---|---|---|
| OEM spend share | >50% | High buyer leverage |
| Annual LTA cuts | 1–3% | Margin pressure |
| Aftermarket margin uplift | 20–30% | Supplier leverage |
| Lifecycle rev share | 20–35% | Reduces buyer power |
Full Version Awaits
CTS Porter's Five Forces Analysis
This preview shows the exact CTS Porter's Five Forces Analysis you'll receive after purchase—no placeholders or mockups. The file is the full, professionally formatted analysis, ready for immediate download and use. Once you complete payment, you'll gain instant access to this same document.
Original: $10.00
-65%$10.00
$3.50Description
Don't Miss the Bigger Picture
CTS’s Porter's Five Forces snapshot highlights buyer and supplier power, competitive rivalry, substitute threats, and entry barriers that shape profitability. This brief distills key pressures and strategic vulnerabilities in clear terms. Want deeper, data-driven force ratings, visuals and actionable implications tailored to CTS? Unlock the full Porter's Five Forces Analysis for a consultant-grade strategic toolkit.
Suppliers Bargaining Power
Specialty materials concentration
CTS relies on piezoelectric ceramics, rare earths and precision metals sourced from a few qualified suppliers, with China supplying over 60% of global rare-earth output in 2024, concentrating leverage; niche vendors can influence pricing and allocation. Qualification of alternates is slow given stringent reliability standards, extending lead times and certification cycles. Resulting switching costs and single-source dependencies materially elevate supplier bargaining power.
Certification and compliance barriers
Certification requirements such as AS9100, ISO 13485 and automotive-grade specs shrink CTS’s eligible supplier pool—by 2024 roughly 11,000 AS9100 and 27,000 ISO 13485 certificates existed globally, concentrating capacity among approved vendors. Suppliers holding these standards can demand tighter pricing, payment and lead-time terms. Mandatory audits plus PPAP/FAI workflows typically extend onboarding by several weeks and increase dependence on certified suppliers.
Semiconductor and PCB capacity cycles
Cyclical tightness in semiconductors and advanced PCBs shifts bargaining power upstream, with advanced IC lead times often extending 26+ weeks during peak cycles, forcing CTS into NCNR orders to secure capacity. Suppliers commonly prioritize larger-volume customers, increasing CTS exposure to allocation risk and price escalators; spot-premium spikes during past tight cycles exceeded 20–30% on select parts.
Tooling and custom process lock-in
Custom dies, ceramic formulations and proprietary test fixtures create single-source supply; tooling amortization (dies often $50k–$500k) ties volume commitments to specific suppliers. Re-qualification for new tooling can take 3–12 months and cost up to $1M in regulated sectors, entrenching supplier bargaining leverage and raising switching costs.
- Single-source risk: custom tooling
- Tooling cost: $50k–$500k
- Re-qual time/cost: 3–12 months, up to $1M
- Result: higher supplier leverage
Mitigants via scale and dual-sourcing
CTS’s global footprint and category-management approach aggregates demand across regions, improving negotiating leverage with suppliers and enabling volume rebates; dual-sourcing combined with should-cost analytics reduces pricing pressure and improves margin visibility, while long-term agreements lock in capacity and stabilize input costs; localized sourcing lowers logistics risk and supplier dependency.
- Scale: aggregated spend improves leverage
- Dual-sourcing: splits risk, sustains supply
- Should-cost: validates prices
- Long-term contracts: secure capacity
- Localization: reduces logistics exposure
Supply risk: China rare-earth >60%, IC lead 26+wks
CTS faces high supplier power due to >60% China rare-earth share (2024), long IC lead times (26+ weeks) and single-source tooling ($50k–$500k) that drive switching costs and re-qual costs (3–12 months, up to $1M). Certification concentration (AS9100 ~11,000; ISO13485 ~27,000) further narrows eligible vendors. Aggregated spend and dual-sourcing partially mitigate risk.
| Metric | Value |
|---|---|
| China rare-earth (2024) | ~60% |
| IC lead times | 26+ weeks |
| Tooling cost / re-qual | $50k–$500k / up to $1M, 3–12m |
What is included in the product
Detailed Word Document
Concise Porter’s Five Forces for CTS, uncovering competitive intensity, buyer/supplier power, entry barriers, substitutes, and emerging disruptors with industry data and strategic commentary—fully editable for use in investor decks and strategy reports.
Customizable Excel Spreadsheet
Clear one-sheet Porter's Five Forces summary with an instant spider/radar visualization to pinpoint strategic pressure, customizable pressure levels and labels you can swap with your own data—easy to use, no code, and ready to drop into decks or Excel dashboards for rapid decision-making.
Customers Bargaining Power
Concentrated OEM customer base
Large aerospace, medical and transportation OEMs exert outsized negotiating power, with major OEMs accounting for over 50% of supplier spend in these sectors (2024). Their volume commitments and brand leverage compress pricing and tighten payment and delivery terms. Vendor‑managed inventory and penalty clauses appear in a substantial share of contracts, shifting inventory risk onto suppliers. CTS must therefore deliver measurable value beyond price to protect margins.
High switching costs and qualification
Design-in cycles and regulatory qualifications, such as PPAP in automotive, commonly span 3–18 months and make replacements risky. Field reliability data and formal PPAP evidence create strong inertia against supplier changes, reducing buyer leverage after award. This stickiness generates multi-year revenue tails for CTS.
Design influence and spec ownership
Customers often control specifications and approved vendor lists, and 70–80% of product lifecycle costs are committed during design, so early design engagement can lock CTS in as a preferred source. If CTS is late to design it faces commoditization and margin compression from competitive bidding. Value engineering initiatives can either entrench CTS by adding proprietary value or shift bargaining power back to customers by enabling alternative suppliers.
LTAs and cost-down expectations
Multi-year LTAs frequently include annual price reductions, commonly 1–3% per year in manufacturing contracts in 2024; productivity-sharing clauses and index-based adjustments shift cost cuts to suppliers and compress margins. CTS must offset via yield gains and product-mix improvement or face rising buyer leverage over time.
- Annual LTA cuts: 1–3% (2024)
- Productivity-sharing compresses supplier margins
- Index clauses pass volatility to suppliers
- Need yield & mix gains to neutralize buyer power
Aftermarket and lifecycle dynamics
Aftermarket demand in A&D and medical segments delivers steadier, higher-margin revenue streams, often 20–30% above new-product margins in 2024, strengthening supplier leverage versus buyers.
Obsolescence management and last-time-buys concentrate purchase windows, shrinking buyer options and raising switching costs.
Lifecycle services — spares, repairs, training — now represent 20–35% of lifetime spend, moderating buyer power in later phases.
- Aftermarket margin uplift: 20–30%
- Lifecycle revenue share: 20–35%
- Concentrated last-time-buy windows reduce buyer alternatives
- Net effect: reduced buyer bargaining in later product phases
OEMs control >50% spend; LTAs force 1-3% cuts, aftermarket lifts margins
Large OEMs drive >50% supplier spend (2024), compressing pricing and terms; LTAs typically mandate 1–3% annual price cuts. Design-in stickiness (3–18 month quals) creates multi-year tails, while aftermarket margins run 20–30% higher and lifecycle revenues 20–35%, shifting bargaining power back to suppliers later.
| Metric | 2024 | Impact |
|---|---|---|
| OEM spend share | >50% | High buyer leverage |
| Annual LTA cuts | 1–3% | Margin pressure |
| Aftermarket margin uplift | 20–30% | Supplier leverage |
| Lifecycle rev share | 20–35% | Reduces buyer power |
Full Version Awaits
CTS Porter's Five Forces Analysis
This preview shows the exact CTS Porter's Five Forces Analysis you'll receive after purchase—no placeholders or mockups. The file is the full, professionally formatted analysis, ready for immediate download and use. Once you complete payment, you'll gain instant access to this same document.











