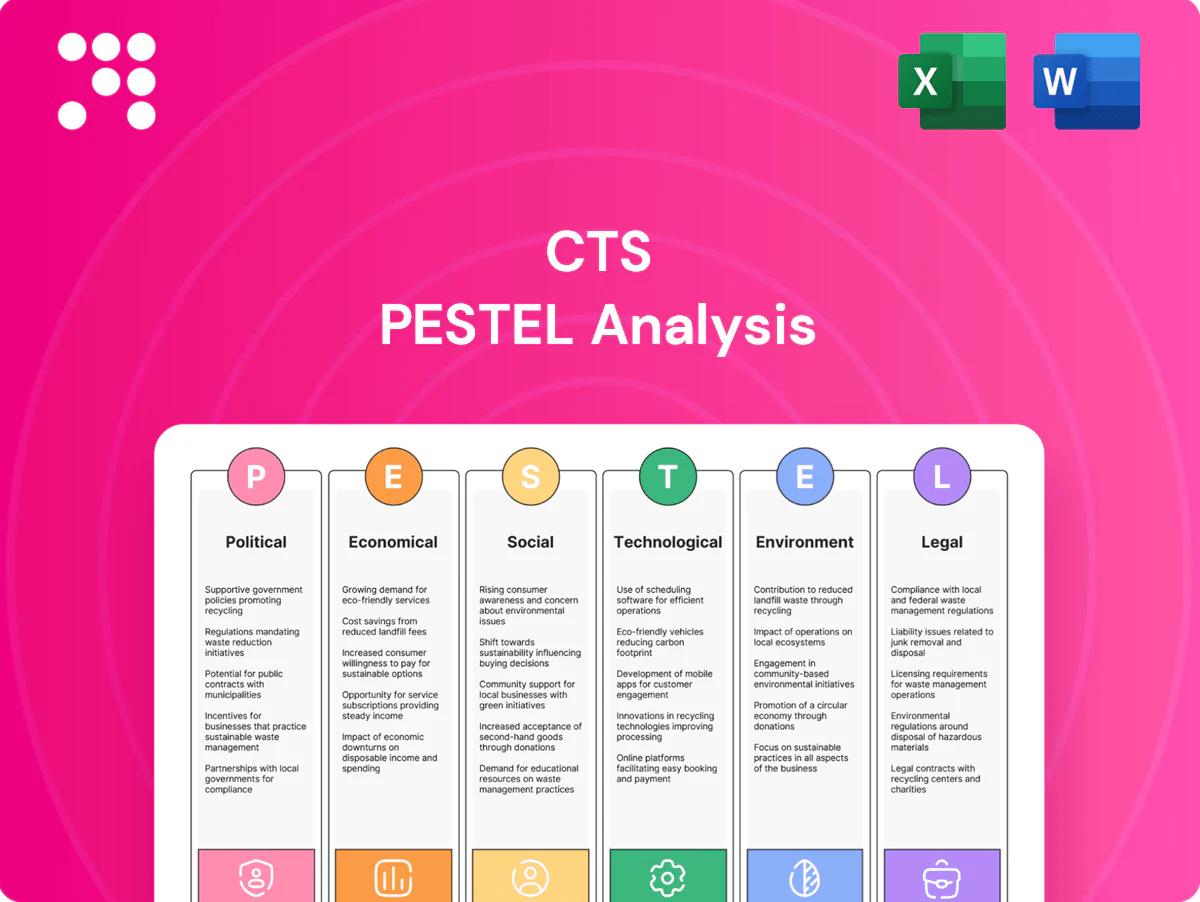
CTS PESTLE Analysis

Skip the Research. Get the Strategy.
Unlock strategic clarity with our targeted PESTLE analysis of CTS — three to five minute read that pinpoints political, economic, social, technological, legal and environmental forces shaping its future. Ideal for investors and strategists, it translates trends into actionable risks and opportunities. Purchase the full report to access the complete breakdown and ready-to-use insights.
Political factors

Defense spending cycles
CTS’s aerospace and defense exposure ties revenue to national defense budgets and procurement cycles; US defense discretionary spending is about $858 billion for FY2025 and NATO allies combined spend over $1.2 trillion (2024), influencing program volume.
Increases in allocations can lift demand for mission-critical sensors and actuators, while sequestration or shifting priorities can delay programs and orders.
Monitoring multi-year defense appropriations, multiyear procurement plans and allies’ spending trajectories is essential for revenue visibility and backlog management.
Trade policy and tariffs
Import/export duties on electronics, sub-assemblies and raw materials directly raise CTS unit costs and selling prices; US Section 301 tariffs on many Chinese electronics remain at up to 25%, squeezing margins. Tariff volatility has forced supplier re-sourcing and customer price renegotiations in 2023–24. Preferential agreements such as RCEP (covers ~30% of global GDP) can improve margin competitiveness. Diversified manufacturing footprints across Mexico, Vietnam and India mitigate tariff shocks.

Geopolitical tensions
Regional conflicts and sanctions can disrupt supply chains for semiconductors and specialty materials—global semiconductor sales were $573.6B in 2023, so chokepoints ripple revenue and lead times. Defense customers face export restrictions (US 2022–24 chip controls vs China) that can reshape program scopes. CTS must maintain contingency sourcing and 3–6 months inventory buffers. Political risk insurance and scenario planning reduce exposure.

Industrial policy incentives
Government subsidies like the US CHIPS and Science Act (authorizes $52.7 billion) and the EU’s estimated €43 billion public investment target lower capex and accelerate capacity; grants and tax credits support onshoring and workforce training; participation requires compliance with domestic content rules; timely applications and partnerships maximize benefit capture.
- CHIPS Act: $52.7B
- EU target: €43B
- Requires domestic content compliance
- Apply early; use strategic partners
Export controls
Export controls under ITAR (DDTC) and EAR (BIS) restrict sales of dual-use technologies and technical data transfers, forcing licenses that can extend sales cycles and block certain geographies.
Companies need robust classification and screening processes tied to the U.S. Consolidated Screening List to avoid costly missteps that can lead to fines, debarment, and reputational harm.
- ITAR/EAR enforcement: regulatory license hurdles
- Classification + screening: essential compliance
- Consequences: fines, debarment, reputational damage
Tied to US $858B & NATO >$1.2T; tariffs, CHIPS risk
CTS’s defense exposure ties revenue to FY2025 US defense discretionary spending ~$858B and NATO allies’ >$1.2T (2024), driving program volume and backlog.
Tariff volatility (US Section 301 up to 25%) and export controls (ITAR/EAR) raise costs, extend cycles and restrict markets.
Subsidies (CHIPS $52.7B) and onshoring incentives lower capex but require domestic content compliance and proactive applications.
| Metric | Value |
|---|---|
| US defense FY2025 | $858B |
| NATO spend 2024 | >$1.2T |
| CHIPS Act | $52.7B |
| Global semis 2023 | $573.6B |
| Section 301 tariffs | Up to 25% |
What is included in the product
 Detailed Word Document
Explores how external macro-environmental factors uniquely affect the CTS across six dimensions—Political, Economic, Social, Technological, Environmental, and Legal—each backed by relevant data and trends to ensure reliability. Designed for executives, consultants, and entrepreneurs, the analysis is region- and industry-specific, forward-looking, and formatted for direct use in plans, decks, or reports.

 Customizable Excel Spreadsheet
CTS PESTLE Analysis delivers a clean, visually segmented summary of external factors that’s easily editable, shareable, and drop‑in ready for meetings, presentations, or cross‑team alignment to streamline risk discussions and strategic planning.
Economic factors

Industrial demand cyclicality
Sensors and actuators for factory automation and transport closely track PMI and capex cycles; ISM manufacturing PMI dipped below 50 several months in 2024, coinciding with softer industrial capex. Downturns delay retrofits and new-platform investments, while existing order backlogs (commonly 3–9 months) cushion revenue but cannot eliminate volatility. Flexible cost structures and variable sourcing helped stabilize margins during 2024 stress.
Cost inflation and FX
Rising input costs — metals up ~12% YoY in 2024, ceramics feedstocks ~8% and wafer costs near +15% — pressure CTS gross margins. Currency swings (USD moves ±10% vs major peers in 2023–24) affect reported revenues and cross‑border cost bases. Active hedging (covering ~70% of FX exposure) and local pricing reduce volatility. Strategic inventory and multi‑year supplier contracts improve cost visibility and supply resilience.

Interest rates and capex
Higher rates (US policy rate 5.25–5.50% in 2024, 10‑yr Treasury ~4% in 2024) raise customer hurdle rates and slow industrial, medical and mobility project approvals; increased financing costs constrain CTS’s expansion and M&A; lower-rate windows boost platform wins and capacity adds; disciplined capital allocation preserves resilience.

EV and mobility mix shift
Electrification and faster ADAS adoption raise sensor content per vehicle, supporting higher content value even as unit volumes shift; EVs reached roughly 14% of global passenger-car sales in 2023 (IEA), with uptake driven by subsidies, consumer demand and charging availability.
Platform timing creates booking-to-bill swings for CTS as OEM program launches cluster; content gains can offset softness in ICE-heavy segments.
- EV share ~14% of sales (2023)
- Charging, subsidies drive pace
- Platform timing = booking-to-bill volatility
Customer concentration
- Top customers often represent >50% of segment revenue
- Qualification cycles typically 12–36 months
- Multi-year contracts commonly 3–5 years
Tied to US $858B & NATO >$1.2T; tariffs, CHIPS risk
Sensors/actuators track PMI and capex; ISM manufacturing PMI dipped <50 in 2024, softening industrial capex and lengthening booking volatility; backlogs 3–9 months. Input inflation: metals +12% YoY (2024), wafers +15%, FX swings ±10% (2023–24). US rate 5.25–5.50% (2024) raises customer hurdle rates; EVs ~14% global sales (2023) boost sensor content.
| Metric | 2023–24 |
|---|---|
| ISM PMI | <50 (2024) |
| Metals YoY | +12% |
| Wafers YoY | +15% |
| USD FX swing | ±10% |
| US policy rate | 5.25–5.50% |
| EV share | ~14% |
Preview the Actual Deliverable
CTS PESTLE Analysis
The preview shown here is the exact CTS PESTLE Analysis document you’ll receive after purchase—fully formatted, finalized, and ready to use. The layout, content, and structure match the downloadable file with no placeholders or alterations. After checkout you’ll get this identical, professionally structured report instantly.

Skip the Research. Get the Strategy.
Unlock strategic clarity with our targeted PESTLE analysis of CTS — three to five minute read that pinpoints political, economic, social, technological, legal and environmental forces shaping its future. Ideal for investors and strategists, it translates trends into actionable risks and opportunities. Purchase the full report to access the complete breakdown and ready-to-use insights.
Political factors
Defense spending cycles
CTS’s aerospace and defense exposure ties revenue to national defense budgets and procurement cycles; US defense discretionary spending is about $858 billion for FY2025 and NATO allies combined spend over $1.2 trillion (2024), influencing program volume.
Increases in allocations can lift demand for mission-critical sensors and actuators, while sequestration or shifting priorities can delay programs and orders.
Monitoring multi-year defense appropriations, multiyear procurement plans and allies’ spending trajectories is essential for revenue visibility and backlog management.
Trade policy and tariffs
Import/export duties on electronics, sub-assemblies and raw materials directly raise CTS unit costs and selling prices; US Section 301 tariffs on many Chinese electronics remain at up to 25%, squeezing margins. Tariff volatility has forced supplier re-sourcing and customer price renegotiations in 2023–24. Preferential agreements such as RCEP (covers ~30% of global GDP) can improve margin competitiveness. Diversified manufacturing footprints across Mexico, Vietnam and India mitigate tariff shocks.
Geopolitical tensions
Regional conflicts and sanctions can disrupt supply chains for semiconductors and specialty materials—global semiconductor sales were $573.6B in 2023, so chokepoints ripple revenue and lead times. Defense customers face export restrictions (US 2022–24 chip controls vs China) that can reshape program scopes. CTS must maintain contingency sourcing and 3–6 months inventory buffers. Political risk insurance and scenario planning reduce exposure.
Industrial policy incentives
Government subsidies like the US CHIPS and Science Act (authorizes $52.7 billion) and the EU’s estimated €43 billion public investment target lower capex and accelerate capacity; grants and tax credits support onshoring and workforce training; participation requires compliance with domestic content rules; timely applications and partnerships maximize benefit capture.
- CHIPS Act: $52.7B
- EU target: €43B
- Requires domestic content compliance
- Apply early; use strategic partners
Export controls
Export controls under ITAR (DDTC) and EAR (BIS) restrict sales of dual-use technologies and technical data transfers, forcing licenses that can extend sales cycles and block certain geographies.
Companies need robust classification and screening processes tied to the U.S. Consolidated Screening List to avoid costly missteps that can lead to fines, debarment, and reputational harm.
- ITAR/EAR enforcement: regulatory license hurdles
- Classification + screening: essential compliance
- Consequences: fines, debarment, reputational damage
Tied to US $858B & NATO >$1.2T; tariffs, CHIPS risk
CTS’s defense exposure ties revenue to FY2025 US defense discretionary spending ~$858B and NATO allies’ >$1.2T (2024), driving program volume and backlog.
Tariff volatility (US Section 301 up to 25%) and export controls (ITAR/EAR) raise costs, extend cycles and restrict markets.
Subsidies (CHIPS $52.7B) and onshoring incentives lower capex but require domestic content compliance and proactive applications.
| Metric | Value |
|---|---|
| US defense FY2025 | $858B |
| NATO spend 2024 | >$1.2T |
| CHIPS Act | $52.7B |
| Global semis 2023 | $573.6B |
| Section 301 tariffs | Up to 25% |
What is included in the product
Detailed Word Document
Explores how external macro-environmental factors uniquely affect the CTS across six dimensions—Political, Economic, Social, Technological, Environmental, and Legal—each backed by relevant data and trends to ensure reliability. Designed for executives, consultants, and entrepreneurs, the analysis is region- and industry-specific, forward-looking, and formatted for direct use in plans, decks, or reports.
Customizable Excel Spreadsheet
CTS PESTLE Analysis delivers a clean, visually segmented summary of external factors that’s easily editable, shareable, and drop‑in ready for meetings, presentations, or cross‑team alignment to streamline risk discussions and strategic planning.
Economic factors
Industrial demand cyclicality
Sensors and actuators for factory automation and transport closely track PMI and capex cycles; ISM manufacturing PMI dipped below 50 several months in 2024, coinciding with softer industrial capex. Downturns delay retrofits and new-platform investments, while existing order backlogs (commonly 3–9 months) cushion revenue but cannot eliminate volatility. Flexible cost structures and variable sourcing helped stabilize margins during 2024 stress.
Cost inflation and FX
Rising input costs — metals up ~12% YoY in 2024, ceramics feedstocks ~8% and wafer costs near +15% — pressure CTS gross margins. Currency swings (USD moves ±10% vs major peers in 2023–24) affect reported revenues and cross‑border cost bases. Active hedging (covering ~70% of FX exposure) and local pricing reduce volatility. Strategic inventory and multi‑year supplier contracts improve cost visibility and supply resilience.
Interest rates and capex
Higher rates (US policy rate 5.25–5.50% in 2024, 10‑yr Treasury ~4% in 2024) raise customer hurdle rates and slow industrial, medical and mobility project approvals; increased financing costs constrain CTS’s expansion and M&A; lower-rate windows boost platform wins and capacity adds; disciplined capital allocation preserves resilience.
EV and mobility mix shift
Electrification and faster ADAS adoption raise sensor content per vehicle, supporting higher content value even as unit volumes shift; EVs reached roughly 14% of global passenger-car sales in 2023 (IEA), with uptake driven by subsidies, consumer demand and charging availability.
Platform timing creates booking-to-bill swings for CTS as OEM program launches cluster; content gains can offset softness in ICE-heavy segments.
- EV share ~14% of sales (2023)
- Charging, subsidies drive pace
- Platform timing = booking-to-bill volatility
Customer concentration
- Top customers often represent >50% of segment revenue
- Qualification cycles typically 12–36 months
- Multi-year contracts commonly 3–5 years
Tied to US $858B & NATO >$1.2T; tariffs, CHIPS risk
Sensors/actuators track PMI and capex; ISM manufacturing PMI dipped <50 in 2024, softening industrial capex and lengthening booking volatility; backlogs 3–9 months. Input inflation: metals +12% YoY (2024), wafers +15%, FX swings ±10% (2023–24). US rate 5.25–5.50% (2024) raises customer hurdle rates; EVs ~14% global sales (2023) boost sensor content.
| Metric | 2023–24 |
|---|---|
| ISM PMI | <50 (2024) |
| Metals YoY | +12% |
| Wafers YoY | +15% |
| USD FX swing | ±10% |
| US policy rate | 5.25–5.50% |
| EV share | ~14% |
Preview the Actual Deliverable
CTS PESTLE Analysis
The preview shown here is the exact CTS PESTLE Analysis document you’ll receive after purchase—fully formatted, finalized, and ready to use. The layout, content, and structure match the downloadable file with no placeholders or alterations. After checkout you’ll get this identical, professionally structured report instantly.
Original: $10.00
-65%$10.00
$3.50Description
Skip the Research. Get the Strategy.
Unlock strategic clarity with our targeted PESTLE analysis of CTS — three to five minute read that pinpoints political, economic, social, technological, legal and environmental forces shaping its future. Ideal for investors and strategists, it translates trends into actionable risks and opportunities. Purchase the full report to access the complete breakdown and ready-to-use insights.
Political factors
Defense spending cycles
CTS’s aerospace and defense exposure ties revenue to national defense budgets and procurement cycles; US defense discretionary spending is about $858 billion for FY2025 and NATO allies combined spend over $1.2 trillion (2024), influencing program volume.
Increases in allocations can lift demand for mission-critical sensors and actuators, while sequestration or shifting priorities can delay programs and orders.
Monitoring multi-year defense appropriations, multiyear procurement plans and allies’ spending trajectories is essential for revenue visibility and backlog management.
Trade policy and tariffs
Import/export duties on electronics, sub-assemblies and raw materials directly raise CTS unit costs and selling prices; US Section 301 tariffs on many Chinese electronics remain at up to 25%, squeezing margins. Tariff volatility has forced supplier re-sourcing and customer price renegotiations in 2023–24. Preferential agreements such as RCEP (covers ~30% of global GDP) can improve margin competitiveness. Diversified manufacturing footprints across Mexico, Vietnam and India mitigate tariff shocks.
Geopolitical tensions
Regional conflicts and sanctions can disrupt supply chains for semiconductors and specialty materials—global semiconductor sales were $573.6B in 2023, so chokepoints ripple revenue and lead times. Defense customers face export restrictions (US 2022–24 chip controls vs China) that can reshape program scopes. CTS must maintain contingency sourcing and 3–6 months inventory buffers. Political risk insurance and scenario planning reduce exposure.
Industrial policy incentives
Government subsidies like the US CHIPS and Science Act (authorizes $52.7 billion) and the EU’s estimated €43 billion public investment target lower capex and accelerate capacity; grants and tax credits support onshoring and workforce training; participation requires compliance with domestic content rules; timely applications and partnerships maximize benefit capture.
- CHIPS Act: $52.7B
- EU target: €43B
- Requires domestic content compliance
- Apply early; use strategic partners
Export controls
Export controls under ITAR (DDTC) and EAR (BIS) restrict sales of dual-use technologies and technical data transfers, forcing licenses that can extend sales cycles and block certain geographies.
Companies need robust classification and screening processes tied to the U.S. Consolidated Screening List to avoid costly missteps that can lead to fines, debarment, and reputational harm.
- ITAR/EAR enforcement: regulatory license hurdles
- Classification + screening: essential compliance
- Consequences: fines, debarment, reputational damage
Tied to US $858B & NATO >$1.2T; tariffs, CHIPS risk
CTS’s defense exposure ties revenue to FY2025 US defense discretionary spending ~$858B and NATO allies’ >$1.2T (2024), driving program volume and backlog.
Tariff volatility (US Section 301 up to 25%) and export controls (ITAR/EAR) raise costs, extend cycles and restrict markets.
Subsidies (CHIPS $52.7B) and onshoring incentives lower capex but require domestic content compliance and proactive applications.
| Metric | Value |
|---|---|
| US defense FY2025 | $858B |
| NATO spend 2024 | >$1.2T |
| CHIPS Act | $52.7B |
| Global semis 2023 | $573.6B |
| Section 301 tariffs | Up to 25% |
What is included in the product
Detailed Word Document
Explores how external macro-environmental factors uniquely affect the CTS across six dimensions—Political, Economic, Social, Technological, Environmental, and Legal—each backed by relevant data and trends to ensure reliability. Designed for executives, consultants, and entrepreneurs, the analysis is region- and industry-specific, forward-looking, and formatted for direct use in plans, decks, or reports.
Customizable Excel Spreadsheet
CTS PESTLE Analysis delivers a clean, visually segmented summary of external factors that’s easily editable, shareable, and drop‑in ready for meetings, presentations, or cross‑team alignment to streamline risk discussions and strategic planning.
Economic factors
Industrial demand cyclicality
Sensors and actuators for factory automation and transport closely track PMI and capex cycles; ISM manufacturing PMI dipped below 50 several months in 2024, coinciding with softer industrial capex. Downturns delay retrofits and new-platform investments, while existing order backlogs (commonly 3–9 months) cushion revenue but cannot eliminate volatility. Flexible cost structures and variable sourcing helped stabilize margins during 2024 stress.
Cost inflation and FX
Rising input costs — metals up ~12% YoY in 2024, ceramics feedstocks ~8% and wafer costs near +15% — pressure CTS gross margins. Currency swings (USD moves ±10% vs major peers in 2023–24) affect reported revenues and cross‑border cost bases. Active hedging (covering ~70% of FX exposure) and local pricing reduce volatility. Strategic inventory and multi‑year supplier contracts improve cost visibility and supply resilience.
Interest rates and capex
Higher rates (US policy rate 5.25–5.50% in 2024, 10‑yr Treasury ~4% in 2024) raise customer hurdle rates and slow industrial, medical and mobility project approvals; increased financing costs constrain CTS’s expansion and M&A; lower-rate windows boost platform wins and capacity adds; disciplined capital allocation preserves resilience.
EV and mobility mix shift
Electrification and faster ADAS adoption raise sensor content per vehicle, supporting higher content value even as unit volumes shift; EVs reached roughly 14% of global passenger-car sales in 2023 (IEA), with uptake driven by subsidies, consumer demand and charging availability.
Platform timing creates booking-to-bill swings for CTS as OEM program launches cluster; content gains can offset softness in ICE-heavy segments.
- EV share ~14% of sales (2023)
- Charging, subsidies drive pace
- Platform timing = booking-to-bill volatility
Customer concentration
- Top customers often represent >50% of segment revenue
- Qualification cycles typically 12–36 months
- Multi-year contracts commonly 3–5 years
Tied to US $858B & NATO >$1.2T; tariffs, CHIPS risk
Sensors/actuators track PMI and capex; ISM manufacturing PMI dipped <50 in 2024, softening industrial capex and lengthening booking volatility; backlogs 3–9 months. Input inflation: metals +12% YoY (2024), wafers +15%, FX swings ±10% (2023–24). US rate 5.25–5.50% (2024) raises customer hurdle rates; EVs ~14% global sales (2023) boost sensor content.
| Metric | 2023–24 |
|---|---|
| ISM PMI | <50 (2024) |
| Metals YoY | +12% |
| Wafers YoY | +15% |
| USD FX swing | ±10% |
| US policy rate | 5.25–5.50% |
| EV share | ~14% |
Preview the Actual Deliverable
CTS PESTLE Analysis
The preview shown here is the exact CTS PESTLE Analysis document you’ll receive after purchase—fully formatted, finalized, and ready to use. The layout, content, and structure match the downloadable file with no placeholders or alterations. After checkout you’ll get this identical, professionally structured report instantly.











