CVR Partner Porter's Five Forces Analysis

From Overview to Strategy Blueprint
CVR Partners faces concentrated supplier dynamics, cyclical demand and moderate entry barriers that shape margins and risk; this snapshot highlights key pressure points but only scratches the surface. Unlock the full Porter's Five Forces Analysis to get force-by-force ratings, visuals and actionable insights for confident strategy and investment decisions.
Suppliers Bargaining Power

Petcoke feedstock dependence
CVR Partners’ Coffeyville plant relies heavily on petroleum coke from adjacent refining operations, concentrating supplier leverage and creating a single-region supply dependency.
Suitable low-sulfur petcoke grades and rail/barge logistics are limited, raising switching costs and making alternative sourcing costly and time-consuming.
Availability and prices can tighten during neighboring refinery turnarounds or market dislocations, and while long-term contracts provide mitigation, they do not eliminate exposure to supply shocks.
Industrial gases and utilities
Ammonia synthesis depends on steady oxygen, nitrogen, power and steam often from a few regional providers; the top three industrial gases firms supply roughly 60% of global capacity, giving them operational leverage since any interruption can curtail output. Energy and gas can represent about 60–70% of ammonia production cost, while take‑or‑pay and indexed contracts stabilize prices but lock CVR Partners into commitments; maintaining backup capacity raises capital and operating complexity.

Specialty catalysts and chemicals
Ammonia/UAN production relies on specialty catalysts and process chemicals supplied by a handful of global vendors, and in 2024 this concentration gives suppliers measurable leverage. Replacement cycles are multi-year with performance warranties that strengthen vendor terms, while lead times commonly span 20–40 weeks, forcing higher inventory and tighter planning. Extensive vendor qualification further limits rapid switching and raises switching costs.

Rail, trucking, and storage
Outbound UAN and ammonia depend on railcars, tank trucks, and terminal capacity that tighten in peak seasons, allowing logistics providers to push higher freight rates and dictate terms. Car availability and spot-rate volatility give suppliers bargaining room, while hazmat rules and freight costs limit geographic reach and route flexibility. CVR's use of dedicated fleets and terminals partially offsets this dependence, reducing but not eliminating supplier power.
Regulatory and compliance services
Regulatory and compliance services (environmental monitoring, maintenance contractors, safety compliance) exert strong supplier power in CVR Partner operations due to scarce certified turnaround providers and compressed outage windows in 2024 that push spot rates higher; multi-year agreements (commonly 3–5 years) trade price for guaranteed availability.
- Scarcity: few qualified turnaround providers
- Timing: outage windows compress demand, raising spot rates
- Contracts: 3–5 year agreements for availability
High supplier power: energy 60–70%, catalysts 20–40wks
CVR Partners faces high supplier power from concentrated petcoke supply at Coffeyville and single-region dependency.
Energy/gas suppliers hold leverage (top3 ≈60% capacity) with energy ~60–70% of ammonia cost, and long catalyst lead times (20–40 weeks) raise switching costs.
Logistics and turnaround contractors tighten terms in peak 2024 windows despite some mitigation via dedicated fleets and multi‑year contracts.
| Supplier | Metric | 2024 |
|---|---|---|
| Energy/Gas | Share of cost / top3 capacity | 60–70% / ~60% |
| Catalysts | Lead time | 20–40 weeks |
| Logistics | Peak pressure | High (spot volatility) |
What is included in the product
 Detailed Word Document
Tailored Porter's Five Forces analysis for CVR Partner that uncovers key competitive drivers, buyer and supplier power, substitution threats, and entry barriers; identifies disruptive forces and strategic vulnerabilities. Fully editable format for integration into investor decks, strategy reports, or academic projects.

 Customizable Excel Spreadsheet
A single-sheet CVR Partner Porter’s Five Forces summary that instantly visualizes strategic pressure with a customizable spider chart—no macros, easy to edit, and ready to drop into decks or Excel dashboards for rapid, boardroom-ready decisions.
Customers Bargaining Power

Fragmented but price-sensitive demand
Farmers, co-ops and retailers number roughly 2 million US operations (USDA 2022 Census) and remain highly price-sensitive given tight commodity crop margins. Benchmark nitrogen prices and futures steer purchases, capping margin expansion for suppliers. Buyers readily shift purchases around narrow spring planting windows, and short-term cost pass-through to crops is constrained.
Low product differentiation
UAN and ammonia trade as standardized commodities, with average 2024 ammonia FOB prices near $550/mt and UAN around $350/mt, enabling direct supplier comparisons. Buyers therefore prioritize price, freight (often $50–100/mt) and delivery reliability. Brand loyalty is modest except where service adds value. This compresses premiums to low single-digit percentages in competitive markets.

Seasonality and timing leverage
Peak application windows concentrate buying power—2024 procurement cycles saw up to 70% of annual volumes concentrated in short seasonal windows, enabling coordinated retailer buying to extract discounts and favorable terms. Retailers aggregate volumes to negotiate lower prices; off-season discounts (often 5–15%) are deployed to keep plants running. Rapid inventory shifts can swing leverage within weeks.

Switching costs mainly logistical
Switching suppliers at CVR is driven mainly by freight, terminal access and credit setups rather than technical barriers; 2024 surveys show over 50% of buyers employ multi-sourcing to manage logistics risk. When price arbitrage opens, buyers pivot between domestic producers and importers quickly, and long-term ties aid predictability but seldom lock volumes.
- Logistical switching costs dominate
- Buyers pivot on arbitrage
- Multi-sourcing >50% (2024)
- Long-term ties rarely enforce volumes
Import price anchors
Seasonal buyers capture 70% of volume; multi-sourcing over 50% keeps supplier premiums low
Buyers wield strong price sensitivity and seasonal leverage, with up to 70% of volumes bought in tight spring windows, enabling coordinated retailer discounts. Commodity pricing transparency (Platts/IFA) and import parity cap inland margins, while freight and terminal access drive switching costs. Multi-sourcing is common, >50% in 2024, keeping supplier premiums low.
| Metric | 2024 Value |
|---|---|
| Ammonia FOB | $550/mt |
| UAN FOB | $350/mt |
| Seaborne urea FOB | $350–450/t |
| Seasonal buy share | ~70% |
| Multi-sourcing | >50% |
Preview the Actual Deliverable
CVR Partner Porter's Five Forces Analysis
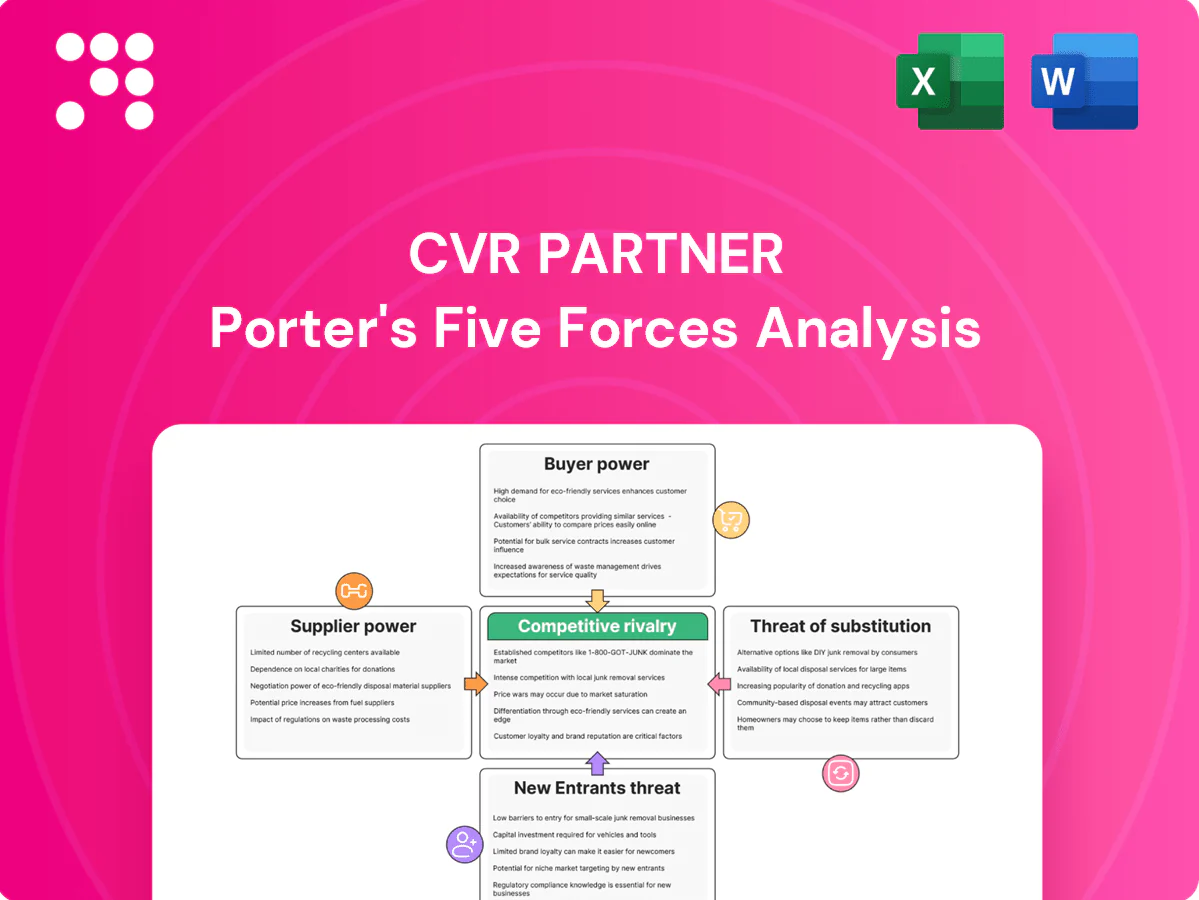
This preview shows the complete Porter's Five Forces analysis of CVR Partners—competitive rivalry, supplier and buyer power, and threats from entrants and substitutes—presented in a professional, ready-to-use format. The document you see is the exact file you'll receive instantly after purchase with no placeholders or changes.

From Overview to Strategy Blueprint
CVR Partners faces concentrated supplier dynamics, cyclical demand and moderate entry barriers that shape margins and risk; this snapshot highlights key pressure points but only scratches the surface. Unlock the full Porter's Five Forces Analysis to get force-by-force ratings, visuals and actionable insights for confident strategy and investment decisions.
Suppliers Bargaining Power
Petcoke feedstock dependence
CVR Partners’ Coffeyville plant relies heavily on petroleum coke from adjacent refining operations, concentrating supplier leverage and creating a single-region supply dependency.
Suitable low-sulfur petcoke grades and rail/barge logistics are limited, raising switching costs and making alternative sourcing costly and time-consuming.
Availability and prices can tighten during neighboring refinery turnarounds or market dislocations, and while long-term contracts provide mitigation, they do not eliminate exposure to supply shocks.
Industrial gases and utilities
Ammonia synthesis depends on steady oxygen, nitrogen, power and steam often from a few regional providers; the top three industrial gases firms supply roughly 60% of global capacity, giving them operational leverage since any interruption can curtail output. Energy and gas can represent about 60–70% of ammonia production cost, while take‑or‑pay and indexed contracts stabilize prices but lock CVR Partners into commitments; maintaining backup capacity raises capital and operating complexity.
Specialty catalysts and chemicals
Ammonia/UAN production relies on specialty catalysts and process chemicals supplied by a handful of global vendors, and in 2024 this concentration gives suppliers measurable leverage. Replacement cycles are multi-year with performance warranties that strengthen vendor terms, while lead times commonly span 20–40 weeks, forcing higher inventory and tighter planning. Extensive vendor qualification further limits rapid switching and raises switching costs.
Rail, trucking, and storage
Outbound UAN and ammonia depend on railcars, tank trucks, and terminal capacity that tighten in peak seasons, allowing logistics providers to push higher freight rates and dictate terms. Car availability and spot-rate volatility give suppliers bargaining room, while hazmat rules and freight costs limit geographic reach and route flexibility. CVR's use of dedicated fleets and terminals partially offsets this dependence, reducing but not eliminating supplier power.
Regulatory and compliance services
Regulatory and compliance services (environmental monitoring, maintenance contractors, safety compliance) exert strong supplier power in CVR Partner operations due to scarce certified turnaround providers and compressed outage windows in 2024 that push spot rates higher; multi-year agreements (commonly 3–5 years) trade price for guaranteed availability.
- Scarcity: few qualified turnaround providers
- Timing: outage windows compress demand, raising spot rates
- Contracts: 3–5 year agreements for availability
High supplier power: energy 60–70%, catalysts 20–40wks
CVR Partners faces high supplier power from concentrated petcoke supply at Coffeyville and single-region dependency.
Energy/gas suppliers hold leverage (top3 ≈60% capacity) with energy ~60–70% of ammonia cost, and long catalyst lead times (20–40 weeks) raise switching costs.
Logistics and turnaround contractors tighten terms in peak 2024 windows despite some mitigation via dedicated fleets and multi‑year contracts.
| Supplier | Metric | 2024 |
|---|---|---|
| Energy/Gas | Share of cost / top3 capacity | 60–70% / ~60% |
| Catalysts | Lead time | 20–40 weeks |
| Logistics | Peak pressure | High (spot volatility) |
What is included in the product
Detailed Word Document
Tailored Porter's Five Forces analysis for CVR Partner that uncovers key competitive drivers, buyer and supplier power, substitution threats, and entry barriers; identifies disruptive forces and strategic vulnerabilities. Fully editable format for integration into investor decks, strategy reports, or academic projects.
Customizable Excel Spreadsheet
A single-sheet CVR Partner Porter’s Five Forces summary that instantly visualizes strategic pressure with a customizable spider chart—no macros, easy to edit, and ready to drop into decks or Excel dashboards for rapid, boardroom-ready decisions.
Customers Bargaining Power
Fragmented but price-sensitive demand
Farmers, co-ops and retailers number roughly 2 million US operations (USDA 2022 Census) and remain highly price-sensitive given tight commodity crop margins. Benchmark nitrogen prices and futures steer purchases, capping margin expansion for suppliers. Buyers readily shift purchases around narrow spring planting windows, and short-term cost pass-through to crops is constrained.
Low product differentiation
UAN and ammonia trade as standardized commodities, with average 2024 ammonia FOB prices near $550/mt and UAN around $350/mt, enabling direct supplier comparisons. Buyers therefore prioritize price, freight (often $50–100/mt) and delivery reliability. Brand loyalty is modest except where service adds value. This compresses premiums to low single-digit percentages in competitive markets.
Seasonality and timing leverage
Peak application windows concentrate buying power—2024 procurement cycles saw up to 70% of annual volumes concentrated in short seasonal windows, enabling coordinated retailer buying to extract discounts and favorable terms. Retailers aggregate volumes to negotiate lower prices; off-season discounts (often 5–15%) are deployed to keep plants running. Rapid inventory shifts can swing leverage within weeks.
Switching costs mainly logistical
Switching suppliers at CVR is driven mainly by freight, terminal access and credit setups rather than technical barriers; 2024 surveys show over 50% of buyers employ multi-sourcing to manage logistics risk. When price arbitrage opens, buyers pivot between domestic producers and importers quickly, and long-term ties aid predictability but seldom lock volumes.
- Logistical switching costs dominate
- Buyers pivot on arbitrage
- Multi-sourcing >50% (2024)
- Long-term ties rarely enforce volumes
Import price anchors
Seasonal buyers capture 70% of volume; multi-sourcing over 50% keeps supplier premiums low
Buyers wield strong price sensitivity and seasonal leverage, with up to 70% of volumes bought in tight spring windows, enabling coordinated retailer discounts. Commodity pricing transparency (Platts/IFA) and import parity cap inland margins, while freight and terminal access drive switching costs. Multi-sourcing is common, >50% in 2024, keeping supplier premiums low.
| Metric | 2024 Value |
|---|---|
| Ammonia FOB | $550/mt |
| UAN FOB | $350/mt |
| Seaborne urea FOB | $350–450/t |
| Seasonal buy share | ~70% |
| Multi-sourcing | >50% |
Preview the Actual Deliverable
CVR Partner Porter's Five Forces Analysis
This preview shows the complete Porter's Five Forces analysis of CVR Partners—competitive rivalry, supplier and buyer power, and threats from entrants and substitutes—presented in a professional, ready-to-use format. The document you see is the exact file you'll receive instantly after purchase with no placeholders or changes.
Original: $10.00
-65%$10.00
$3.50Description
From Overview to Strategy Blueprint
CVR Partners faces concentrated supplier dynamics, cyclical demand and moderate entry barriers that shape margins and risk; this snapshot highlights key pressure points but only scratches the surface. Unlock the full Porter's Five Forces Analysis to get force-by-force ratings, visuals and actionable insights for confident strategy and investment decisions.
Suppliers Bargaining Power
Petcoke feedstock dependence
CVR Partners’ Coffeyville plant relies heavily on petroleum coke from adjacent refining operations, concentrating supplier leverage and creating a single-region supply dependency.
Suitable low-sulfur petcoke grades and rail/barge logistics are limited, raising switching costs and making alternative sourcing costly and time-consuming.
Availability and prices can tighten during neighboring refinery turnarounds or market dislocations, and while long-term contracts provide mitigation, they do not eliminate exposure to supply shocks.
Industrial gases and utilities
Ammonia synthesis depends on steady oxygen, nitrogen, power and steam often from a few regional providers; the top three industrial gases firms supply roughly 60% of global capacity, giving them operational leverage since any interruption can curtail output. Energy and gas can represent about 60–70% of ammonia production cost, while take‑or‑pay and indexed contracts stabilize prices but lock CVR Partners into commitments; maintaining backup capacity raises capital and operating complexity.
Specialty catalysts and chemicals
Ammonia/UAN production relies on specialty catalysts and process chemicals supplied by a handful of global vendors, and in 2024 this concentration gives suppliers measurable leverage. Replacement cycles are multi-year with performance warranties that strengthen vendor terms, while lead times commonly span 20–40 weeks, forcing higher inventory and tighter planning. Extensive vendor qualification further limits rapid switching and raises switching costs.
Rail, trucking, and storage
Outbound UAN and ammonia depend on railcars, tank trucks, and terminal capacity that tighten in peak seasons, allowing logistics providers to push higher freight rates and dictate terms. Car availability and spot-rate volatility give suppliers bargaining room, while hazmat rules and freight costs limit geographic reach and route flexibility. CVR's use of dedicated fleets and terminals partially offsets this dependence, reducing but not eliminating supplier power.
Regulatory and compliance services
Regulatory and compliance services (environmental monitoring, maintenance contractors, safety compliance) exert strong supplier power in CVR Partner operations due to scarce certified turnaround providers and compressed outage windows in 2024 that push spot rates higher; multi-year agreements (commonly 3–5 years) trade price for guaranteed availability.
- Scarcity: few qualified turnaround providers
- Timing: outage windows compress demand, raising spot rates
- Contracts: 3–5 year agreements for availability
High supplier power: energy 60–70%, catalysts 20–40wks
CVR Partners faces high supplier power from concentrated petcoke supply at Coffeyville and single-region dependency.
Energy/gas suppliers hold leverage (top3 ≈60% capacity) with energy ~60–70% of ammonia cost, and long catalyst lead times (20–40 weeks) raise switching costs.
Logistics and turnaround contractors tighten terms in peak 2024 windows despite some mitigation via dedicated fleets and multi‑year contracts.
| Supplier | Metric | 2024 |
|---|---|---|
| Energy/Gas | Share of cost / top3 capacity | 60–70% / ~60% |
| Catalysts | Lead time | 20–40 weeks |
| Logistics | Peak pressure | High (spot volatility) |
What is included in the product
Detailed Word Document
Tailored Porter's Five Forces analysis for CVR Partner that uncovers key competitive drivers, buyer and supplier power, substitution threats, and entry barriers; identifies disruptive forces and strategic vulnerabilities. Fully editable format for integration into investor decks, strategy reports, or academic projects.
Customizable Excel Spreadsheet
A single-sheet CVR Partner Porter’s Five Forces summary that instantly visualizes strategic pressure with a customizable spider chart—no macros, easy to edit, and ready to drop into decks or Excel dashboards for rapid, boardroom-ready decisions.
Customers Bargaining Power
Fragmented but price-sensitive demand
Farmers, co-ops and retailers number roughly 2 million US operations (USDA 2022 Census) and remain highly price-sensitive given tight commodity crop margins. Benchmark nitrogen prices and futures steer purchases, capping margin expansion for suppliers. Buyers readily shift purchases around narrow spring planting windows, and short-term cost pass-through to crops is constrained.
Low product differentiation
UAN and ammonia trade as standardized commodities, with average 2024 ammonia FOB prices near $550/mt and UAN around $350/mt, enabling direct supplier comparisons. Buyers therefore prioritize price, freight (often $50–100/mt) and delivery reliability. Brand loyalty is modest except where service adds value. This compresses premiums to low single-digit percentages in competitive markets.
Seasonality and timing leverage
Peak application windows concentrate buying power—2024 procurement cycles saw up to 70% of annual volumes concentrated in short seasonal windows, enabling coordinated retailer buying to extract discounts and favorable terms. Retailers aggregate volumes to negotiate lower prices; off-season discounts (often 5–15%) are deployed to keep plants running. Rapid inventory shifts can swing leverage within weeks.
Switching costs mainly logistical
Switching suppliers at CVR is driven mainly by freight, terminal access and credit setups rather than technical barriers; 2024 surveys show over 50% of buyers employ multi-sourcing to manage logistics risk. When price arbitrage opens, buyers pivot between domestic producers and importers quickly, and long-term ties aid predictability but seldom lock volumes.
- Logistical switching costs dominate
- Buyers pivot on arbitrage
- Multi-sourcing >50% (2024)
- Long-term ties rarely enforce volumes
Import price anchors
Seasonal buyers capture 70% of volume; multi-sourcing over 50% keeps supplier premiums low
Buyers wield strong price sensitivity and seasonal leverage, with up to 70% of volumes bought in tight spring windows, enabling coordinated retailer discounts. Commodity pricing transparency (Platts/IFA) and import parity cap inland margins, while freight and terminal access drive switching costs. Multi-sourcing is common, >50% in 2024, keeping supplier premiums low.
| Metric | 2024 Value |
|---|---|
| Ammonia FOB | $550/mt |
| UAN FOB | $350/mt |
| Seaborne urea FOB | $350–450/t |
| Seasonal buy share | ~70% |
| Multi-sourcing | >50% |
Preview the Actual Deliverable
CVR Partner Porter's Five Forces Analysis
This preview shows the complete Porter's Five Forces analysis of CVR Partners—competitive rivalry, supplier and buyer power, and threats from entrants and substitutes—presented in a professional, ready-to-use format. The document you see is the exact file you'll receive instantly after purchase with no placeholders or changes.











