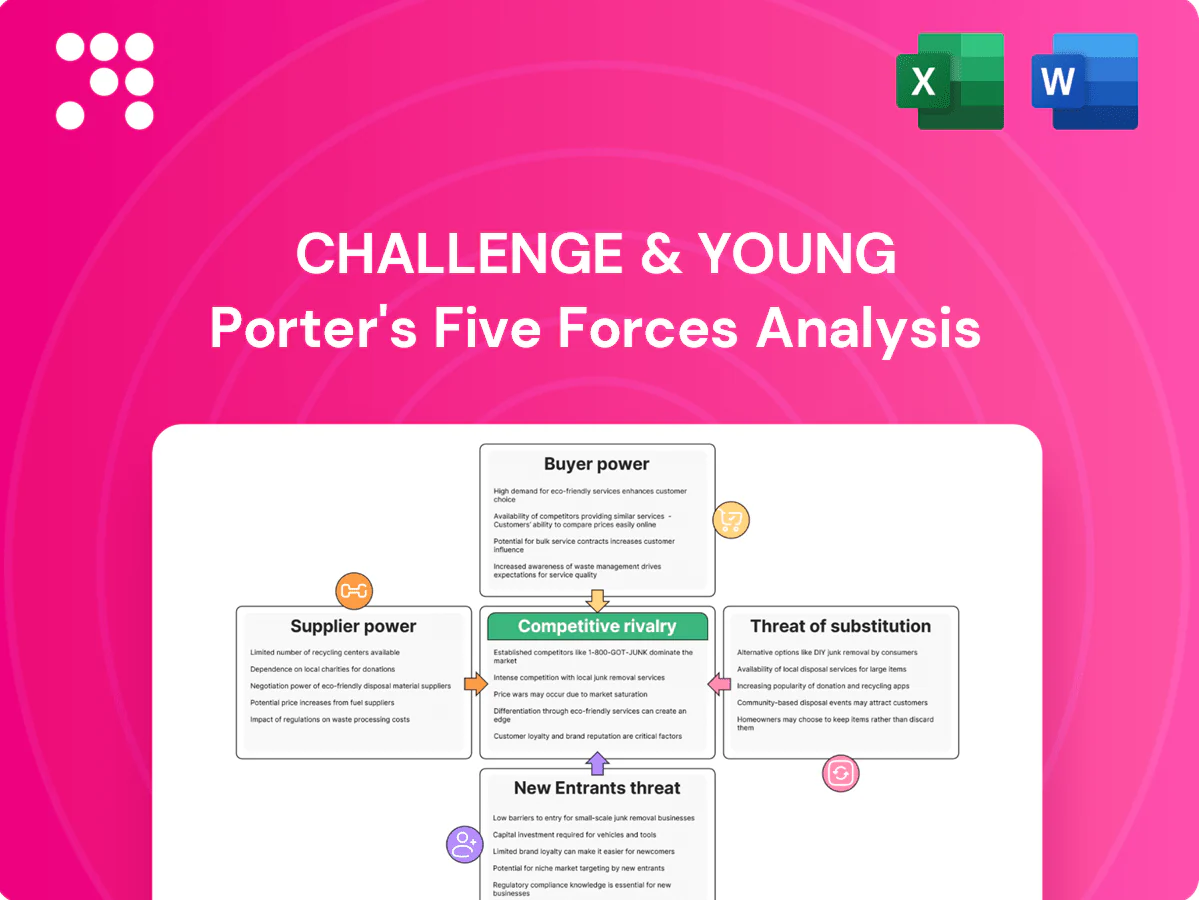
Challenge & Young Porter's Five Forces Analysis

From Overview to Strategy Blueprint
Challenge & Young’s Porter's Five Forces snapshot highlights competitive intensity, supplier and buyer leverage, threats from substitutes, and barriers to entry in concise terms. This brief uncovers key pressures shaping margins and strategic choices. For a force-by-force rating, visuals, and tailored implications, unlock the full Porter's Five Forces Analysis. Gain the actionable insight needed to inform investment and strategy decisions.
Suppliers Bargaining Power

Concentrated API/excipient sources
Many critical APIs and excipients remain concentrated among a small set of DMF-approved suppliers, primarily in China and India, creating single-source dependencies in 2024.
That concentration lets suppliers push price increases and priority allocations when capacity is tight.
Switching suppliers triggers MFDS requalification and validation processes that typically span several months, slowing response.
Longer lead times force higher buffer stocks and raise working capital requirements for manufacturers.
Regulatory switching frictions
Supplier changes require stability data, process validation and regulatory filings that often take 6–24 months and can cost $1–5 million, creating high compliance switching frictions. This regulatory burden locks in incumbent suppliers and increases their leverage over prices and terms. Hospitals’ safety expectations further discourage rapid switches, lengthening contract horizons. The net effect raises cost pass-through pressure on Challenge & Young.

Specialized packaging and serialization
Child-resistant, tamper-evident and serialized packaging vendors are highly specialized and concentrated after DSCSA electronic tracing requirements went fully into effect in November 2023, driving elevated 2024 demand for unit-level serialization. Limited qualified converters and converters' changeover costs tighten capacity and pricing, while short hospital-tailored runs increase dependence on niche suppliers. Negotiating power shifts toward these niche packaging vendors during peak demand.

Digital integration vendors
Integration with EHR/HIS and medication management systems often depends on specialized interface providers; 2024 surveys estimate 60–80% of hospitals rely on third‑party integrators, creating vendor leverage. Interoperability demands (HL7/FHIR mapping) plus cybersecurity certifications produce lock‑in; bespoke integrations frequently cost $50k–$250k and are costly to replicate, letting partners influence timelines and fees.
- Dependency: third‑party integrators 60–80% (2024)
- Cost: custom integrations $50k–$250k (2024)
- Technical drivers: HL7/FHIR, cybersecurity certification
- Power levers: timelines, pricing, scope
Logistics and cold-chain constraints
Temperature-controlled distribution capacity is finite and compliance-heavy, with utilization often spiking above 90% in peak seasons in 2024, raising switching costs as audits and documentation increase. Seasonal surges and regulatory inspections magnify carrier leverage; service failures can trigger hospital contract losses and penalties. Fuel and lane volatility in 2024 allowed carriers to pass through surcharges to manufacturers.
- High utilization: >90% peak 2024
- Compliance-driven switching costs: audits, docs
- Service failures risk hospital contracts
- Fuel/lane volatility → surcharge pass-through
Supplier concentration: $1-5M switch, single-source risk
High supplier concentration (APIs/excipients: few DMF holders in China/India) creates single‑source risk; switching costs 6–24 months and $1–5M (2024), raising price pass‑through. Serialization and packaging demand surged after DSCSA Nov 2023, tightening niche vendor leverage. Integration/cold‑chain constraints (integrators 60–80%; cold storage >90% peak utilization 2024) further increase supplier bargaining power.
| Supplier type | 2024 metric | Impact |
|---|---|---|
| APIs/excipients | Switch cost $1–5M; 6–24m | High price/priority leverage |
| Packaging | Post‑DSCSA serialization surge | Niche pricing power |
| Integrators | 60–80% hospital reliance | Timeline/fee lock‑in |
| Cold chain | >90% peak utilization | Capacity-driven surcharges |
What is included in the product
 Detailed Word Document
Concise Porter’s Five Forces analysis tailored for Challenge & Young, uncovering competition drivers, buyer and supplier power, substitutes, and entry risks. Includes strategic commentary on disruptive threats, market dynamics protecting incumbents, and actionable insights for investor decks or internal strategy documents.

 Customizable Excel Spreadsheet
A concise one-sheet mapping Challenge & Young's Five Forces to highlight competitive pain points and strategic responses, with customizable pressure sliders and an instant radar chart for board-ready insight and quick decision-making.
Customers Bargaining Power

Hospital/GPO consolidation
Hospital and GPO consolidation intensified in 2024, with the largest GPOs (Vizient, Premier, HealthTrust) covering a majority of US hospitals and centralizing procurement. These buyers negotiate aggressive discounts, commonly in the 10–30% range, and impose service-level penalties that shift margin risk to suppliers. Volume concentration markedly increases buyer bargaining power, and contract renewal cycles in 2024 frequently triggered competitive price reprisals among suppliers.
Reimbursement-driven price sensitivity
Korea’s National Health Insurance covers about 97% of the population, and NHI-imposed price ceilings plus reference pricing tightly constrain hospital reimbursement and procurement budgets. Buyers—hospitals and group purchasers—push for lower acquisition costs to preserve thin margins in a system spending roughly 8.1% of GDP on health. Without clearly differentiated clinical outcomes, suppliers cannot command premiums, and tightened formularies further limit market access for higher-priced products.

Demand for error-reduction outcomes
Hospitals prioritize measurable reductions in medication errors and workflow gains, with 2024 peer-reviewed hospital studies reporting up to 45% fewer errors and an average 18% reduction in nursing med-pass time. Buyers now demand evidence, multi-month pilots, and outcome guarantees, shifting bargaining power toward purchasers who insist on value-based contracts. Vendors increasingly must fund training, integration and pilot costs to win deals.

Switching ease on commoditized drugs
Therapeutic equivalents and generics enable rapid substitution: generics represent about 90% of US prescriptions in 2024 and typically trade 80–95% below branded prices, so proven clinical equivalence shifts buyer choice to price and availability. Low differentiation erodes pricing power for manufacturers; supply assurance can win contracts but rarely commands a premium.
- Price-driven switching
- Generics ~90% prescriptions (2024)
- Supply assurance = tie-breaker
Data transparency and KPIs
Procurement teams now demand real-time supply, quality, and service KPIs to drive sourcing decisions; Deloitte 2024 CPO Survey reports 58% of organizations prioritize live supplier metrics. Benchmarking across vendors sharpens negotiations and non‑performance risks delisting, while buyers use performance data to extract rebates or credits, often reclaiming 1–3% of spend.
- Real-time KPIs: 58% (Deloitte 2024)
- Rebate leverage: 1–3% of spend
- Delisting risk: KPI non‑compliance
Buyers Gain Leverage: GPO Discounts, Generics and NHI Drive Price Pressure
Buyer consolidation, NHI price controls (97% coverage) and therapeutic substitution drove strong customer bargaining power in 2024: GPO-led discounts of 10–30% and generics at ~90% of prescriptions shifted negotiations to price and supply assurance. Buyers demand outcome evidence (pilots, outcome guarantees) and real-time KPIs, extracting 1–3% rebates and threatening delisting for non‑performance.
| Metric | 2024 Value |
|---|---|
| GPO coverage | Majority of US hospitals |
| Typical discounts | 10–30% |
| Generics share | ~90% prescriptions |
| Deloitte CPO KPI use | 58% |
| Rebate leverage | 1–3% of spend |
Full Version Awaits
Challenge & Young Porter's Five Forces Analysis
This preview shows the exact Challenge & Young Porter's Five Forces analysis you'll receive immediately after purchase—no placeholders or mockups. The document is fully formatted, ready to download and use, and contains the complete strategic assessment and actionable insights. Instant access upon payment.

From Overview to Strategy Blueprint
Challenge & Young’s Porter's Five Forces snapshot highlights competitive intensity, supplier and buyer leverage, threats from substitutes, and barriers to entry in concise terms. This brief uncovers key pressures shaping margins and strategic choices. For a force-by-force rating, visuals, and tailored implications, unlock the full Porter's Five Forces Analysis. Gain the actionable insight needed to inform investment and strategy decisions.
Suppliers Bargaining Power
Concentrated API/excipient sources
Many critical APIs and excipients remain concentrated among a small set of DMF-approved suppliers, primarily in China and India, creating single-source dependencies in 2024.
That concentration lets suppliers push price increases and priority allocations when capacity is tight.
Switching suppliers triggers MFDS requalification and validation processes that typically span several months, slowing response.
Longer lead times force higher buffer stocks and raise working capital requirements for manufacturers.
Regulatory switching frictions
Supplier changes require stability data, process validation and regulatory filings that often take 6–24 months and can cost $1–5 million, creating high compliance switching frictions. This regulatory burden locks in incumbent suppliers and increases their leverage over prices and terms. Hospitals’ safety expectations further discourage rapid switches, lengthening contract horizons. The net effect raises cost pass-through pressure on Challenge & Young.
Specialized packaging and serialization
Child-resistant, tamper-evident and serialized packaging vendors are highly specialized and concentrated after DSCSA electronic tracing requirements went fully into effect in November 2023, driving elevated 2024 demand for unit-level serialization. Limited qualified converters and converters' changeover costs tighten capacity and pricing, while short hospital-tailored runs increase dependence on niche suppliers. Negotiating power shifts toward these niche packaging vendors during peak demand.
Digital integration vendors
Integration with EHR/HIS and medication management systems often depends on specialized interface providers; 2024 surveys estimate 60–80% of hospitals rely on third‑party integrators, creating vendor leverage. Interoperability demands (HL7/FHIR mapping) plus cybersecurity certifications produce lock‑in; bespoke integrations frequently cost $50k–$250k and are costly to replicate, letting partners influence timelines and fees.
- Dependency: third‑party integrators 60–80% (2024)
- Cost: custom integrations $50k–$250k (2024)
- Technical drivers: HL7/FHIR, cybersecurity certification
- Power levers: timelines, pricing, scope
Logistics and cold-chain constraints
Temperature-controlled distribution capacity is finite and compliance-heavy, with utilization often spiking above 90% in peak seasons in 2024, raising switching costs as audits and documentation increase. Seasonal surges and regulatory inspections magnify carrier leverage; service failures can trigger hospital contract losses and penalties. Fuel and lane volatility in 2024 allowed carriers to pass through surcharges to manufacturers.
- High utilization: >90% peak 2024
- Compliance-driven switching costs: audits, docs
- Service failures risk hospital contracts
- Fuel/lane volatility → surcharge pass-through
Supplier concentration: $1-5M switch, single-source risk
High supplier concentration (APIs/excipients: few DMF holders in China/India) creates single‑source risk; switching costs 6–24 months and $1–5M (2024), raising price pass‑through. Serialization and packaging demand surged after DSCSA Nov 2023, tightening niche vendor leverage. Integration/cold‑chain constraints (integrators 60–80%; cold storage >90% peak utilization 2024) further increase supplier bargaining power.
| Supplier type | 2024 metric | Impact |
|---|---|---|
| APIs/excipients | Switch cost $1–5M; 6–24m | High price/priority leverage |
| Packaging | Post‑DSCSA serialization surge | Niche pricing power |
| Integrators | 60–80% hospital reliance | Timeline/fee lock‑in |
| Cold chain | >90% peak utilization | Capacity-driven surcharges |
What is included in the product
Detailed Word Document
Concise Porter’s Five Forces analysis tailored for Challenge & Young, uncovering competition drivers, buyer and supplier power, substitutes, and entry risks. Includes strategic commentary on disruptive threats, market dynamics protecting incumbents, and actionable insights for investor decks or internal strategy documents.
Customizable Excel Spreadsheet
A concise one-sheet mapping Challenge & Young's Five Forces to highlight competitive pain points and strategic responses, with customizable pressure sliders and an instant radar chart for board-ready insight and quick decision-making.
Customers Bargaining Power
Hospital/GPO consolidation
Hospital and GPO consolidation intensified in 2024, with the largest GPOs (Vizient, Premier, HealthTrust) covering a majority of US hospitals and centralizing procurement. These buyers negotiate aggressive discounts, commonly in the 10–30% range, and impose service-level penalties that shift margin risk to suppliers. Volume concentration markedly increases buyer bargaining power, and contract renewal cycles in 2024 frequently triggered competitive price reprisals among suppliers.
Reimbursement-driven price sensitivity
Korea’s National Health Insurance covers about 97% of the population, and NHI-imposed price ceilings plus reference pricing tightly constrain hospital reimbursement and procurement budgets. Buyers—hospitals and group purchasers—push for lower acquisition costs to preserve thin margins in a system spending roughly 8.1% of GDP on health. Without clearly differentiated clinical outcomes, suppliers cannot command premiums, and tightened formularies further limit market access for higher-priced products.
Demand for error-reduction outcomes
Hospitals prioritize measurable reductions in medication errors and workflow gains, with 2024 peer-reviewed hospital studies reporting up to 45% fewer errors and an average 18% reduction in nursing med-pass time. Buyers now demand evidence, multi-month pilots, and outcome guarantees, shifting bargaining power toward purchasers who insist on value-based contracts. Vendors increasingly must fund training, integration and pilot costs to win deals.
Switching ease on commoditized drugs
Therapeutic equivalents and generics enable rapid substitution: generics represent about 90% of US prescriptions in 2024 and typically trade 80–95% below branded prices, so proven clinical equivalence shifts buyer choice to price and availability. Low differentiation erodes pricing power for manufacturers; supply assurance can win contracts but rarely commands a premium.
- Price-driven switching
- Generics ~90% prescriptions (2024)
- Supply assurance = tie-breaker
Data transparency and KPIs
Procurement teams now demand real-time supply, quality, and service KPIs to drive sourcing decisions; Deloitte 2024 CPO Survey reports 58% of organizations prioritize live supplier metrics. Benchmarking across vendors sharpens negotiations and non‑performance risks delisting, while buyers use performance data to extract rebates or credits, often reclaiming 1–3% of spend.
- Real-time KPIs: 58% (Deloitte 2024)
- Rebate leverage: 1–3% of spend
- Delisting risk: KPI non‑compliance
Buyers Gain Leverage: GPO Discounts, Generics and NHI Drive Price Pressure
Buyer consolidation, NHI price controls (97% coverage) and therapeutic substitution drove strong customer bargaining power in 2024: GPO-led discounts of 10–30% and generics at ~90% of prescriptions shifted negotiations to price and supply assurance. Buyers demand outcome evidence (pilots, outcome guarantees) and real-time KPIs, extracting 1–3% rebates and threatening delisting for non‑performance.
| Metric | 2024 Value |
|---|---|
| GPO coverage | Majority of US hospitals |
| Typical discounts | 10–30% |
| Generics share | ~90% prescriptions |
| Deloitte CPO KPI use | 58% |
| Rebate leverage | 1–3% of spend |
Full Version Awaits
Challenge & Young Porter's Five Forces Analysis
This preview shows the exact Challenge & Young Porter's Five Forces analysis you'll receive immediately after purchase—no placeholders or mockups. The document is fully formatted, ready to download and use, and contains the complete strategic assessment and actionable insights. Instant access upon payment.
Original: $10.00
-65%$10.00
$3.50Description
From Overview to Strategy Blueprint
Challenge & Young’s Porter's Five Forces snapshot highlights competitive intensity, supplier and buyer leverage, threats from substitutes, and barriers to entry in concise terms. This brief uncovers key pressures shaping margins and strategic choices. For a force-by-force rating, visuals, and tailored implications, unlock the full Porter's Five Forces Analysis. Gain the actionable insight needed to inform investment and strategy decisions.
Suppliers Bargaining Power
Concentrated API/excipient sources
Many critical APIs and excipients remain concentrated among a small set of DMF-approved suppliers, primarily in China and India, creating single-source dependencies in 2024.
That concentration lets suppliers push price increases and priority allocations when capacity is tight.
Switching suppliers triggers MFDS requalification and validation processes that typically span several months, slowing response.
Longer lead times force higher buffer stocks and raise working capital requirements for manufacturers.
Regulatory switching frictions
Supplier changes require stability data, process validation and regulatory filings that often take 6–24 months and can cost $1–5 million, creating high compliance switching frictions. This regulatory burden locks in incumbent suppliers and increases their leverage over prices and terms. Hospitals’ safety expectations further discourage rapid switches, lengthening contract horizons. The net effect raises cost pass-through pressure on Challenge & Young.
Specialized packaging and serialization
Child-resistant, tamper-evident and serialized packaging vendors are highly specialized and concentrated after DSCSA electronic tracing requirements went fully into effect in November 2023, driving elevated 2024 demand for unit-level serialization. Limited qualified converters and converters' changeover costs tighten capacity and pricing, while short hospital-tailored runs increase dependence on niche suppliers. Negotiating power shifts toward these niche packaging vendors during peak demand.
Digital integration vendors
Integration with EHR/HIS and medication management systems often depends on specialized interface providers; 2024 surveys estimate 60–80% of hospitals rely on third‑party integrators, creating vendor leverage. Interoperability demands (HL7/FHIR mapping) plus cybersecurity certifications produce lock‑in; bespoke integrations frequently cost $50k–$250k and are costly to replicate, letting partners influence timelines and fees.
- Dependency: third‑party integrators 60–80% (2024)
- Cost: custom integrations $50k–$250k (2024)
- Technical drivers: HL7/FHIR, cybersecurity certification
- Power levers: timelines, pricing, scope
Logistics and cold-chain constraints
Temperature-controlled distribution capacity is finite and compliance-heavy, with utilization often spiking above 90% in peak seasons in 2024, raising switching costs as audits and documentation increase. Seasonal surges and regulatory inspections magnify carrier leverage; service failures can trigger hospital contract losses and penalties. Fuel and lane volatility in 2024 allowed carriers to pass through surcharges to manufacturers.
- High utilization: >90% peak 2024
- Compliance-driven switching costs: audits, docs
- Service failures risk hospital contracts
- Fuel/lane volatility → surcharge pass-through
Supplier concentration: $1-5M switch, single-source risk
High supplier concentration (APIs/excipients: few DMF holders in China/India) creates single‑source risk; switching costs 6–24 months and $1–5M (2024), raising price pass‑through. Serialization and packaging demand surged after DSCSA Nov 2023, tightening niche vendor leverage. Integration/cold‑chain constraints (integrators 60–80%; cold storage >90% peak utilization 2024) further increase supplier bargaining power.
| Supplier type | 2024 metric | Impact |
|---|---|---|
| APIs/excipients | Switch cost $1–5M; 6–24m | High price/priority leverage |
| Packaging | Post‑DSCSA serialization surge | Niche pricing power |
| Integrators | 60–80% hospital reliance | Timeline/fee lock‑in |
| Cold chain | >90% peak utilization | Capacity-driven surcharges |
What is included in the product
Detailed Word Document
Concise Porter’s Five Forces analysis tailored for Challenge & Young, uncovering competition drivers, buyer and supplier power, substitutes, and entry risks. Includes strategic commentary on disruptive threats, market dynamics protecting incumbents, and actionable insights for investor decks or internal strategy documents.
Customizable Excel Spreadsheet
A concise one-sheet mapping Challenge & Young's Five Forces to highlight competitive pain points and strategic responses, with customizable pressure sliders and an instant radar chart for board-ready insight and quick decision-making.
Customers Bargaining Power
Hospital/GPO consolidation
Hospital and GPO consolidation intensified in 2024, with the largest GPOs (Vizient, Premier, HealthTrust) covering a majority of US hospitals and centralizing procurement. These buyers negotiate aggressive discounts, commonly in the 10–30% range, and impose service-level penalties that shift margin risk to suppliers. Volume concentration markedly increases buyer bargaining power, and contract renewal cycles in 2024 frequently triggered competitive price reprisals among suppliers.
Reimbursement-driven price sensitivity
Korea’s National Health Insurance covers about 97% of the population, and NHI-imposed price ceilings plus reference pricing tightly constrain hospital reimbursement and procurement budgets. Buyers—hospitals and group purchasers—push for lower acquisition costs to preserve thin margins in a system spending roughly 8.1% of GDP on health. Without clearly differentiated clinical outcomes, suppliers cannot command premiums, and tightened formularies further limit market access for higher-priced products.
Demand for error-reduction outcomes
Hospitals prioritize measurable reductions in medication errors and workflow gains, with 2024 peer-reviewed hospital studies reporting up to 45% fewer errors and an average 18% reduction in nursing med-pass time. Buyers now demand evidence, multi-month pilots, and outcome guarantees, shifting bargaining power toward purchasers who insist on value-based contracts. Vendors increasingly must fund training, integration and pilot costs to win deals.
Switching ease on commoditized drugs
Therapeutic equivalents and generics enable rapid substitution: generics represent about 90% of US prescriptions in 2024 and typically trade 80–95% below branded prices, so proven clinical equivalence shifts buyer choice to price and availability. Low differentiation erodes pricing power for manufacturers; supply assurance can win contracts but rarely commands a premium.
- Price-driven switching
- Generics ~90% prescriptions (2024)
- Supply assurance = tie-breaker
Data transparency and KPIs
Procurement teams now demand real-time supply, quality, and service KPIs to drive sourcing decisions; Deloitte 2024 CPO Survey reports 58% of organizations prioritize live supplier metrics. Benchmarking across vendors sharpens negotiations and non‑performance risks delisting, while buyers use performance data to extract rebates or credits, often reclaiming 1–3% of spend.
- Real-time KPIs: 58% (Deloitte 2024)
- Rebate leverage: 1–3% of spend
- Delisting risk: KPI non‑compliance
Buyers Gain Leverage: GPO Discounts, Generics and NHI Drive Price Pressure
Buyer consolidation, NHI price controls (97% coverage) and therapeutic substitution drove strong customer bargaining power in 2024: GPO-led discounts of 10–30% and generics at ~90% of prescriptions shifted negotiations to price and supply assurance. Buyers demand outcome evidence (pilots, outcome guarantees) and real-time KPIs, extracting 1–3% rebates and threatening delisting for non‑performance.
| Metric | 2024 Value |
|---|---|
| GPO coverage | Majority of US hospitals |
| Typical discounts | 10–30% |
| Generics share | ~90% prescriptions |
| Deloitte CPO KPI use | 58% |
| Rebate leverage | 1–3% of spend |
Full Version Awaits
Challenge & Young Porter's Five Forces Analysis
This preview shows the exact Challenge & Young Porter's Five Forces analysis you'll receive immediately after purchase—no placeholders or mockups. The document is fully formatted, ready to download and use, and contains the complete strategic assessment and actionable insights. Instant access upon payment.











