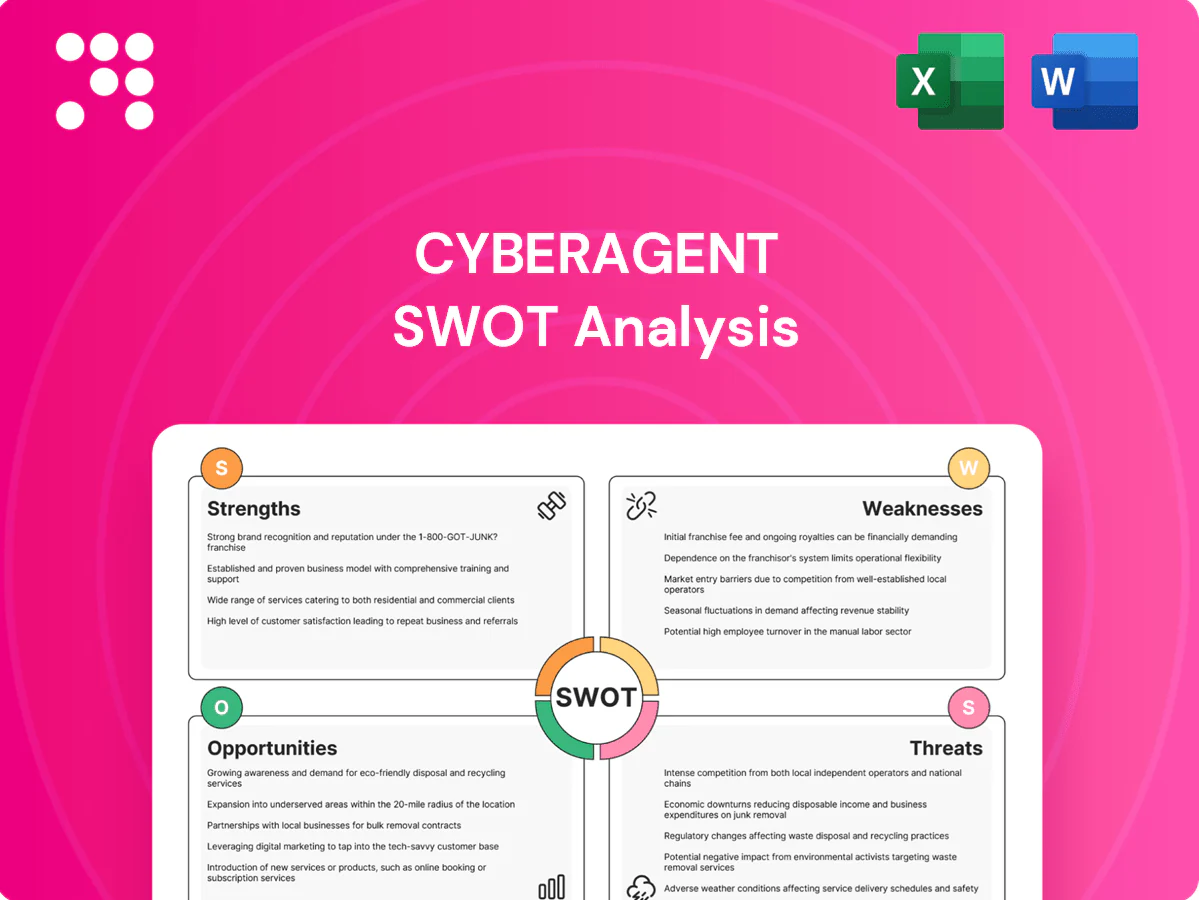
CyberAgent SWOT Analysis

Make Insightful Decisions Backed by Expert Research
CyberAgent’s digital-ad and gaming strengths drive rapid growth, but competitive pressure and regulatory risks could strain margins. Our full SWOT reveals strategic levers, financial context, and scenario-based recommendations. Purchase the complete, editable report to plan, pitch, or invest with confidence.
Strengths

Diversified revenue across ads, media, games
CyberAgent combines digital advertising, AbemaTV and mobile games, reducing single-segment dependence and helping mitigate ad-market cyclicality; consolidated net sales reached ¥677.1 billion in FY2024, reflecting diversified demand. The ad/media/games mix smooths volatility from hit-driven titles and ad cycles, supporting steadier cash flow and optionality for capital allocation. Cross-learning between units improves user acquisition and monetization strategies.
Strong ad-tech and performance marketing capabilities
CyberAgent runs scaled performance-based advertising powered by proprietary optimization and data science, with the Advertising Business contributing roughly 70% of group revenue in FY2024. Best-in-class measurement and ROAS reporting increase advertiser stickiness and LTV. Deep creative and bidding know-how improves unit economics and CPM efficiency. These capabilities help sustain share versus global platforms in Japan.

Compelling first-party media asset in AbemaTV
AbemaTV, launched in 2016, supplies CyberAgent with owned inventory, first-party data and brand reach, serving over 10 million monthly active users. Live and variety programming drive higher engagement and advertiser appeal, enabling premium CPMs and audience targeting. The platform supports upsell of integrated cross-format campaigns and reduces dependence on external media marketplaces.

Proven mobile game development and IP monetization
CyberAgent has proven mobile game development and IP monetization capabilities, sustaining durable ARPUs in its gacha and social titles; live-ops proficiency in 2024–25 extends lifecycles and monetization windows while cross-media IP collaborations (anime, streaming, merchandising) amplify LTV and brand reach, and a deep release pipeline cushions single-title risk.
- Live-ops-driven ARPU resilience
- Cross-media LTV uplift
- Pipeline depth reduces volatility
Synergies from ecosystem and cross-promotion
Synergies across CyberAgent's advertising, games and media units let owned channels rapidly acquire users for new titles and programs, reducing paid acquisition needs and lowering CAC while increasing lifetime value.
Shared analytics, creative studios and engineering teams boost campaign efficiency and enable data-driven cross-promotion; talent, tech and datasets are reused across businesses to scale successful creatives and features.
These integrated operations improve gross margins and operating leverage over time, with marketing spend efficiency compounding as audiences grow across Abema, game platforms and ad inventory.
- Channels accelerate user acquisition
- Shared analytics & creative lift efficiency
- Shared talent, tech & data
- Lower CAC, higher margins over time
Ad-led media group: ¥677.1bn sales, ~70% ad share, 10M MAU
CyberAgent's diversified mix—Advertising (~70% revenue FY2024), AbemaTV (10M MAU) and mobile games—reduced single-segment risk and drove consolidated net sales of ¥677.1bn in FY2024. Proprietary performance-ad tech boosts ROAS and advertiser retention. Live-ops and cross-media IP sustain ARPU and extend title lifecycles, lowering CAC via owned channels.
| Metric | FY2024 |
|---|---|
| Net sales | ¥677.1bn |
| Ad share | ~70% |
| AbemaTV MAU | 10M |
What is included in the product
 Detailed Word Document
Delivers a strategic overview of CyberAgent’s internal strengths and weaknesses and evaluates external opportunities and threats shaping its digital media and advertising businesses.

 Customizable Excel Spreadsheet
Provides a concise, CyberAgent-specific SWOT matrix for rapid strategy alignment and stakeholder briefings; editable format enables quick updates to reflect market shifts and simplifies cross-unit comparisons.
Weaknesses

Profit volatility from hit-driven games
Revenue concentration in a few top titles creates large swings in bookings, so underperformance or delays of new releases can materially dent quarterly results. Sustaining engagement for flagship games requires continual live-ops investment, increasing operating leverage and margin volatility. This hit-driven model makes forecasting harder for investors and elevates earnings unpredictability.
Heavy investment needs for AbemaTV
Abema requires heavy, ongoing investment—content production, sports rights and CDN scale demand capital often in the tens of billions of yen annually—while monetization can lag audience growth and compress margins. Break-even timelines have stretched across competitive cycles, delaying payback and increasing cash burn. This persistent investment burden weighs on CyberAgent’s consolidated profitability and free cash flow.

High reliance on third-party platforms
CyberAgent’s distribution and UA hinge on iOS/Android app stores and major ad networks, with iOS+Android accounting for over 99% of global app-store revenue. Store fees and policy changes (Apple/Google commissions typically 15–30%) can compress take rates and limit targeting. Google and Meta together hold roughly 55% of global digital ad spend, so algorithm shifts materially affect campaign performance and CPI, diluting control over the funnel.

Japan-centric revenue exposure
Heavy Japan-centric revenue concentration makes CyberAgent highly sensitive to domestic macro shifts and an aging demographic; overseas sales remain a small share, limiting natural currency and market diversification. Intense domestic competition in advertising and media compresses margins, and the company has struggled to scale global franchises beyond niche success.
- Domestic exposure
- Low FX diversification
- Strong local rivals
- Weak global scale
Regulatory sensitivity of gacha monetization
Loot box mechanics face rising regulatory scrutiny—Belgium (2018) and the Netherlands (2020) have classified some loot boxes as gambling, and UK/EU debates intensified through 2024—threatening payer conversion and ARPPU for gacha-driven titles. Any tightening of rules can reduce high-value spenders and force redesigns, adding compliance overhead and shrinking margins. Negative public perception can cascade to other CyberAgent segments, amplifying revenue risk.
- Regulatory rulings: Belgium 2018, Netherlands 2020
- Impact: lower payer conversion and ARPPU under tighter rules
- Cost: increased compliance and design constraints
- Reputation: spillover risk across business units
Hit-driven revenue swings and massive content spend amplify margin and distribution risk
Revenue swings from a few hit titles and high live-ops costs raise margin volatility and forecasting risk. Abema needs tens of billions of yen annually in content/sports/CDN spend, delaying break-even and pressuring cash flow. Distribution relies on iOS/Android (>99% app-store revenue) and ad platforms (Google+Meta ~55% global spend; Apple/Google fees 15–30%), reducing pricing and UA control.
| Metric | Value / Year |
|---|---|
| iOS+Android share | >99% |
| Google+Meta ad spend | ~55% |
| App-store fees | 15–30% |
| Abema investment | tens of billions yen / yr |
Full Version Awaits
CyberAgent SWOT Analysis
This is the actual CyberAgent SWOT analysis document you’ll receive upon purchase—no surprises, just professional quality. The preview below is taken directly from the full report and reflects the same structured, editable file available for download after payment. Buy now to unlock the complete, in-depth version ready for use.

Make Insightful Decisions Backed by Expert Research
CyberAgent’s digital-ad and gaming strengths drive rapid growth, but competitive pressure and regulatory risks could strain margins. Our full SWOT reveals strategic levers, financial context, and scenario-based recommendations. Purchase the complete, editable report to plan, pitch, or invest with confidence.
Strengths
Diversified revenue across ads, media, games
CyberAgent combines digital advertising, AbemaTV and mobile games, reducing single-segment dependence and helping mitigate ad-market cyclicality; consolidated net sales reached ¥677.1 billion in FY2024, reflecting diversified demand. The ad/media/games mix smooths volatility from hit-driven titles and ad cycles, supporting steadier cash flow and optionality for capital allocation. Cross-learning between units improves user acquisition and monetization strategies.
Strong ad-tech and performance marketing capabilities
CyberAgent runs scaled performance-based advertising powered by proprietary optimization and data science, with the Advertising Business contributing roughly 70% of group revenue in FY2024. Best-in-class measurement and ROAS reporting increase advertiser stickiness and LTV. Deep creative and bidding know-how improves unit economics and CPM efficiency. These capabilities help sustain share versus global platforms in Japan.
Compelling first-party media asset in AbemaTV
AbemaTV, launched in 2016, supplies CyberAgent with owned inventory, first-party data and brand reach, serving over 10 million monthly active users. Live and variety programming drive higher engagement and advertiser appeal, enabling premium CPMs and audience targeting. The platform supports upsell of integrated cross-format campaigns and reduces dependence on external media marketplaces.
Proven mobile game development and IP monetization
CyberAgent has proven mobile game development and IP monetization capabilities, sustaining durable ARPUs in its gacha and social titles; live-ops proficiency in 2024–25 extends lifecycles and monetization windows while cross-media IP collaborations (anime, streaming, merchandising) amplify LTV and brand reach, and a deep release pipeline cushions single-title risk.
- Live-ops-driven ARPU resilience
- Cross-media LTV uplift
- Pipeline depth reduces volatility
Synergies from ecosystem and cross-promotion
Synergies across CyberAgent's advertising, games and media units let owned channels rapidly acquire users for new titles and programs, reducing paid acquisition needs and lowering CAC while increasing lifetime value.
Shared analytics, creative studios and engineering teams boost campaign efficiency and enable data-driven cross-promotion; talent, tech and datasets are reused across businesses to scale successful creatives and features.
These integrated operations improve gross margins and operating leverage over time, with marketing spend efficiency compounding as audiences grow across Abema, game platforms and ad inventory.
- Channels accelerate user acquisition
- Shared analytics & creative lift efficiency
- Shared talent, tech & data
- Lower CAC, higher margins over time
Ad-led media group: ¥677.1bn sales, ~70% ad share, 10M MAU
CyberAgent's diversified mix—Advertising (~70% revenue FY2024), AbemaTV (10M MAU) and mobile games—reduced single-segment risk and drove consolidated net sales of ¥677.1bn in FY2024. Proprietary performance-ad tech boosts ROAS and advertiser retention. Live-ops and cross-media IP sustain ARPU and extend title lifecycles, lowering CAC via owned channels.
| Metric | FY2024 |
|---|---|
| Net sales | ¥677.1bn |
| Ad share | ~70% |
| AbemaTV MAU | 10M |
What is included in the product
Detailed Word Document
Delivers a strategic overview of CyberAgent’s internal strengths and weaknesses and evaluates external opportunities and threats shaping its digital media and advertising businesses.
Customizable Excel Spreadsheet
Provides a concise, CyberAgent-specific SWOT matrix for rapid strategy alignment and stakeholder briefings; editable format enables quick updates to reflect market shifts and simplifies cross-unit comparisons.
Weaknesses
Profit volatility from hit-driven games
Revenue concentration in a few top titles creates large swings in bookings, so underperformance or delays of new releases can materially dent quarterly results. Sustaining engagement for flagship games requires continual live-ops investment, increasing operating leverage and margin volatility. This hit-driven model makes forecasting harder for investors and elevates earnings unpredictability.
Heavy investment needs for AbemaTV
Abema requires heavy, ongoing investment—content production, sports rights and CDN scale demand capital often in the tens of billions of yen annually—while monetization can lag audience growth and compress margins. Break-even timelines have stretched across competitive cycles, delaying payback and increasing cash burn. This persistent investment burden weighs on CyberAgent’s consolidated profitability and free cash flow.
High reliance on third-party platforms
CyberAgent’s distribution and UA hinge on iOS/Android app stores and major ad networks, with iOS+Android accounting for over 99% of global app-store revenue. Store fees and policy changes (Apple/Google commissions typically 15–30%) can compress take rates and limit targeting. Google and Meta together hold roughly 55% of global digital ad spend, so algorithm shifts materially affect campaign performance and CPI, diluting control over the funnel.
Japan-centric revenue exposure
Heavy Japan-centric revenue concentration makes CyberAgent highly sensitive to domestic macro shifts and an aging demographic; overseas sales remain a small share, limiting natural currency and market diversification. Intense domestic competition in advertising and media compresses margins, and the company has struggled to scale global franchises beyond niche success.
- Domestic exposure
- Low FX diversification
- Strong local rivals
- Weak global scale
Regulatory sensitivity of gacha monetization
Loot box mechanics face rising regulatory scrutiny—Belgium (2018) and the Netherlands (2020) have classified some loot boxes as gambling, and UK/EU debates intensified through 2024—threatening payer conversion and ARPPU for gacha-driven titles. Any tightening of rules can reduce high-value spenders and force redesigns, adding compliance overhead and shrinking margins. Negative public perception can cascade to other CyberAgent segments, amplifying revenue risk.
- Regulatory rulings: Belgium 2018, Netherlands 2020
- Impact: lower payer conversion and ARPPU under tighter rules
- Cost: increased compliance and design constraints
- Reputation: spillover risk across business units
Hit-driven revenue swings and massive content spend amplify margin and distribution risk
Revenue swings from a few hit titles and high live-ops costs raise margin volatility and forecasting risk. Abema needs tens of billions of yen annually in content/sports/CDN spend, delaying break-even and pressuring cash flow. Distribution relies on iOS/Android (>99% app-store revenue) and ad platforms (Google+Meta ~55% global spend; Apple/Google fees 15–30%), reducing pricing and UA control.
| Metric | Value / Year |
|---|---|
| iOS+Android share | >99% |
| Google+Meta ad spend | ~55% |
| App-store fees | 15–30% |
| Abema investment | tens of billions yen / yr |
Full Version Awaits
CyberAgent SWOT Analysis
This is the actual CyberAgent SWOT analysis document you’ll receive upon purchase—no surprises, just professional quality. The preview below is taken directly from the full report and reflects the same structured, editable file available for download after payment. Buy now to unlock the complete, in-depth version ready for use.
Original: $10.00
-65%$10.00
$3.50Description
Make Insightful Decisions Backed by Expert Research
CyberAgent’s digital-ad and gaming strengths drive rapid growth, but competitive pressure and regulatory risks could strain margins. Our full SWOT reveals strategic levers, financial context, and scenario-based recommendations. Purchase the complete, editable report to plan, pitch, or invest with confidence.
Strengths
Diversified revenue across ads, media, games
CyberAgent combines digital advertising, AbemaTV and mobile games, reducing single-segment dependence and helping mitigate ad-market cyclicality; consolidated net sales reached ¥677.1 billion in FY2024, reflecting diversified demand. The ad/media/games mix smooths volatility from hit-driven titles and ad cycles, supporting steadier cash flow and optionality for capital allocation. Cross-learning between units improves user acquisition and monetization strategies.
Strong ad-tech and performance marketing capabilities
CyberAgent runs scaled performance-based advertising powered by proprietary optimization and data science, with the Advertising Business contributing roughly 70% of group revenue in FY2024. Best-in-class measurement and ROAS reporting increase advertiser stickiness and LTV. Deep creative and bidding know-how improves unit economics and CPM efficiency. These capabilities help sustain share versus global platforms in Japan.
Compelling first-party media asset in AbemaTV
AbemaTV, launched in 2016, supplies CyberAgent with owned inventory, first-party data and brand reach, serving over 10 million monthly active users. Live and variety programming drive higher engagement and advertiser appeal, enabling premium CPMs and audience targeting. The platform supports upsell of integrated cross-format campaigns and reduces dependence on external media marketplaces.
Proven mobile game development and IP monetization
CyberAgent has proven mobile game development and IP monetization capabilities, sustaining durable ARPUs in its gacha and social titles; live-ops proficiency in 2024–25 extends lifecycles and monetization windows while cross-media IP collaborations (anime, streaming, merchandising) amplify LTV and brand reach, and a deep release pipeline cushions single-title risk.
- Live-ops-driven ARPU resilience
- Cross-media LTV uplift
- Pipeline depth reduces volatility
Synergies from ecosystem and cross-promotion
Synergies across CyberAgent's advertising, games and media units let owned channels rapidly acquire users for new titles and programs, reducing paid acquisition needs and lowering CAC while increasing lifetime value.
Shared analytics, creative studios and engineering teams boost campaign efficiency and enable data-driven cross-promotion; talent, tech and datasets are reused across businesses to scale successful creatives and features.
These integrated operations improve gross margins and operating leverage over time, with marketing spend efficiency compounding as audiences grow across Abema, game platforms and ad inventory.
- Channels accelerate user acquisition
- Shared analytics & creative lift efficiency
- Shared talent, tech & data
- Lower CAC, higher margins over time
Ad-led media group: ¥677.1bn sales, ~70% ad share, 10M MAU
CyberAgent's diversified mix—Advertising (~70% revenue FY2024), AbemaTV (10M MAU) and mobile games—reduced single-segment risk and drove consolidated net sales of ¥677.1bn in FY2024. Proprietary performance-ad tech boosts ROAS and advertiser retention. Live-ops and cross-media IP sustain ARPU and extend title lifecycles, lowering CAC via owned channels.
| Metric | FY2024 |
|---|---|
| Net sales | ¥677.1bn |
| Ad share | ~70% |
| AbemaTV MAU | 10M |
What is included in the product
Detailed Word Document
Delivers a strategic overview of CyberAgent’s internal strengths and weaknesses and evaluates external opportunities and threats shaping its digital media and advertising businesses.
Customizable Excel Spreadsheet
Provides a concise, CyberAgent-specific SWOT matrix for rapid strategy alignment and stakeholder briefings; editable format enables quick updates to reflect market shifts and simplifies cross-unit comparisons.
Weaknesses
Profit volatility from hit-driven games
Revenue concentration in a few top titles creates large swings in bookings, so underperformance or delays of new releases can materially dent quarterly results. Sustaining engagement for flagship games requires continual live-ops investment, increasing operating leverage and margin volatility. This hit-driven model makes forecasting harder for investors and elevates earnings unpredictability.
Heavy investment needs for AbemaTV
Abema requires heavy, ongoing investment—content production, sports rights and CDN scale demand capital often in the tens of billions of yen annually—while monetization can lag audience growth and compress margins. Break-even timelines have stretched across competitive cycles, delaying payback and increasing cash burn. This persistent investment burden weighs on CyberAgent’s consolidated profitability and free cash flow.
High reliance on third-party platforms
CyberAgent’s distribution and UA hinge on iOS/Android app stores and major ad networks, with iOS+Android accounting for over 99% of global app-store revenue. Store fees and policy changes (Apple/Google commissions typically 15–30%) can compress take rates and limit targeting. Google and Meta together hold roughly 55% of global digital ad spend, so algorithm shifts materially affect campaign performance and CPI, diluting control over the funnel.
Japan-centric revenue exposure
Heavy Japan-centric revenue concentration makes CyberAgent highly sensitive to domestic macro shifts and an aging demographic; overseas sales remain a small share, limiting natural currency and market diversification. Intense domestic competition in advertising and media compresses margins, and the company has struggled to scale global franchises beyond niche success.
- Domestic exposure
- Low FX diversification
- Strong local rivals
- Weak global scale
Regulatory sensitivity of gacha monetization
Loot box mechanics face rising regulatory scrutiny—Belgium (2018) and the Netherlands (2020) have classified some loot boxes as gambling, and UK/EU debates intensified through 2024—threatening payer conversion and ARPPU for gacha-driven titles. Any tightening of rules can reduce high-value spenders and force redesigns, adding compliance overhead and shrinking margins. Negative public perception can cascade to other CyberAgent segments, amplifying revenue risk.
- Regulatory rulings: Belgium 2018, Netherlands 2020
- Impact: lower payer conversion and ARPPU under tighter rules
- Cost: increased compliance and design constraints
- Reputation: spillover risk across business units
Hit-driven revenue swings and massive content spend amplify margin and distribution risk
Revenue swings from a few hit titles and high live-ops costs raise margin volatility and forecasting risk. Abema needs tens of billions of yen annually in content/sports/CDN spend, delaying break-even and pressuring cash flow. Distribution relies on iOS/Android (>99% app-store revenue) and ad platforms (Google+Meta ~55% global spend; Apple/Google fees 15–30%), reducing pricing and UA control.
| Metric | Value / Year |
|---|---|
| iOS+Android share | >99% |
| Google+Meta ad spend | ~55% |
| App-store fees | 15–30% |
| Abema investment | tens of billions yen / yr |
Full Version Awaits
CyberAgent SWOT Analysis
This is the actual CyberAgent SWOT analysis document you’ll receive upon purchase—no surprises, just professional quality. The preview below is taken directly from the full report and reflects the same structured, editable file available for download after payment. Buy now to unlock the complete, in-depth version ready for use.











