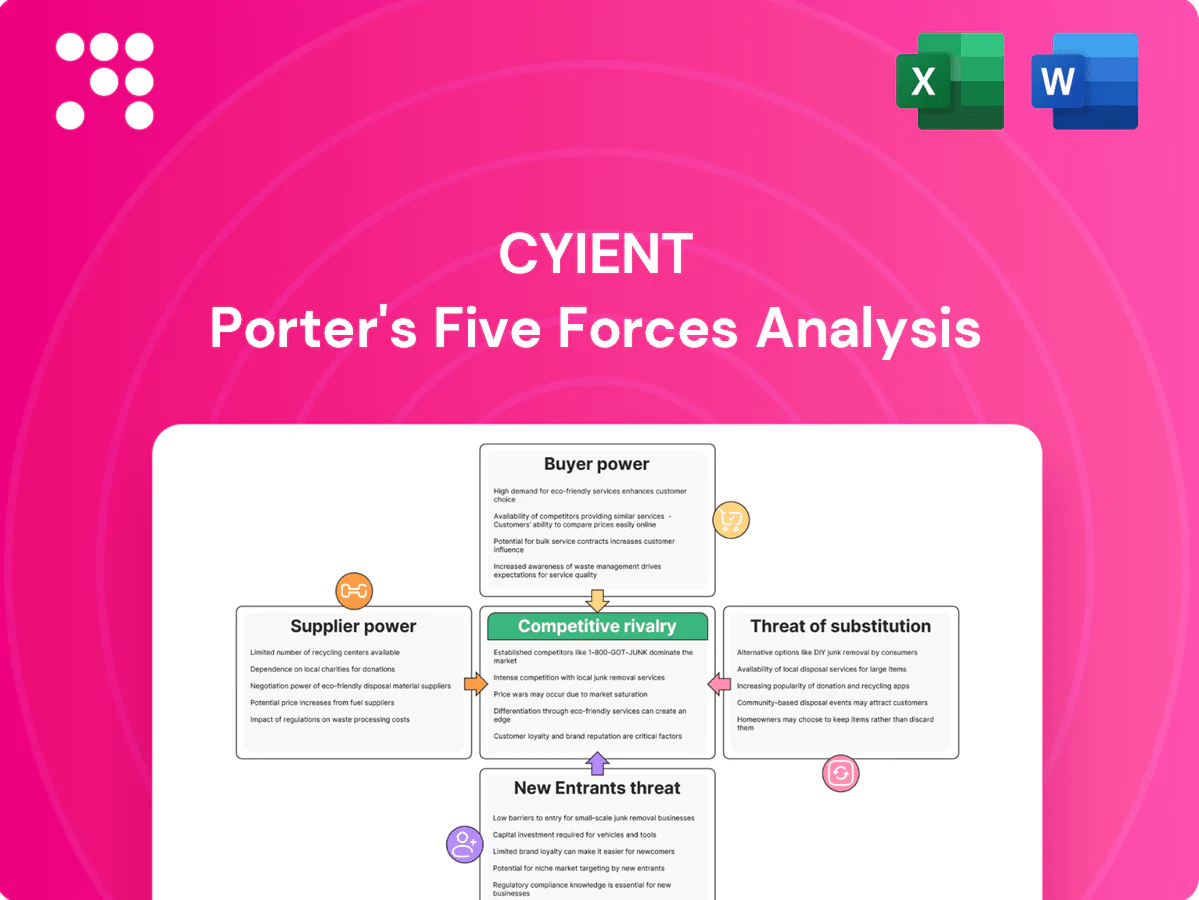
Cyient Porter's Five Forces Analysis

From Overview to Strategy Blueprint
Cyient faces moderate buyer power, specialized supplier relationships, and steady threat from niche entrants as digital engineering reshapes its markets; competitive rivalry is intense among engineering service providers while substitutes emerge from automation and platform players. This brief snapshot only scratches the surface. Unlock the full Porter's Five Forces Analysis to explore Cyient’s competitive dynamics, market pressures, and strategic advantages in detail.
Suppliers Bargaining Power

Scarce domain talent
Cyient relies on scarce aerospace, telecom and safety‑critical engineers, and with FY2024 revenue of ~INR 4,824 crore (~$590M) the company faces wage inflation and attrition pressures; industry attrition hovered near 20% in 2024, boosting supplier leverage. Visa limits and security clearances further tighten cross‑border talent flow. Expanded L&D, internal academies and targeted hiring pipelines partially mitigate but do not eliminate supplier bargaining power.
Dependence on tool chains
Dependence on tool chains is high: in 2024 major vendors (Siemens, Dassault, PTC, Autodesk) supply the bulk of CAD/PLM and simulation licenses, accounting for over 60% of commercial seats, giving them pricing power. Switching costs plus certification rework and training (often 3–12 months) and bundled enterprise agreements (commonly 3–5 year terms) reinforce vendor leverage. Growing use of open-source and in-house tools is expected to trim licensing spend by up to 20% over three years.

Cloud and data platform vendors
Mission workloads for Cyient increasingly sit on hyperscalers—AWS ~32%, Microsoft Azure ~22%, Google Cloud ~11% (2024 market share)—creating concentration risk. Egress fees (up to ~$0.09/GB), proprietary managed services and platform certification paths embed vendor lock-in and revenue share for vendors. Outage and compliance risks (enterprise breach/availability costs in millions) raise switching barriers. Multi-cloud adoption (92% of orgs in 2024) hedges risk but adds orchestration complexity.

Specialized manufacturing partners
Specialized precision machining, PCB assembly and testing vendors concentrate in regulated sectors, so PPAP/FAI and qualification cycles (often 6–12 months) raise replacement costs and give suppliers leverage; 2024 saw heightened lead-time volatility that shifts pricing power to suppliers during capacity upturns. Dual-sourcing and VAVE programs are primary mitigants.
- Concentration: limited qualified vendors
- Qualification time: 6–12 months
- 2024: increased lead-time volatility
- Mitigants: dual-sourcing, VAVE
Geopolitics and compliance
- Supplier concentration: >50% spend to approved vendors
- Compliance premium (2024): 3–7% on supplier pricing
- Regionalization effect: reduces single-source risk ~20–30% but fragments scale
Supplier power rises as engineer scarcity, CAD/PLM and hyperscaler concentration increase lock-in
Cyient faces strong supplier bargaining from scarce engineers (FY2024 rev INR 4,824 crore; industry attrition ~20% in 2024) and concentrated CAD/PLM vendors (>60% seats). Hyperscaler concentration (AWS 32%, Azure 22%, GCP 11%) plus egress fees (~$0.09/GB) raise lock‑in; qualification cycles 6–12 months and 2024 lead‑time volatility shift pricing power to suppliers. Mitigants: dual‑sourcing, L&D, in‑house tools, VAVE; licensing cuts possible ~20% over 3 years.
| Metric | Value (2024) |
|---|---|
| Revenue | INR 4,824 cr (~$590M) |
| Attrition | ~20% |
| CAD/PLM share | >60% |
| Hyperscalers | AWS 32% / Azure 22% / GCP 11% |
| Compliance premium | 3–7% |
What is included in the product
 Detailed Word Document
Porter’s Five Forces analysis for Cyient uncovers competitive pressures, buyer and supplier bargaining power, threat of substitutes and new entrants, and industry rivalry, highlighting factors that shape its pricing, margins, and strategic positioning. The assessment identifies disruptive technologies, regulatory and market-entry risks, and defensive strengths Cyient can leverage to protect and grow market share.

 Customizable Excel Spreadsheet
A clear, one-sheet Porter's Five Forces for Cyient—visualizing competitive pressures across suppliers, buyers, entrants, substitutes, and rivalry to relieve analysis bottlenecks and speed strategic decisions. Swap in your own data or duplicate for scenario comparisons to keep insights current and board-ready.
Customers Bargaining Power

Concentrated enterprise clients
Cyient’s customers are concentrated large OEMs and operators with sizable annual spend, running competitive RFPs and extracting volume discounts that compress supplier margins. Vendor consolidation programs among these enterprises intensify price pressure and shift negotiating leverage away from suppliers. Strategic co-creation and integrated service offerings are used to trade down short-term margin for long-term client stickiness and higher lifetime value.
High switching yet multi-sourcing
Certification, proprietary tools, and domain knowledge raise switching costs for Cyient, softening customer bargaining despite industry mobility; long-term frameworks typically span 3–5 years and reduce churn. Clients however commonly multi-source for resilience—Gartner 2024 reports about 64% of enterprises use multi-sourcing—enabling rate benchmarking and aggressive SLA terms. Renewal points routinely reset pricing and margins.

Outcome-based and risk-sharing deals
Buyers increasingly push outcome, milestone and gainshare models, shifting delivery and performance risk onto Cyient; in FY2024 Cyient reported revenue of about USD 627 million, heightening exposure to contract performance. Penalties and service credits, often 10–15% of contract value in industry practice, amplify buyer leverage. Robust governance, measurable KPIs and real-time performance dashboards are essential to mitigate this risk.

Regulatory and security demands
Regulatory and security demands in defense, healthcare and rail force buyers to insist on audits, secure facilities and cleared staff; US DoD FY2024 budget (~858 billion USD) heightens compliance scrutiny across supply chains, and healthcare/rail oversight tightened after recent high-profile incidents. Non-compliance risks contract loss or higher concessions, while certified compliance can justify premiums but attracts continuous audits and oversight.
- Compliance-driven pricing pressure
- Cleared-staff and facility mandates
- Audit frequency and cost escalation
- DoD FY2024 ~858B USD increases buyer leverage
Digital convergence expectations
Clients increasingly demand integrated engineering, digital and manufacturing outcomes; Cyient emphasized this integrated services strategy in FY2024, driving demand for one-stop partners to cut orchestration costs and timelines.
Such convergence pressures rates on commoditized work, but firms that offer differentiated IP and platforms—owning system-level software or automation—reclaim margin and capture higher lifetime value.
OEMs multi-source 64%; USD 627M raises renewal risk
Cyient’s buyers are large, concentrated OEMs that run competitive RFPs and multi-source (Gartner 2024: 64%), exerting strong price and SLA leverage. Long-term frameworks (3–5 years) and certifications raise switching costs, but renewal points reset pricing; FY2024 revenue ~USD 627M increases exposure to performance risk. Industry penalties/service credits commonly 10–15%; US DoD FY2024 budget ~USD 858B heightens compliance demands.
| Metric | Value |
|---|---|
| FY2024 revenue | USD 627M |
| Multi-sourcing rate (Gartner 2024) | 64% |
| Typical penalties/service credits | 10–15% |
| US DoD FY2024 budget | USD 858B |
| Typical contract length | 3–5 years |
Full Version Awaits
Cyient Porter's Five Forces Analysis
This preview shows the exact Cyient Porter’s Five Forces Analysis document you’ll receive immediately after purchase—no surprises and no placeholders. The file on display is the full, professionally formatted analysis, ready for download and use the moment you buy. You’re previewing the final deliverable; instant access is granted upon payment.

From Overview to Strategy Blueprint
Cyient faces moderate buyer power, specialized supplier relationships, and steady threat from niche entrants as digital engineering reshapes its markets; competitive rivalry is intense among engineering service providers while substitutes emerge from automation and platform players. This brief snapshot only scratches the surface. Unlock the full Porter's Five Forces Analysis to explore Cyient’s competitive dynamics, market pressures, and strategic advantages in detail.
Suppliers Bargaining Power
Scarce domain talent
Cyient relies on scarce aerospace, telecom and safety‑critical engineers, and with FY2024 revenue of ~INR 4,824 crore (~$590M) the company faces wage inflation and attrition pressures; industry attrition hovered near 20% in 2024, boosting supplier leverage. Visa limits and security clearances further tighten cross‑border talent flow. Expanded L&D, internal academies and targeted hiring pipelines partially mitigate but do not eliminate supplier bargaining power.
Dependence on tool chains
Dependence on tool chains is high: in 2024 major vendors (Siemens, Dassault, PTC, Autodesk) supply the bulk of CAD/PLM and simulation licenses, accounting for over 60% of commercial seats, giving them pricing power. Switching costs plus certification rework and training (often 3–12 months) and bundled enterprise agreements (commonly 3–5 year terms) reinforce vendor leverage. Growing use of open-source and in-house tools is expected to trim licensing spend by up to 20% over three years.
Cloud and data platform vendors
Mission workloads for Cyient increasingly sit on hyperscalers—AWS ~32%, Microsoft Azure ~22%, Google Cloud ~11% (2024 market share)—creating concentration risk. Egress fees (up to ~$0.09/GB), proprietary managed services and platform certification paths embed vendor lock-in and revenue share for vendors. Outage and compliance risks (enterprise breach/availability costs in millions) raise switching barriers. Multi-cloud adoption (92% of orgs in 2024) hedges risk but adds orchestration complexity.
Specialized manufacturing partners
Specialized precision machining, PCB assembly and testing vendors concentrate in regulated sectors, so PPAP/FAI and qualification cycles (often 6–12 months) raise replacement costs and give suppliers leverage; 2024 saw heightened lead-time volatility that shifts pricing power to suppliers during capacity upturns. Dual-sourcing and VAVE programs are primary mitigants.
- Concentration: limited qualified vendors
- Qualification time: 6–12 months
- 2024: increased lead-time volatility
- Mitigants: dual-sourcing, VAVE
Geopolitics and compliance
- Supplier concentration: >50% spend to approved vendors
- Compliance premium (2024): 3–7% on supplier pricing
- Regionalization effect: reduces single-source risk ~20–30% but fragments scale
Supplier power rises as engineer scarcity, CAD/PLM and hyperscaler concentration increase lock-in
Cyient faces strong supplier bargaining from scarce engineers (FY2024 rev INR 4,824 crore; industry attrition ~20% in 2024) and concentrated CAD/PLM vendors (>60% seats). Hyperscaler concentration (AWS 32%, Azure 22%, GCP 11%) plus egress fees (~$0.09/GB) raise lock‑in; qualification cycles 6–12 months and 2024 lead‑time volatility shift pricing power to suppliers. Mitigants: dual‑sourcing, L&D, in‑house tools, VAVE; licensing cuts possible ~20% over 3 years.
| Metric | Value (2024) |
|---|---|
| Revenue | INR 4,824 cr (~$590M) |
| Attrition | ~20% |
| CAD/PLM share | >60% |
| Hyperscalers | AWS 32% / Azure 22% / GCP 11% |
| Compliance premium | 3–7% |
What is included in the product
Detailed Word Document
Porter’s Five Forces analysis for Cyient uncovers competitive pressures, buyer and supplier bargaining power, threat of substitutes and new entrants, and industry rivalry, highlighting factors that shape its pricing, margins, and strategic positioning. The assessment identifies disruptive technologies, regulatory and market-entry risks, and defensive strengths Cyient can leverage to protect and grow market share.
Customizable Excel Spreadsheet
A clear, one-sheet Porter's Five Forces for Cyient—visualizing competitive pressures across suppliers, buyers, entrants, substitutes, and rivalry to relieve analysis bottlenecks and speed strategic decisions. Swap in your own data or duplicate for scenario comparisons to keep insights current and board-ready.
Customers Bargaining Power
Concentrated enterprise clients
Cyient’s customers are concentrated large OEMs and operators with sizable annual spend, running competitive RFPs and extracting volume discounts that compress supplier margins. Vendor consolidation programs among these enterprises intensify price pressure and shift negotiating leverage away from suppliers. Strategic co-creation and integrated service offerings are used to trade down short-term margin for long-term client stickiness and higher lifetime value.
High switching yet multi-sourcing
Certification, proprietary tools, and domain knowledge raise switching costs for Cyient, softening customer bargaining despite industry mobility; long-term frameworks typically span 3–5 years and reduce churn. Clients however commonly multi-source for resilience—Gartner 2024 reports about 64% of enterprises use multi-sourcing—enabling rate benchmarking and aggressive SLA terms. Renewal points routinely reset pricing and margins.
Outcome-based and risk-sharing deals
Buyers increasingly push outcome, milestone and gainshare models, shifting delivery and performance risk onto Cyient; in FY2024 Cyient reported revenue of about USD 627 million, heightening exposure to contract performance. Penalties and service credits, often 10–15% of contract value in industry practice, amplify buyer leverage. Robust governance, measurable KPIs and real-time performance dashboards are essential to mitigate this risk.
Regulatory and security demands
Regulatory and security demands in defense, healthcare and rail force buyers to insist on audits, secure facilities and cleared staff; US DoD FY2024 budget (~858 billion USD) heightens compliance scrutiny across supply chains, and healthcare/rail oversight tightened after recent high-profile incidents. Non-compliance risks contract loss or higher concessions, while certified compliance can justify premiums but attracts continuous audits and oversight.
- Compliance-driven pricing pressure
- Cleared-staff and facility mandates
- Audit frequency and cost escalation
- DoD FY2024 ~858B USD increases buyer leverage
Digital convergence expectations
Clients increasingly demand integrated engineering, digital and manufacturing outcomes; Cyient emphasized this integrated services strategy in FY2024, driving demand for one-stop partners to cut orchestration costs and timelines.
Such convergence pressures rates on commoditized work, but firms that offer differentiated IP and platforms—owning system-level software or automation—reclaim margin and capture higher lifetime value.
OEMs multi-source 64%; USD 627M raises renewal risk
Cyient’s buyers are large, concentrated OEMs that run competitive RFPs and multi-source (Gartner 2024: 64%), exerting strong price and SLA leverage. Long-term frameworks (3–5 years) and certifications raise switching costs, but renewal points reset pricing; FY2024 revenue ~USD 627M increases exposure to performance risk. Industry penalties/service credits commonly 10–15%; US DoD FY2024 budget ~USD 858B heightens compliance demands.
| Metric | Value |
|---|---|
| FY2024 revenue | USD 627M |
| Multi-sourcing rate (Gartner 2024) | 64% |
| Typical penalties/service credits | 10–15% |
| US DoD FY2024 budget | USD 858B |
| Typical contract length | 3–5 years |
Full Version Awaits
Cyient Porter's Five Forces Analysis
This preview shows the exact Cyient Porter’s Five Forces Analysis document you’ll receive immediately after purchase—no surprises and no placeholders. The file on display is the full, professionally formatted analysis, ready for download and use the moment you buy. You’re previewing the final deliverable; instant access is granted upon payment.
Description
From Overview to Strategy Blueprint
Cyient faces moderate buyer power, specialized supplier relationships, and steady threat from niche entrants as digital engineering reshapes its markets; competitive rivalry is intense among engineering service providers while substitutes emerge from automation and platform players. This brief snapshot only scratches the surface. Unlock the full Porter's Five Forces Analysis to explore Cyient’s competitive dynamics, market pressures, and strategic advantages in detail.
Suppliers Bargaining Power
Scarce domain talent
Cyient relies on scarce aerospace, telecom and safety‑critical engineers, and with FY2024 revenue of ~INR 4,824 crore (~$590M) the company faces wage inflation and attrition pressures; industry attrition hovered near 20% in 2024, boosting supplier leverage. Visa limits and security clearances further tighten cross‑border talent flow. Expanded L&D, internal academies and targeted hiring pipelines partially mitigate but do not eliminate supplier bargaining power.
Dependence on tool chains
Dependence on tool chains is high: in 2024 major vendors (Siemens, Dassault, PTC, Autodesk) supply the bulk of CAD/PLM and simulation licenses, accounting for over 60% of commercial seats, giving them pricing power. Switching costs plus certification rework and training (often 3–12 months) and bundled enterprise agreements (commonly 3–5 year terms) reinforce vendor leverage. Growing use of open-source and in-house tools is expected to trim licensing spend by up to 20% over three years.
Cloud and data platform vendors
Mission workloads for Cyient increasingly sit on hyperscalers—AWS ~32%, Microsoft Azure ~22%, Google Cloud ~11% (2024 market share)—creating concentration risk. Egress fees (up to ~$0.09/GB), proprietary managed services and platform certification paths embed vendor lock-in and revenue share for vendors. Outage and compliance risks (enterprise breach/availability costs in millions) raise switching barriers. Multi-cloud adoption (92% of orgs in 2024) hedges risk but adds orchestration complexity.
Specialized manufacturing partners
Specialized precision machining, PCB assembly and testing vendors concentrate in regulated sectors, so PPAP/FAI and qualification cycles (often 6–12 months) raise replacement costs and give suppliers leverage; 2024 saw heightened lead-time volatility that shifts pricing power to suppliers during capacity upturns. Dual-sourcing and VAVE programs are primary mitigants.
- Concentration: limited qualified vendors
- Qualification time: 6–12 months
- 2024: increased lead-time volatility
- Mitigants: dual-sourcing, VAVE
Geopolitics and compliance
- Supplier concentration: >50% spend to approved vendors
- Compliance premium (2024): 3–7% on supplier pricing
- Regionalization effect: reduces single-source risk ~20–30% but fragments scale
Supplier power rises as engineer scarcity, CAD/PLM and hyperscaler concentration increase lock-in
Cyient faces strong supplier bargaining from scarce engineers (FY2024 rev INR 4,824 crore; industry attrition ~20% in 2024) and concentrated CAD/PLM vendors (>60% seats). Hyperscaler concentration (AWS 32%, Azure 22%, GCP 11%) plus egress fees (~$0.09/GB) raise lock‑in; qualification cycles 6–12 months and 2024 lead‑time volatility shift pricing power to suppliers. Mitigants: dual‑sourcing, L&D, in‑house tools, VAVE; licensing cuts possible ~20% over 3 years.
| Metric | Value (2024) |
|---|---|
| Revenue | INR 4,824 cr (~$590M) |
| Attrition | ~20% |
| CAD/PLM share | >60% |
| Hyperscalers | AWS 32% / Azure 22% / GCP 11% |
| Compliance premium | 3–7% |
What is included in the product
Detailed Word Document
Porter’s Five Forces analysis for Cyient uncovers competitive pressures, buyer and supplier bargaining power, threat of substitutes and new entrants, and industry rivalry, highlighting factors that shape its pricing, margins, and strategic positioning. The assessment identifies disruptive technologies, regulatory and market-entry risks, and defensive strengths Cyient can leverage to protect and grow market share.
Customizable Excel Spreadsheet
A clear, one-sheet Porter's Five Forces for Cyient—visualizing competitive pressures across suppliers, buyers, entrants, substitutes, and rivalry to relieve analysis bottlenecks and speed strategic decisions. Swap in your own data or duplicate for scenario comparisons to keep insights current and board-ready.
Customers Bargaining Power
Concentrated enterprise clients
Cyient’s customers are concentrated large OEMs and operators with sizable annual spend, running competitive RFPs and extracting volume discounts that compress supplier margins. Vendor consolidation programs among these enterprises intensify price pressure and shift negotiating leverage away from suppliers. Strategic co-creation and integrated service offerings are used to trade down short-term margin for long-term client stickiness and higher lifetime value.
High switching yet multi-sourcing
Certification, proprietary tools, and domain knowledge raise switching costs for Cyient, softening customer bargaining despite industry mobility; long-term frameworks typically span 3–5 years and reduce churn. Clients however commonly multi-source for resilience—Gartner 2024 reports about 64% of enterprises use multi-sourcing—enabling rate benchmarking and aggressive SLA terms. Renewal points routinely reset pricing and margins.
Outcome-based and risk-sharing deals
Buyers increasingly push outcome, milestone and gainshare models, shifting delivery and performance risk onto Cyient; in FY2024 Cyient reported revenue of about USD 627 million, heightening exposure to contract performance. Penalties and service credits, often 10–15% of contract value in industry practice, amplify buyer leverage. Robust governance, measurable KPIs and real-time performance dashboards are essential to mitigate this risk.
Regulatory and security demands
Regulatory and security demands in defense, healthcare and rail force buyers to insist on audits, secure facilities and cleared staff; US DoD FY2024 budget (~858 billion USD) heightens compliance scrutiny across supply chains, and healthcare/rail oversight tightened after recent high-profile incidents. Non-compliance risks contract loss or higher concessions, while certified compliance can justify premiums but attracts continuous audits and oversight.
- Compliance-driven pricing pressure
- Cleared-staff and facility mandates
- Audit frequency and cost escalation
- DoD FY2024 ~858B USD increases buyer leverage
Digital convergence expectations
Clients increasingly demand integrated engineering, digital and manufacturing outcomes; Cyient emphasized this integrated services strategy in FY2024, driving demand for one-stop partners to cut orchestration costs and timelines.
Such convergence pressures rates on commoditized work, but firms that offer differentiated IP and platforms—owning system-level software or automation—reclaim margin and capture higher lifetime value.
OEMs multi-source 64%; USD 627M raises renewal risk
Cyient’s buyers are large, concentrated OEMs that run competitive RFPs and multi-source (Gartner 2024: 64%), exerting strong price and SLA leverage. Long-term frameworks (3–5 years) and certifications raise switching costs, but renewal points reset pricing; FY2024 revenue ~USD 627M increases exposure to performance risk. Industry penalties/service credits commonly 10–15%; US DoD FY2024 budget ~USD 858B heightens compliance demands.
| Metric | Value |
|---|---|
| FY2024 revenue | USD 627M |
| Multi-sourcing rate (Gartner 2024) | 64% |
| Typical penalties/service credits | 10–15% |
| US DoD FY2024 budget | USD 858B |
| Typical contract length | 3–5 years |
Full Version Awaits
Cyient Porter's Five Forces Analysis
This preview shows the exact Cyient Porter’s Five Forces Analysis document you’ll receive immediately after purchase—no surprises and no placeholders. The file on display is the full, professionally formatted analysis, ready for download and use the moment you buy. You’re previewing the final deliverable; instant access is granted upon payment.











