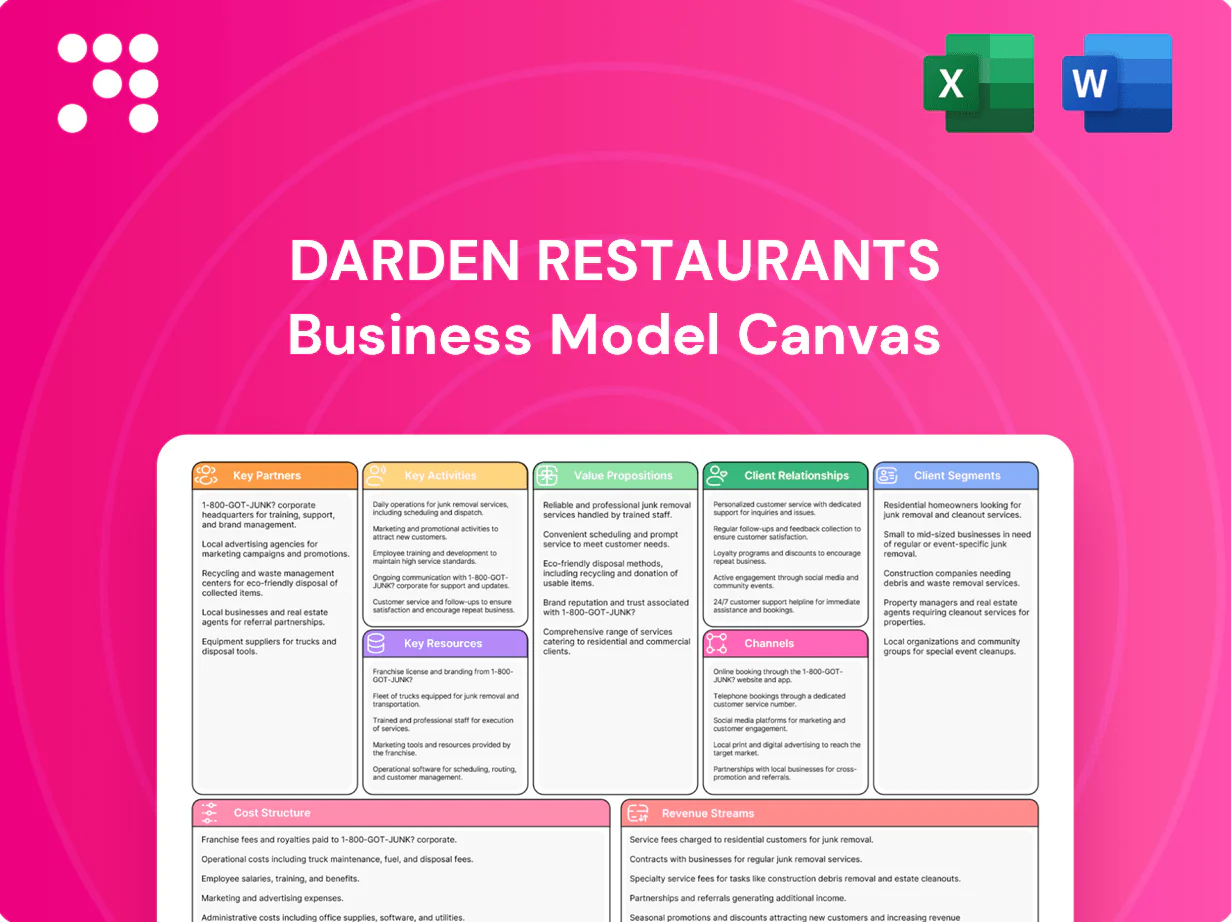
Darden Restaurants Business Model Canvas

Complete Restaurant Business Model Canvas: Scale strategies, revenue streams & menu diversification
Unlock the full Business Model Canvas for Darden Restaurants and discover the strategic blueprint behind its scale, menu diversification, and multi-brand operations. This in-depth, editable file reveals value propositions, customer segments, revenue streams, and cost structure—ready for benchmarking or investor decks. Purchase the complete Word & Excel canvas to apply proven restaurant strategies to your business or analysis.
Partnerships

Strategic Food & Beverage Suppliers
Partnering with national and regional vendors for proteins, produce and pantry staples ensures quality and consistency across Darden’s portfolio, which operated about 1,900 restaurants in fiscal 2024. Locked-in contracts stabilize pricing and supply availability across that scale. Co-innovation with suppliers drives menu refreshes and limited-time offers, while end-to-end safety and traceability standards are coordinated through centralized procurement and supplier audits.
Alcohol & Beverage Distributors
Relationships with wine, beer, and spirits distributors support bar programs and upscale concepts across Darden’s ~1,860 restaurants, helping drive Darden’s FY24 revenue of $11.82 billion. Pricing, allocations, and distributor-led staff training improve mix and margins. Seasonal and exclusive beverage offerings boost traffic and average checks. Compliance and logistics are streamlined through trusted partners to ensure consistent supply and regulatory adherence.

Technology & Delivery Platforms
POS, reservation, kitchen display and analytics partners enable efficient operations across Darden's portfolio of about 1,900 restaurants, supporting FY2024 net sales of $11.7 billion. Delivery marketplaces extend reach for off-premise demand and helped drive double-digit off-premise growth in recent years. Integrations with loyalty and payment systems raise check and retention, while joint marketing with platforms increases incremental orders and visit frequency.

Real Estate Owners & Developers
Real estate owners, REITs and developers provide Darden access to prime trade areas, enabling favorable lease terms and build-to-suit projects that support disciplined growth and margin preservation. Co-tenancy and site synergy with strong retail anchors drive incremental traffic and average check gains, while facilities partners handle maintenance, remodels and sustainability retrofits to reduce operating disruptions and energy costs.
- Landlords/REITs: access to prime sites
- Developers: build-to-suit expansion
- Lease terms: support disciplined growth
- Co-tenancy: enhances traffic
- Facilities partners: maintenance, remodels, retrofits
Marketing, Media & Community Partners
- Agencies: campaign scale
- Influencers: reach & authenticity
- Local orgs: community trust
- Cause events: loyalty uplift
- Tourism/hotels: occasion lift
- Data partners: targeting & ROI
Supply tech & real estate partnerships fuel off-premise growth and $11.82B
Supplier contracts ensure quality and price stability across Darden’s ~1,900 restaurants and support FY2024 revenue of $11.82 billion. Beverage distributors, POS and delivery partners boost mix, off‑premise growth and loyalty. Real estate, facilities and agencies enable disciplined expansion, remodels and marketing lift.
| Partnership | Role | FY24 metric |
|---|---|---|
| Suppliers | Consistency & cost | ~1,900 stores |
| Tech/Delivery | Off‑premise & loyalty | $11.82B revenue |
What is included in the product
 Detailed Word Document
A concise, investor-ready Business Model Canvas for Darden Restaurants covering customer segments, channels, value propositions, revenue streams, cost structure, key activities, resources, partners and customer relationships across its multi-brand casual dining portfolio; highlights operational scale, brand differentiation, franchise/corporate mix and competitive advantages for strategy and funding discussions.

 Customizable Excel Spreadsheet
High-level view of Darden's business model with editable cells that distills multi-brand operations, menu innovation, and supply-chain efficiency into a single page, relieving analysis friction and speeding strategy alignment.
Activities

Operational Excellence & Service
Execute consistent kitchen and service standards across concepts to ensure reliable guest experience across Darden’s ~1,900 restaurants (2024). Manage throughput and table turns—balancing speed and hospitality—to maximize satisfaction and same-restaurant sales growth. Continuous improvement programs reduce waste and errors through standardized checklists and training. Safety and compliance are embedded in daily routines and audited company-wide.
Menu Innovation & Culinary R&D
Menu Innovation & Culinary R&D develops core, seasonal and limited-time menus tailored to each brand across Darden’s more than 1,900 restaurants (2024), balancing craveability, food cost and operational complexity to protect throughput. New items are piloted and refined using guest feedback and POS/CRM data to scale winners efficiently. Beverage programs are optimized for margin and differentiation, driving higher check averages and guest loyalty.

Supply Chain & Procurement
Darden sources at scale across its ~1,900 restaurants to lock quality and cost advantages, leveraging centralized purchasing to negotiate lower input prices. Demand forecasting and inventory systems target spoilage reduction and working-capital efficiency across the portfolio. Robust traceability, food-safety protocols, and vendor redundancy plus collaborative contingency planning limit supply disruptions.

Brand Marketing & CRM
Run targeted campaigns to drive traffic and frequency across Darden’s ~1,900 restaurants; use CRM, loyalty and promotions to personalize offers (FY2024 sales > $11B); manage reputation and social engagement and measure performance to optimize media mix and ROI.
- Targeted campaigns: traffic & frequency
- CRM/loyalty: personalized offers
- Reputation & social engagement
- Performance measurement: media mix optimization
Real Estate, Development & Remodels
Real estate team selects sites, negotiates leases and manages build-outs to open and remodel around 1,900 restaurants in 2024, ensuring brand standards through scheduled refresh programs and capital maintenance. Formats optimize dine-in, bar and off-premise flows to boost throughput and margins, with investment prioritized by market potential and ROI.
- Site sourcing & lease negotiation
- Build-outs & brand refreshes
- Format deployment: dine-in/bar/off-premise
- Capital allocated by ROI and market strength
Unified ops and central supply boost sales, safety, ROI across ~1,900 restaurants
Operate consistent service and kitchen standards across ~1,900 restaurants (2024) to drive same-restaurant sales and throughput. Centralized purchasing and supply-chain controls lower cost and ensure safety. Menu R&D and pilots optimize check and guest loyalty. Marketing/CRM and targeted real-estate execution support traffic, frequency and ROI.
| Metric | 2024 |
|---|---|
| Restaurants | ~1,900 |
| Brands | 9 |
| FY2024 Sales | >$11B |
What You See Is What You Get
Business Model Canvas
This preview is the exact Darden Restaurants Business Model Canvas you will receive after purchase; it’s not a mockup. The full deliverable includes the same structured, editable content in Word and Excel. No hidden pages or surprises—what you see is what you’ll download. Ready for presentation and modification.

Complete Restaurant Business Model Canvas: Scale strategies, revenue streams & menu diversification
Unlock the full Business Model Canvas for Darden Restaurants and discover the strategic blueprint behind its scale, menu diversification, and multi-brand operations. This in-depth, editable file reveals value propositions, customer segments, revenue streams, and cost structure—ready for benchmarking or investor decks. Purchase the complete Word & Excel canvas to apply proven restaurant strategies to your business or analysis.
Partnerships
Strategic Food & Beverage Suppliers
Partnering with national and regional vendors for proteins, produce and pantry staples ensures quality and consistency across Darden’s portfolio, which operated about 1,900 restaurants in fiscal 2024. Locked-in contracts stabilize pricing and supply availability across that scale. Co-innovation with suppliers drives menu refreshes and limited-time offers, while end-to-end safety and traceability standards are coordinated through centralized procurement and supplier audits.
Alcohol & Beverage Distributors
Relationships with wine, beer, and spirits distributors support bar programs and upscale concepts across Darden’s ~1,860 restaurants, helping drive Darden’s FY24 revenue of $11.82 billion. Pricing, allocations, and distributor-led staff training improve mix and margins. Seasonal and exclusive beverage offerings boost traffic and average checks. Compliance and logistics are streamlined through trusted partners to ensure consistent supply and regulatory adherence.
Technology & Delivery Platforms
POS, reservation, kitchen display and analytics partners enable efficient operations across Darden's portfolio of about 1,900 restaurants, supporting FY2024 net sales of $11.7 billion. Delivery marketplaces extend reach for off-premise demand and helped drive double-digit off-premise growth in recent years. Integrations with loyalty and payment systems raise check and retention, while joint marketing with platforms increases incremental orders and visit frequency.
Real Estate Owners & Developers
Real estate owners, REITs and developers provide Darden access to prime trade areas, enabling favorable lease terms and build-to-suit projects that support disciplined growth and margin preservation. Co-tenancy and site synergy with strong retail anchors drive incremental traffic and average check gains, while facilities partners handle maintenance, remodels and sustainability retrofits to reduce operating disruptions and energy costs.
- Landlords/REITs: access to prime sites
- Developers: build-to-suit expansion
- Lease terms: support disciplined growth
- Co-tenancy: enhances traffic
- Facilities partners: maintenance, remodels, retrofits
Marketing, Media & Community Partners
- Agencies: campaign scale
- Influencers: reach & authenticity
- Local orgs: community trust
- Cause events: loyalty uplift
- Tourism/hotels: occasion lift
- Data partners: targeting & ROI
Supply tech & real estate partnerships fuel off-premise growth and $11.82B
Supplier contracts ensure quality and price stability across Darden’s ~1,900 restaurants and support FY2024 revenue of $11.82 billion. Beverage distributors, POS and delivery partners boost mix, off‑premise growth and loyalty. Real estate, facilities and agencies enable disciplined expansion, remodels and marketing lift.
| Partnership | Role | FY24 metric |
|---|---|---|
| Suppliers | Consistency & cost | ~1,900 stores |
| Tech/Delivery | Off‑premise & loyalty | $11.82B revenue |
What is included in the product
Detailed Word Document
A concise, investor-ready Business Model Canvas for Darden Restaurants covering customer segments, channels, value propositions, revenue streams, cost structure, key activities, resources, partners and customer relationships across its multi-brand casual dining portfolio; highlights operational scale, brand differentiation, franchise/corporate mix and competitive advantages for strategy and funding discussions.
Customizable Excel Spreadsheet
High-level view of Darden's business model with editable cells that distills multi-brand operations, menu innovation, and supply-chain efficiency into a single page, relieving analysis friction and speeding strategy alignment.
Activities
Operational Excellence & Service
Execute consistent kitchen and service standards across concepts to ensure reliable guest experience across Darden’s ~1,900 restaurants (2024). Manage throughput and table turns—balancing speed and hospitality—to maximize satisfaction and same-restaurant sales growth. Continuous improvement programs reduce waste and errors through standardized checklists and training. Safety and compliance are embedded in daily routines and audited company-wide.
Menu Innovation & Culinary R&D
Menu Innovation & Culinary R&D develops core, seasonal and limited-time menus tailored to each brand across Darden’s more than 1,900 restaurants (2024), balancing craveability, food cost and operational complexity to protect throughput. New items are piloted and refined using guest feedback and POS/CRM data to scale winners efficiently. Beverage programs are optimized for margin and differentiation, driving higher check averages and guest loyalty.
Supply Chain & Procurement
Darden sources at scale across its ~1,900 restaurants to lock quality and cost advantages, leveraging centralized purchasing to negotiate lower input prices. Demand forecasting and inventory systems target spoilage reduction and working-capital efficiency across the portfolio. Robust traceability, food-safety protocols, and vendor redundancy plus collaborative contingency planning limit supply disruptions.
Brand Marketing & CRM
Run targeted campaigns to drive traffic and frequency across Darden’s ~1,900 restaurants; use CRM, loyalty and promotions to personalize offers (FY2024 sales > $11B); manage reputation and social engagement and measure performance to optimize media mix and ROI.
- Targeted campaigns: traffic & frequency
- CRM/loyalty: personalized offers
- Reputation & social engagement
- Performance measurement: media mix optimization
Real Estate, Development & Remodels
Real estate team selects sites, negotiates leases and manages build-outs to open and remodel around 1,900 restaurants in 2024, ensuring brand standards through scheduled refresh programs and capital maintenance. Formats optimize dine-in, bar and off-premise flows to boost throughput and margins, with investment prioritized by market potential and ROI.
- Site sourcing & lease negotiation
- Build-outs & brand refreshes
- Format deployment: dine-in/bar/off-premise
- Capital allocated by ROI and market strength
Unified ops and central supply boost sales, safety, ROI across ~1,900 restaurants
Operate consistent service and kitchen standards across ~1,900 restaurants (2024) to drive same-restaurant sales and throughput. Centralized purchasing and supply-chain controls lower cost and ensure safety. Menu R&D and pilots optimize check and guest loyalty. Marketing/CRM and targeted real-estate execution support traffic, frequency and ROI.
| Metric | 2024 |
|---|---|
| Restaurants | ~1,900 |
| Brands | 9 |
| FY2024 Sales | >$11B |
What You See Is What You Get
Business Model Canvas
This preview is the exact Darden Restaurants Business Model Canvas you will receive after purchase; it’s not a mockup. The full deliverable includes the same structured, editable content in Word and Excel. No hidden pages or surprises—what you see is what you’ll download. Ready for presentation and modification.
Original: $10.00
-65%$10.00
$3.50Description
Complete Restaurant Business Model Canvas: Scale strategies, revenue streams & menu diversification
Unlock the full Business Model Canvas for Darden Restaurants and discover the strategic blueprint behind its scale, menu diversification, and multi-brand operations. This in-depth, editable file reveals value propositions, customer segments, revenue streams, and cost structure—ready for benchmarking or investor decks. Purchase the complete Word & Excel canvas to apply proven restaurant strategies to your business or analysis.
Partnerships
Strategic Food & Beverage Suppliers
Partnering with national and regional vendors for proteins, produce and pantry staples ensures quality and consistency across Darden’s portfolio, which operated about 1,900 restaurants in fiscal 2024. Locked-in contracts stabilize pricing and supply availability across that scale. Co-innovation with suppliers drives menu refreshes and limited-time offers, while end-to-end safety and traceability standards are coordinated through centralized procurement and supplier audits.
Alcohol & Beverage Distributors
Relationships with wine, beer, and spirits distributors support bar programs and upscale concepts across Darden’s ~1,860 restaurants, helping drive Darden’s FY24 revenue of $11.82 billion. Pricing, allocations, and distributor-led staff training improve mix and margins. Seasonal and exclusive beverage offerings boost traffic and average checks. Compliance and logistics are streamlined through trusted partners to ensure consistent supply and regulatory adherence.
Technology & Delivery Platforms
POS, reservation, kitchen display and analytics partners enable efficient operations across Darden's portfolio of about 1,900 restaurants, supporting FY2024 net sales of $11.7 billion. Delivery marketplaces extend reach for off-premise demand and helped drive double-digit off-premise growth in recent years. Integrations with loyalty and payment systems raise check and retention, while joint marketing with platforms increases incremental orders and visit frequency.
Real Estate Owners & Developers
Real estate owners, REITs and developers provide Darden access to prime trade areas, enabling favorable lease terms and build-to-suit projects that support disciplined growth and margin preservation. Co-tenancy and site synergy with strong retail anchors drive incremental traffic and average check gains, while facilities partners handle maintenance, remodels and sustainability retrofits to reduce operating disruptions and energy costs.
- Landlords/REITs: access to prime sites
- Developers: build-to-suit expansion
- Lease terms: support disciplined growth
- Co-tenancy: enhances traffic
- Facilities partners: maintenance, remodels, retrofits
Marketing, Media & Community Partners
- Agencies: campaign scale
- Influencers: reach & authenticity
- Local orgs: community trust
- Cause events: loyalty uplift
- Tourism/hotels: occasion lift
- Data partners: targeting & ROI
Supply tech & real estate partnerships fuel off-premise growth and $11.82B
Supplier contracts ensure quality and price stability across Darden’s ~1,900 restaurants and support FY2024 revenue of $11.82 billion. Beverage distributors, POS and delivery partners boost mix, off‑premise growth and loyalty. Real estate, facilities and agencies enable disciplined expansion, remodels and marketing lift.
| Partnership | Role | FY24 metric |
|---|---|---|
| Suppliers | Consistency & cost | ~1,900 stores |
| Tech/Delivery | Off‑premise & loyalty | $11.82B revenue |
What is included in the product
Detailed Word Document
A concise, investor-ready Business Model Canvas for Darden Restaurants covering customer segments, channels, value propositions, revenue streams, cost structure, key activities, resources, partners and customer relationships across its multi-brand casual dining portfolio; highlights operational scale, brand differentiation, franchise/corporate mix and competitive advantages for strategy and funding discussions.
Customizable Excel Spreadsheet
High-level view of Darden's business model with editable cells that distills multi-brand operations, menu innovation, and supply-chain efficiency into a single page, relieving analysis friction and speeding strategy alignment.
Activities
Operational Excellence & Service
Execute consistent kitchen and service standards across concepts to ensure reliable guest experience across Darden’s ~1,900 restaurants (2024). Manage throughput and table turns—balancing speed and hospitality—to maximize satisfaction and same-restaurant sales growth. Continuous improvement programs reduce waste and errors through standardized checklists and training. Safety and compliance are embedded in daily routines and audited company-wide.
Menu Innovation & Culinary R&D
Menu Innovation & Culinary R&D develops core, seasonal and limited-time menus tailored to each brand across Darden’s more than 1,900 restaurants (2024), balancing craveability, food cost and operational complexity to protect throughput. New items are piloted and refined using guest feedback and POS/CRM data to scale winners efficiently. Beverage programs are optimized for margin and differentiation, driving higher check averages and guest loyalty.
Supply Chain & Procurement
Darden sources at scale across its ~1,900 restaurants to lock quality and cost advantages, leveraging centralized purchasing to negotiate lower input prices. Demand forecasting and inventory systems target spoilage reduction and working-capital efficiency across the portfolio. Robust traceability, food-safety protocols, and vendor redundancy plus collaborative contingency planning limit supply disruptions.
Brand Marketing & CRM
Run targeted campaigns to drive traffic and frequency across Darden’s ~1,900 restaurants; use CRM, loyalty and promotions to personalize offers (FY2024 sales > $11B); manage reputation and social engagement and measure performance to optimize media mix and ROI.
- Targeted campaigns: traffic & frequency
- CRM/loyalty: personalized offers
- Reputation & social engagement
- Performance measurement: media mix optimization
Real Estate, Development & Remodels
Real estate team selects sites, negotiates leases and manages build-outs to open and remodel around 1,900 restaurants in 2024, ensuring brand standards through scheduled refresh programs and capital maintenance. Formats optimize dine-in, bar and off-premise flows to boost throughput and margins, with investment prioritized by market potential and ROI.
- Site sourcing & lease negotiation
- Build-outs & brand refreshes
- Format deployment: dine-in/bar/off-premise
- Capital allocated by ROI and market strength
Unified ops and central supply boost sales, safety, ROI across ~1,900 restaurants
Operate consistent service and kitchen standards across ~1,900 restaurants (2024) to drive same-restaurant sales and throughput. Centralized purchasing and supply-chain controls lower cost and ensure safety. Menu R&D and pilots optimize check and guest loyalty. Marketing/CRM and targeted real-estate execution support traffic, frequency and ROI.
| Metric | 2024 |
|---|---|
| Restaurants | ~1,900 |
| Brands | 9 |
| FY2024 Sales | >$11B |
What You See Is What You Get
Business Model Canvas
This preview is the exact Darden Restaurants Business Model Canvas you will receive after purchase; it’s not a mockup. The full deliverable includes the same structured, editable content in Word and Excel. No hidden pages or surprises—what you see is what you’ll download. Ready for presentation and modification.











