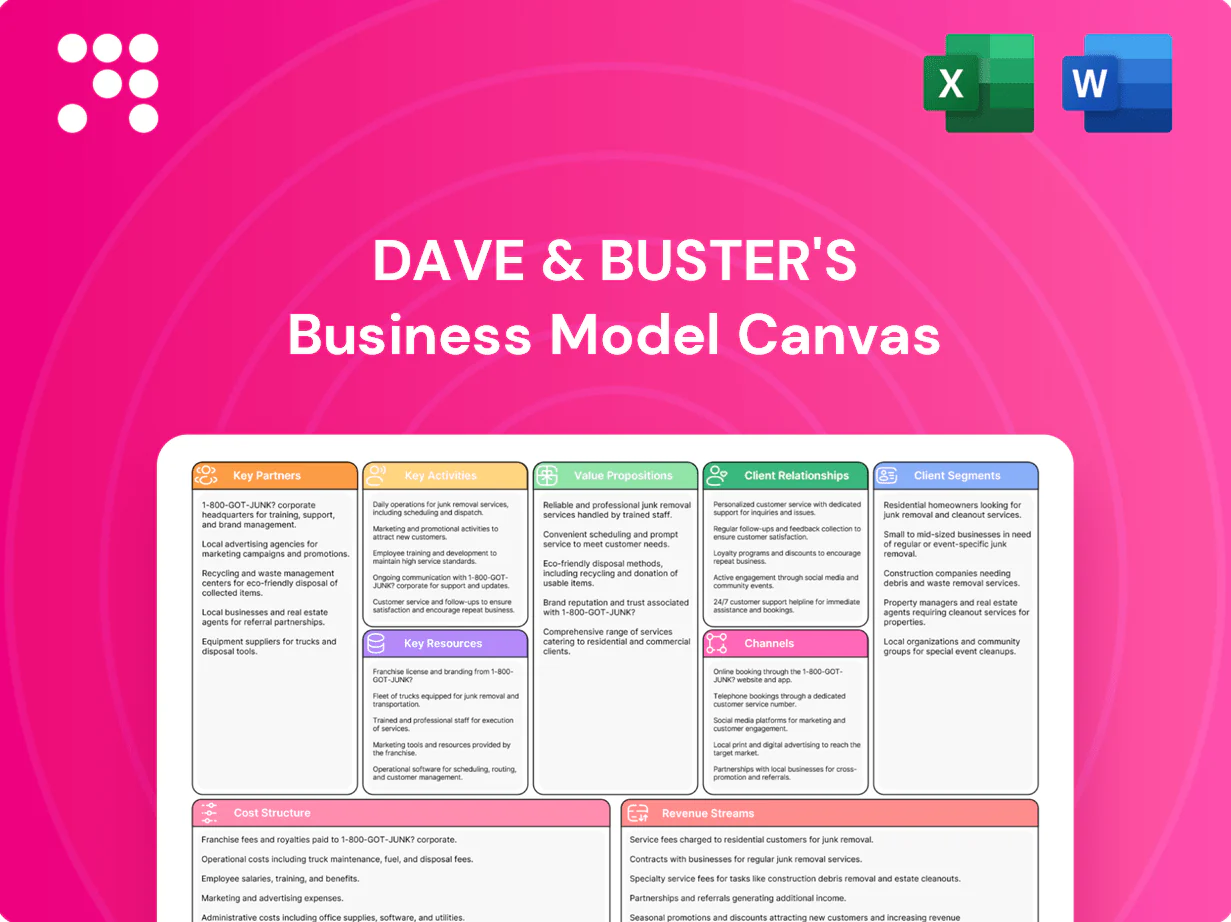
Dave & Buster's Business Model Canvas

Business Model Canvas: Dining and Entertainment playbook for investors and operators
Unlock the full strategic blueprint behind Dave & Buster's: this in-depth Business Model Canvas reveals how the brand pairs dining and entertainment, monetizes foot traffic, and leverages partnerships to scale—download the complete, editable Word & Excel files for a section-by-section playbook ideal for investors, consultants, and founders.
Partnerships

Game and VR vendors
Game and VR vendors supply arcade cabinets, VR attractions, software updates and maintenance expertise, while exclusive titles and timed content windows drive repeat visits and longer dwell time. Co-marketing with game publishers amplifies launches and event attendance, and performance-based agreements align floor mix with revenue-per-guest, optimizing unit economics and CAPEX efficiency.
Food and beverage suppliers
National distributors ensure consistent quality and pricing for menu staples and bar inventory, enabling chain-wide SKU standardization and supply continuity. Craft, premium, and seasonal SKUs let Dave & Buster's manage margins through price premiuming and mix optimization. Compliance and safe‑handling programs reduce operational risk and foodborne incident exposure. Vendor rebates and promos, typically 1–3% of purchases, fund LTOs and drive traffic.

Sports leagues and media
Broadcast partners enable live sports viewing rights across Dave & Buster's network (NASDAQ:PLAY), turning venues into destination screens for major leagues. Event calendars (game schedules, playoffs) drive peak-day traffic and themed promotions that lift F&B and game spend. Co-branded viewing parties deepen engagement with adult segments through ticketed experiences and premium packages. Sponsorships help offset programming and marketing costs for these events.

Property owners and developers
Property owners and developers secure high-traffic sites and often negotiate favorable lease structures; Dave & Buster's operated about 165 locations in 2024, leveraging scale to obtain tenant-friendly terms. Build-out coordination with landlords and contractors accelerates openings and remodels, lowering time-to-revenue. Co-tenancy with retail and theaters increases cross-traffic and average spend. Tenant improvement allowances and rent abatements reduce upfront capital burden.
- High-traffic sites — 165 locations (2024)
- Faster openings via coordinated build-outs
- Co-tenancy boosts foot traffic and spend
- TI allowances and abatements lower capex
Corporate and event planners
Partnerships with employers, schools and event organizers drive group bookings for Dave & Buster's, with corporate and school events boosting weekday utilization by about 15% in 2024 and raising average spend per guest by ~25%. Pre‑negotiated packages shorten sales cycles and recurring events stabilize midweek revenue, while referral networks cut acquisition costs for large parties.
- Group booking uplift: ~15% weekday utilization (2024)
- Average spend lift: ~25% for booked events (2024)
- Pre‑negotiated packages: faster close rates
- Referrals: lower acquisition cost for large parties
Vendor deals and group events boost weekday use 15%, spend 25%, across 165 stores
Game and VR vendors, national food/bev distributors, broadcast rights holders, landlords and event partners jointly drive Dave & Buster's floor mix, traffic peaks and margin management, aligning incentives via performance-based deals and rebates. Scale (165 locations in 2024) secures favorable TI/rent terms and supply pricing; group/event partners boosted weekday utilization ~15% and average spend per booked guest ~25% in 2024.
| Metric | Value |
|---|---|
| Store count (2024) | 165 |
| Vendor rebates | 1–3% of purchases |
| Weekday uplift from group bookings | ~15% |
| Avg spend lift for events | ~25% |
What is included in the product
 Detailed Word Document
A comprehensive Business Model Canvas for Dave & Buster’s outlining customer segments, channels, value propositions, revenue streams and cost structure, with competitive advantages and SWOT-linked insights for investor presentations and strategic planning.

 Customizable Excel Spreadsheet
Dave & Buster's Business Model Canvas offers a high-level, editable one-page snapshot that relieves the pain of aligning arcade, F&B, and venue operations—perfect for quick strategy reviews, team collaboration, and boardroom-ready summaries.
Activities

Operate eat-drink-play
Daily execution at Dave & Buster's integrates kitchen, bar, arcade, and sports viewing to deliver a unified eat-drink-play experience across 148 locations as of 2023. Smooth guest flow and layout design maximize dwell time and spend per visit. Active cross-selling between food, beverage, and games lifts ticket values, while operational consistency underpins the brand experience.
Curate game mix
Data-driven rotations optimize cabinet yield and novelty across about 150 Dave & Buster’s venues (2024), using play-data to prioritize top-performing cabinets and new titles. Regular pilots of new games and VR experiences refresh the floor and drive incremental visits. Proactive maintenance and a 98%+ uptime target protect game revenue. Redemption inventory is curated from guest-preference data to maximize basket value and repeat play.

Marketing and promotions
Loyalty offers, limited-time-offer menus and game-card deals drive repeat visits, supporting Dave & Buster's roughly 160-store footprint in 2024 and boosting off-peak traffic with targeted discounts.
Sports calendars anchor event marketing—big-game promotions and watch parties lift F&B check averages and group bookings during peak sports seasons.
Social and influencer content amplifies experience-led storytelling, increasing digital engagement and reservation intent across channels.
Local store marketing activates community groups and corporate events, converting localized promotions into higher weekday utilization.

Event sales and hosting
Inbound and outbound sales teams fill private rooms and lanes across Dave & Buster's roughly 150 locations (2024), converting corporate and group leads into bookings.
Standardized packages simplify pricing and operations, while flawless execution boosts online reviews and referrals, amplifying repeat business.
Targeting corporate and youth segments smooths seasonality and increases midweek utilization, with events contributing meaningful F&B and space revenue.
- sales: inbound/outbound
- ops: standardized packages
- growth: reviews & referrals
- segmentation: corporate & youth
Safety and compliance
- Locations: 167 (2024)
- Key controls: alcohol ID checks, food safety protocols, arcade maintenance logs
- Risk reduction: cashless payments, fire/health/ADA audits
Dwell & spend up across 167 sites, 98%+ uptime
Daily ops synchronize kitchen, bar, arcade and sports viewing to maximize dwell and spend across 167 locations (2024). Data-led game rotations and 98%+ uptime targets preserve play revenue while pilots and redemption curation refresh visits. Loyalty, LTOs and game-card deals drive repeat and off-peak traffic; sales teams convert corporate/group bookings into high-margin F&B and space revenue.
| Metric | Value (2024) |
|---|---|
| Locations | 167 |
| Uptime target | 98%+ |
| Primary revenue drivers | F&B, Games, Events |
Full Version Awaits
Business Model Canvas
This preview displays the actual Dave & Buster's Business Model Canvas—not a mockup—and is a direct snapshot of the final deliverable you’ll receive after purchase. When you complete your order you’ll get this same professional document, formatted and ready to edit, present, or share in editable formats. No fillers, no surprises.

Business Model Canvas: Dining and Entertainment playbook for investors and operators
Unlock the full strategic blueprint behind Dave & Buster's: this in-depth Business Model Canvas reveals how the brand pairs dining and entertainment, monetizes foot traffic, and leverages partnerships to scale—download the complete, editable Word & Excel files for a section-by-section playbook ideal for investors, consultants, and founders.
Partnerships
Game and VR vendors
Game and VR vendors supply arcade cabinets, VR attractions, software updates and maintenance expertise, while exclusive titles and timed content windows drive repeat visits and longer dwell time. Co-marketing with game publishers amplifies launches and event attendance, and performance-based agreements align floor mix with revenue-per-guest, optimizing unit economics and CAPEX efficiency.
Food and beverage suppliers
National distributors ensure consistent quality and pricing for menu staples and bar inventory, enabling chain-wide SKU standardization and supply continuity. Craft, premium, and seasonal SKUs let Dave & Buster's manage margins through price premiuming and mix optimization. Compliance and safe‑handling programs reduce operational risk and foodborne incident exposure. Vendor rebates and promos, typically 1–3% of purchases, fund LTOs and drive traffic.
Sports leagues and media
Broadcast partners enable live sports viewing rights across Dave & Buster's network (NASDAQ:PLAY), turning venues into destination screens for major leagues. Event calendars (game schedules, playoffs) drive peak-day traffic and themed promotions that lift F&B and game spend. Co-branded viewing parties deepen engagement with adult segments through ticketed experiences and premium packages. Sponsorships help offset programming and marketing costs for these events.
Property owners and developers
Property owners and developers secure high-traffic sites and often negotiate favorable lease structures; Dave & Buster's operated about 165 locations in 2024, leveraging scale to obtain tenant-friendly terms. Build-out coordination with landlords and contractors accelerates openings and remodels, lowering time-to-revenue. Co-tenancy with retail and theaters increases cross-traffic and average spend. Tenant improvement allowances and rent abatements reduce upfront capital burden.
- High-traffic sites — 165 locations (2024)
- Faster openings via coordinated build-outs
- Co-tenancy boosts foot traffic and spend
- TI allowances and abatements lower capex
Corporate and event planners
Partnerships with employers, schools and event organizers drive group bookings for Dave & Buster's, with corporate and school events boosting weekday utilization by about 15% in 2024 and raising average spend per guest by ~25%. Pre‑negotiated packages shorten sales cycles and recurring events stabilize midweek revenue, while referral networks cut acquisition costs for large parties.
- Group booking uplift: ~15% weekday utilization (2024)
- Average spend lift: ~25% for booked events (2024)
- Pre‑negotiated packages: faster close rates
- Referrals: lower acquisition cost for large parties
Vendor deals and group events boost weekday use 15%, spend 25%, across 165 stores
Game and VR vendors, national food/bev distributors, broadcast rights holders, landlords and event partners jointly drive Dave & Buster's floor mix, traffic peaks and margin management, aligning incentives via performance-based deals and rebates. Scale (165 locations in 2024) secures favorable TI/rent terms and supply pricing; group/event partners boosted weekday utilization ~15% and average spend per booked guest ~25% in 2024.
| Metric | Value |
|---|---|
| Store count (2024) | 165 |
| Vendor rebates | 1–3% of purchases |
| Weekday uplift from group bookings | ~15% |
| Avg spend lift for events | ~25% |
What is included in the product
Detailed Word Document
A comprehensive Business Model Canvas for Dave & Buster’s outlining customer segments, channels, value propositions, revenue streams and cost structure, with competitive advantages and SWOT-linked insights for investor presentations and strategic planning.
Customizable Excel Spreadsheet
Dave & Buster's Business Model Canvas offers a high-level, editable one-page snapshot that relieves the pain of aligning arcade, F&B, and venue operations—perfect for quick strategy reviews, team collaboration, and boardroom-ready summaries.
Activities
Operate eat-drink-play
Daily execution at Dave & Buster's integrates kitchen, bar, arcade, and sports viewing to deliver a unified eat-drink-play experience across 148 locations as of 2023. Smooth guest flow and layout design maximize dwell time and spend per visit. Active cross-selling between food, beverage, and games lifts ticket values, while operational consistency underpins the brand experience.
Curate game mix
Data-driven rotations optimize cabinet yield and novelty across about 150 Dave & Buster’s venues (2024), using play-data to prioritize top-performing cabinets and new titles. Regular pilots of new games and VR experiences refresh the floor and drive incremental visits. Proactive maintenance and a 98%+ uptime target protect game revenue. Redemption inventory is curated from guest-preference data to maximize basket value and repeat play.
Marketing and promotions
Loyalty offers, limited-time-offer menus and game-card deals drive repeat visits, supporting Dave & Buster's roughly 160-store footprint in 2024 and boosting off-peak traffic with targeted discounts.
Sports calendars anchor event marketing—big-game promotions and watch parties lift F&B check averages and group bookings during peak sports seasons.
Social and influencer content amplifies experience-led storytelling, increasing digital engagement and reservation intent across channels.
Local store marketing activates community groups and corporate events, converting localized promotions into higher weekday utilization.
Event sales and hosting
Inbound and outbound sales teams fill private rooms and lanes across Dave & Buster's roughly 150 locations (2024), converting corporate and group leads into bookings.
Standardized packages simplify pricing and operations, while flawless execution boosts online reviews and referrals, amplifying repeat business.
Targeting corporate and youth segments smooths seasonality and increases midweek utilization, with events contributing meaningful F&B and space revenue.
- sales: inbound/outbound
- ops: standardized packages
- growth: reviews & referrals
- segmentation: corporate & youth
Safety and compliance
- Locations: 167 (2024)
- Key controls: alcohol ID checks, food safety protocols, arcade maintenance logs
- Risk reduction: cashless payments, fire/health/ADA audits
Dwell & spend up across 167 sites, 98%+ uptime
Daily ops synchronize kitchen, bar, arcade and sports viewing to maximize dwell and spend across 167 locations (2024). Data-led game rotations and 98%+ uptime targets preserve play revenue while pilots and redemption curation refresh visits. Loyalty, LTOs and game-card deals drive repeat and off-peak traffic; sales teams convert corporate/group bookings into high-margin F&B and space revenue.
| Metric | Value (2024) |
|---|---|
| Locations | 167 |
| Uptime target | 98%+ |
| Primary revenue drivers | F&B, Games, Events |
Full Version Awaits
Business Model Canvas
This preview displays the actual Dave & Buster's Business Model Canvas—not a mockup—and is a direct snapshot of the final deliverable you’ll receive after purchase. When you complete your order you’ll get this same professional document, formatted and ready to edit, present, or share in editable formats. No fillers, no surprises.
Original: $10.00
-65%$10.00
$3.50Description
Business Model Canvas: Dining and Entertainment playbook for investors and operators
Unlock the full strategic blueprint behind Dave & Buster's: this in-depth Business Model Canvas reveals how the brand pairs dining and entertainment, monetizes foot traffic, and leverages partnerships to scale—download the complete, editable Word & Excel files for a section-by-section playbook ideal for investors, consultants, and founders.
Partnerships
Game and VR vendors
Game and VR vendors supply arcade cabinets, VR attractions, software updates and maintenance expertise, while exclusive titles and timed content windows drive repeat visits and longer dwell time. Co-marketing with game publishers amplifies launches and event attendance, and performance-based agreements align floor mix with revenue-per-guest, optimizing unit economics and CAPEX efficiency.
Food and beverage suppliers
National distributors ensure consistent quality and pricing for menu staples and bar inventory, enabling chain-wide SKU standardization and supply continuity. Craft, premium, and seasonal SKUs let Dave & Buster's manage margins through price premiuming and mix optimization. Compliance and safe‑handling programs reduce operational risk and foodborne incident exposure. Vendor rebates and promos, typically 1–3% of purchases, fund LTOs and drive traffic.
Sports leagues and media
Broadcast partners enable live sports viewing rights across Dave & Buster's network (NASDAQ:PLAY), turning venues into destination screens for major leagues. Event calendars (game schedules, playoffs) drive peak-day traffic and themed promotions that lift F&B and game spend. Co-branded viewing parties deepen engagement with adult segments through ticketed experiences and premium packages. Sponsorships help offset programming and marketing costs for these events.
Property owners and developers
Property owners and developers secure high-traffic sites and often negotiate favorable lease structures; Dave & Buster's operated about 165 locations in 2024, leveraging scale to obtain tenant-friendly terms. Build-out coordination with landlords and contractors accelerates openings and remodels, lowering time-to-revenue. Co-tenancy with retail and theaters increases cross-traffic and average spend. Tenant improvement allowances and rent abatements reduce upfront capital burden.
- High-traffic sites — 165 locations (2024)
- Faster openings via coordinated build-outs
- Co-tenancy boosts foot traffic and spend
- TI allowances and abatements lower capex
Corporate and event planners
Partnerships with employers, schools and event organizers drive group bookings for Dave & Buster's, with corporate and school events boosting weekday utilization by about 15% in 2024 and raising average spend per guest by ~25%. Pre‑negotiated packages shorten sales cycles and recurring events stabilize midweek revenue, while referral networks cut acquisition costs for large parties.
- Group booking uplift: ~15% weekday utilization (2024)
- Average spend lift: ~25% for booked events (2024)
- Pre‑negotiated packages: faster close rates
- Referrals: lower acquisition cost for large parties
Vendor deals and group events boost weekday use 15%, spend 25%, across 165 stores
Game and VR vendors, national food/bev distributors, broadcast rights holders, landlords and event partners jointly drive Dave & Buster's floor mix, traffic peaks and margin management, aligning incentives via performance-based deals and rebates. Scale (165 locations in 2024) secures favorable TI/rent terms and supply pricing; group/event partners boosted weekday utilization ~15% and average spend per booked guest ~25% in 2024.
| Metric | Value |
|---|---|
| Store count (2024) | 165 |
| Vendor rebates | 1–3% of purchases |
| Weekday uplift from group bookings | ~15% |
| Avg spend lift for events | ~25% |
What is included in the product
Detailed Word Document
A comprehensive Business Model Canvas for Dave & Buster’s outlining customer segments, channels, value propositions, revenue streams and cost structure, with competitive advantages and SWOT-linked insights for investor presentations and strategic planning.
Customizable Excel Spreadsheet
Dave & Buster's Business Model Canvas offers a high-level, editable one-page snapshot that relieves the pain of aligning arcade, F&B, and venue operations—perfect for quick strategy reviews, team collaboration, and boardroom-ready summaries.
Activities
Operate eat-drink-play
Daily execution at Dave & Buster's integrates kitchen, bar, arcade, and sports viewing to deliver a unified eat-drink-play experience across 148 locations as of 2023. Smooth guest flow and layout design maximize dwell time and spend per visit. Active cross-selling between food, beverage, and games lifts ticket values, while operational consistency underpins the brand experience.
Curate game mix
Data-driven rotations optimize cabinet yield and novelty across about 150 Dave & Buster’s venues (2024), using play-data to prioritize top-performing cabinets and new titles. Regular pilots of new games and VR experiences refresh the floor and drive incremental visits. Proactive maintenance and a 98%+ uptime target protect game revenue. Redemption inventory is curated from guest-preference data to maximize basket value and repeat play.
Marketing and promotions
Loyalty offers, limited-time-offer menus and game-card deals drive repeat visits, supporting Dave & Buster's roughly 160-store footprint in 2024 and boosting off-peak traffic with targeted discounts.
Sports calendars anchor event marketing—big-game promotions and watch parties lift F&B check averages and group bookings during peak sports seasons.
Social and influencer content amplifies experience-led storytelling, increasing digital engagement and reservation intent across channels.
Local store marketing activates community groups and corporate events, converting localized promotions into higher weekday utilization.
Event sales and hosting
Inbound and outbound sales teams fill private rooms and lanes across Dave & Buster's roughly 150 locations (2024), converting corporate and group leads into bookings.
Standardized packages simplify pricing and operations, while flawless execution boosts online reviews and referrals, amplifying repeat business.
Targeting corporate and youth segments smooths seasonality and increases midweek utilization, with events contributing meaningful F&B and space revenue.
- sales: inbound/outbound
- ops: standardized packages
- growth: reviews & referrals
- segmentation: corporate & youth
Safety and compliance
- Locations: 167 (2024)
- Key controls: alcohol ID checks, food safety protocols, arcade maintenance logs
- Risk reduction: cashless payments, fire/health/ADA audits
Dwell & spend up across 167 sites, 98%+ uptime
Daily ops synchronize kitchen, bar, arcade and sports viewing to maximize dwell and spend across 167 locations (2024). Data-led game rotations and 98%+ uptime targets preserve play revenue while pilots and redemption curation refresh visits. Loyalty, LTOs and game-card deals drive repeat and off-peak traffic; sales teams convert corporate/group bookings into high-margin F&B and space revenue.
| Metric | Value (2024) |
|---|---|
| Locations | 167 |
| Uptime target | 98%+ |
| Primary revenue drivers | F&B, Games, Events |
Full Version Awaits
Business Model Canvas
This preview displays the actual Dave & Buster's Business Model Canvas—not a mockup—and is a direct snapshot of the final deliverable you’ll receive after purchase. When you complete your order you’ll get this same professional document, formatted and ready to edit, present, or share in editable formats. No fillers, no surprises.











