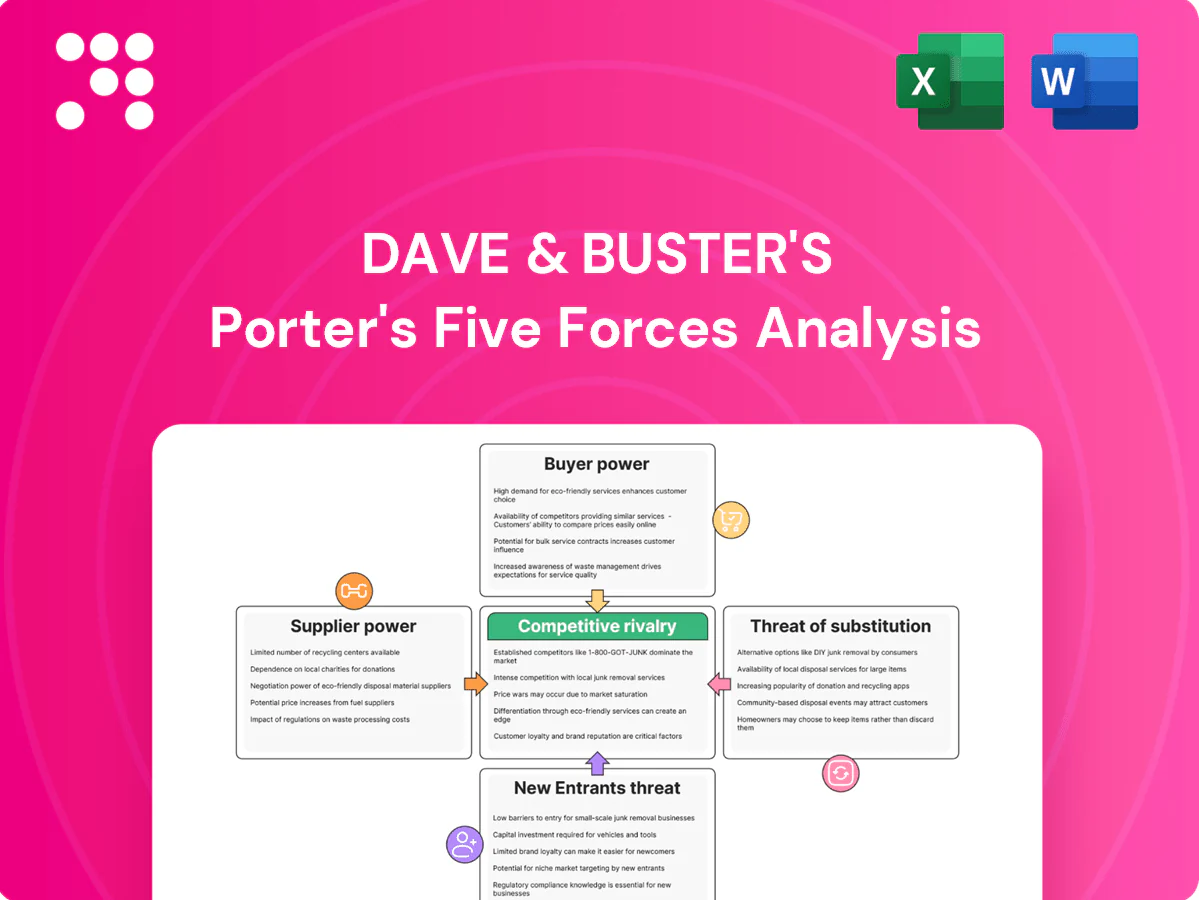
Dave & Buster's Porter's Five Forces Analysis

Go Beyond the Preview—Access the Full Strategic Report
Dave & Buster's faces moderate competitive rivalry from casual dining and entertainment venues, rising substitution risk from at-home gaming and streaming, and constrained supplier leverage due to standardized arcade equipment—while brand loyalty and scale mitigate new entrant threats. This snapshot only scratches the surface. Unlock the full Porter's Five Forces Analysis to explore Dave & Buster's competitive dynamics and strategic opportunities in detail.
Suppliers Bargaining Power

Concentrated arcade game vendors
Arcade cabinets and VR attractions are supplied by a small set of specialized manufacturers and licensors, limiting Dave & Buster’s vendor options and increasing reliance on a few partners. Proprietary content and long lead times raise switching costs and reduce D&B’s negotiating leverage. Multi-year content refresh cycles further entrench supplier power and can drive up acquisition and maintenance costs.
Alcohol distribution constraints
State three-tier alcohol systems, in place across all 50 US states as of 2024, restrict Dave & Buster's sourcing flexibility by mandating use of distributors rather than direct procurement. Brand portfolios are concentrated among large suppliers—Anheuser-Busch, Molson Coors, Constellation Brands—giving them leverage on pricing and placement. Complex compliance and licensing requirements raise switching costs. Volume rebates provide offsetting discounts but tie favorable terms to scale.

Food commodity volatility
Food commodity volatility remains high: corn, wheat and oilseed futures showed year-over-year swings exceeding 20% in 2023–24, pressuring protein, wheat and cooking-oil costs for Dave & Buster's. Broad distributor networks limit single-supplier power, but branded items and strict quality specs constrain substitution. Contracting and hedging reduce but do not eliminate exposure. Active menu engineering and price mix management are essential countermeasures.

Technology and payments dependence
- 156 venues (2024)
- Integrated POS/arcade systems increase switching friction
- Card fees ~2–3% of sales
- Outages/vendor changes cause direct revenue disruption
- Vendors can push maintenance/upgrade fees
Real estate and utilities
Dave & Buster's large-format sites (~40,000 sq ft) need high-traffic locations, limiting landlord options and increasing landlord leverage over rent escalators and tenant improvement concessions; energy-intensive operations add exposure to utility-rate volatility, with U.S. commercial electricity averaging about 16¢/kWh in 2024 (EIA); long leases (typically 10–20 years) lock in terms and reduce operational flexibility.
- Typical unit size: ~40,000 sq ft
- Leases: often 10–20 years
- U.S. commercial electricity: ~16¢/kWh (2024)
Supplier squeeze: 156 venues, 2–3% card fees, >20% commodity swings
Supplier power is moderate-high: specialized game licensors, POS/platform vendors and concentrated beer distributors limit options and raise switching costs for D&B’s 156 venues (2024). Food commodity swings >20% (2023–24) and card fees ~2–3% of sales pressure margins; long leases and large-format sites amplify vendor and utility dependence (~16¢/kWh, 2024).
| Metric | 2024 |
|---|---|
| Venues | 156 |
| Card fees | 2–3% sales |
| Electricity | 16¢/kWh |
| Commodity volatility | >20% YoY |
What is included in the product
 Detailed Word Document
Uncovers key drivers of competition, customer influence, and market entry risks for Dave & Buster's, detailing supplier/buyer power and substitute threats affecting pricing and profitability. Highlights disruptive forces, barriers to entry, and strategic levers to protect market share—fully editable for reports and decks.

 Customizable Excel Spreadsheet
A single-sheet Porter's Five Forces for Dave & Buster's—quickly spot competitive pressures and strategic levers to relieve pain points like declining foot traffic, rising food and entertainment costs, or supplier concentration.
Customers Bargaining Power

Low switching costs for guests
Low switching costs let guests choose bars, restaurants or nearby entertainment easily, pressing Dave & Buster's to compete on convenience and price; Dave & Buster's (NASDAQ: PLAY) operated about 152 locations and reported $2.06 billion revenue in fiscal 2023. Minimal contractual lock-in elevates price sensitivity, so promotions and local competitors materially sway traffic and per-guest spend. Loyalty programs improve retention but only partially offset churn.
Price–value scrutiny
Guests assess combined spend on food, drinks and game credits when choosing Dave & Buster's; perceived value versus alternatives like Topgolf or bowling directly shapes demand. Discounts, bundles and happy hours move price-sensitive visits and average check. With U.S. CPI up roughly 3.4% year-over-year in 2024, inflation has amplified sensitivity to total check size, increasing bargaining power of customers.

Group and corporate events influence
Large parties and corporate events give buyers leverage at Dave & Buster's because volume bookings can secure customized packages and priority access; Dave & Buster's operated 170+ locations in 2024, concentrating negotiation power at flagship sites. Seasonality—holidays and year-end team events—compresses demand into short windows, increasing buyer bargaining intensity. High service quality and reliable execution are critical to win repeat contracts and sustain group revenue.

Digital reputation effects
Online reviews and social media rapidly amplify service or pricing issues, with over 80% of consumers consulting reviews in 2024, increasing buyer power by enabling easy comparison across entertainment venues; negative sentiment can cut local foot traffic noticeably, forcing rapid remedial offers and responses to protect same-store sales. Timely responses and targeted discounts are necessary mitigants.
- Visibility boosts comparison power
- Negative sentiment shifts local demand
- Immediate responses/offers reduce churn
Diverse segments, varied expectations
Adults, families, and sports fans demand distinct mixes of food, gameplay, and broadcast quality, and Dave & Buster's scale—over 150 locations and roughly $2.1 billion revenue in FY2023—means segmented expectations materially affect perceived utility; menu breadth, game mix, and sports-viewing tech drive satisfaction, while failures in any pillar can spur defections to competitors or local alternatives.
- Segments: adults, families, sports fans
- Key drivers: menu breadth, game mix, viewing quality
- Scale: >150 locations; ~$2.1B revenue (FY2023)
- Risk: misses increase churn and reduce spend
Price-sensitive guests, reviews and promos drive traffic at ~152 locations
Low switching costs and minimal contractual lock-in make guests price-sensitive; PLAY operated ~152 locations and reported $2.06B revenue in FY2023, so promotions and local competitors heavily influence traffic. Online reviews (over 80% consult in 2024) and social media amplify complaints, raising buyer leverage. Large parties and corporate bookings exert negotiation power during peak seasons, while loyalty programs only partially curb churn.
| Metric | Value |
|---|---|
| Locations | ~152 (2024) |
| Revenue | $2.06B (FY2023) |
| U.S. CPI | ≈3.4% YoY (2024) |
| Review consult rate | >80% (2024) |
Full Version Awaits
Dave & Buster's Porter's Five Forces Analysis
This Porter’s Five Forces analysis of Dave & Buster’s examines industry rivalry, supplier and buyer power, threat of substitutes, and barriers to entry to assess competitive positioning. The preview you see is the exact, fully formatted document you’ll receive instantly after purchase. No samples or placeholders—what’s shown is what you download.

Go Beyond the Preview—Access the Full Strategic Report
Dave & Buster's faces moderate competitive rivalry from casual dining and entertainment venues, rising substitution risk from at-home gaming and streaming, and constrained supplier leverage due to standardized arcade equipment—while brand loyalty and scale mitigate new entrant threats. This snapshot only scratches the surface. Unlock the full Porter's Five Forces Analysis to explore Dave & Buster's competitive dynamics and strategic opportunities in detail.
Suppliers Bargaining Power
Concentrated arcade game vendors
Arcade cabinets and VR attractions are supplied by a small set of specialized manufacturers and licensors, limiting Dave & Buster’s vendor options and increasing reliance on a few partners. Proprietary content and long lead times raise switching costs and reduce D&B’s negotiating leverage. Multi-year content refresh cycles further entrench supplier power and can drive up acquisition and maintenance costs.
Alcohol distribution constraints
State three-tier alcohol systems, in place across all 50 US states as of 2024, restrict Dave & Buster's sourcing flexibility by mandating use of distributors rather than direct procurement. Brand portfolios are concentrated among large suppliers—Anheuser-Busch, Molson Coors, Constellation Brands—giving them leverage on pricing and placement. Complex compliance and licensing requirements raise switching costs. Volume rebates provide offsetting discounts but tie favorable terms to scale.
Food commodity volatility
Food commodity volatility remains high: corn, wheat and oilseed futures showed year-over-year swings exceeding 20% in 2023–24, pressuring protein, wheat and cooking-oil costs for Dave & Buster's. Broad distributor networks limit single-supplier power, but branded items and strict quality specs constrain substitution. Contracting and hedging reduce but do not eliminate exposure. Active menu engineering and price mix management are essential countermeasures.
Technology and payments dependence
- 156 venues (2024)
- Integrated POS/arcade systems increase switching friction
- Card fees ~2–3% of sales
- Outages/vendor changes cause direct revenue disruption
- Vendors can push maintenance/upgrade fees
Real estate and utilities
Dave & Buster's large-format sites (~40,000 sq ft) need high-traffic locations, limiting landlord options and increasing landlord leverage over rent escalators and tenant improvement concessions; energy-intensive operations add exposure to utility-rate volatility, with U.S. commercial electricity averaging about 16¢/kWh in 2024 (EIA); long leases (typically 10–20 years) lock in terms and reduce operational flexibility.
- Typical unit size: ~40,000 sq ft
- Leases: often 10–20 years
- U.S. commercial electricity: ~16¢/kWh (2024)
Supplier squeeze: 156 venues, 2–3% card fees, >20% commodity swings
Supplier power is moderate-high: specialized game licensors, POS/platform vendors and concentrated beer distributors limit options and raise switching costs for D&B’s 156 venues (2024). Food commodity swings >20% (2023–24) and card fees ~2–3% of sales pressure margins; long leases and large-format sites amplify vendor and utility dependence (~16¢/kWh, 2024).
| Metric | 2024 |
|---|---|
| Venues | 156 |
| Card fees | 2–3% sales |
| Electricity | 16¢/kWh |
| Commodity volatility | >20% YoY |
What is included in the product
Detailed Word Document
Uncovers key drivers of competition, customer influence, and market entry risks for Dave & Buster's, detailing supplier/buyer power and substitute threats affecting pricing and profitability. Highlights disruptive forces, barriers to entry, and strategic levers to protect market share—fully editable for reports and decks.
Customizable Excel Spreadsheet
A single-sheet Porter's Five Forces for Dave & Buster's—quickly spot competitive pressures and strategic levers to relieve pain points like declining foot traffic, rising food and entertainment costs, or supplier concentration.
Customers Bargaining Power
Low switching costs for guests
Low switching costs let guests choose bars, restaurants or nearby entertainment easily, pressing Dave & Buster's to compete on convenience and price; Dave & Buster's (NASDAQ: PLAY) operated about 152 locations and reported $2.06 billion revenue in fiscal 2023. Minimal contractual lock-in elevates price sensitivity, so promotions and local competitors materially sway traffic and per-guest spend. Loyalty programs improve retention but only partially offset churn.
Price–value scrutiny
Guests assess combined spend on food, drinks and game credits when choosing Dave & Buster's; perceived value versus alternatives like Topgolf or bowling directly shapes demand. Discounts, bundles and happy hours move price-sensitive visits and average check. With U.S. CPI up roughly 3.4% year-over-year in 2024, inflation has amplified sensitivity to total check size, increasing bargaining power of customers.
Group and corporate events influence
Large parties and corporate events give buyers leverage at Dave & Buster's because volume bookings can secure customized packages and priority access; Dave & Buster's operated 170+ locations in 2024, concentrating negotiation power at flagship sites. Seasonality—holidays and year-end team events—compresses demand into short windows, increasing buyer bargaining intensity. High service quality and reliable execution are critical to win repeat contracts and sustain group revenue.
Digital reputation effects
Online reviews and social media rapidly amplify service or pricing issues, with over 80% of consumers consulting reviews in 2024, increasing buyer power by enabling easy comparison across entertainment venues; negative sentiment can cut local foot traffic noticeably, forcing rapid remedial offers and responses to protect same-store sales. Timely responses and targeted discounts are necessary mitigants.
- Visibility boosts comparison power
- Negative sentiment shifts local demand
- Immediate responses/offers reduce churn
Diverse segments, varied expectations
Adults, families, and sports fans demand distinct mixes of food, gameplay, and broadcast quality, and Dave & Buster's scale—over 150 locations and roughly $2.1 billion revenue in FY2023—means segmented expectations materially affect perceived utility; menu breadth, game mix, and sports-viewing tech drive satisfaction, while failures in any pillar can spur defections to competitors or local alternatives.
- Segments: adults, families, sports fans
- Key drivers: menu breadth, game mix, viewing quality
- Scale: >150 locations; ~$2.1B revenue (FY2023)
- Risk: misses increase churn and reduce spend
Price-sensitive guests, reviews and promos drive traffic at ~152 locations
Low switching costs and minimal contractual lock-in make guests price-sensitive; PLAY operated ~152 locations and reported $2.06B revenue in FY2023, so promotions and local competitors heavily influence traffic. Online reviews (over 80% consult in 2024) and social media amplify complaints, raising buyer leverage. Large parties and corporate bookings exert negotiation power during peak seasons, while loyalty programs only partially curb churn.
| Metric | Value |
|---|---|
| Locations | ~152 (2024) |
| Revenue | $2.06B (FY2023) |
| U.S. CPI | ≈3.4% YoY (2024) |
| Review consult rate | >80% (2024) |
Full Version Awaits
Dave & Buster's Porter's Five Forces Analysis
This Porter’s Five Forces analysis of Dave & Buster’s examines industry rivalry, supplier and buyer power, threat of substitutes, and barriers to entry to assess competitive positioning. The preview you see is the exact, fully formatted document you’ll receive instantly after purchase. No samples or placeholders—what’s shown is what you download.
Description
Go Beyond the Preview—Access the Full Strategic Report
Dave & Buster's faces moderate competitive rivalry from casual dining and entertainment venues, rising substitution risk from at-home gaming and streaming, and constrained supplier leverage due to standardized arcade equipment—while brand loyalty and scale mitigate new entrant threats. This snapshot only scratches the surface. Unlock the full Porter's Five Forces Analysis to explore Dave & Buster's competitive dynamics and strategic opportunities in detail.
Suppliers Bargaining Power
Concentrated arcade game vendors
Arcade cabinets and VR attractions are supplied by a small set of specialized manufacturers and licensors, limiting Dave & Buster’s vendor options and increasing reliance on a few partners. Proprietary content and long lead times raise switching costs and reduce D&B’s negotiating leverage. Multi-year content refresh cycles further entrench supplier power and can drive up acquisition and maintenance costs.
Alcohol distribution constraints
State three-tier alcohol systems, in place across all 50 US states as of 2024, restrict Dave & Buster's sourcing flexibility by mandating use of distributors rather than direct procurement. Brand portfolios are concentrated among large suppliers—Anheuser-Busch, Molson Coors, Constellation Brands—giving them leverage on pricing and placement. Complex compliance and licensing requirements raise switching costs. Volume rebates provide offsetting discounts but tie favorable terms to scale.
Food commodity volatility
Food commodity volatility remains high: corn, wheat and oilseed futures showed year-over-year swings exceeding 20% in 2023–24, pressuring protein, wheat and cooking-oil costs for Dave & Buster's. Broad distributor networks limit single-supplier power, but branded items and strict quality specs constrain substitution. Contracting and hedging reduce but do not eliminate exposure. Active menu engineering and price mix management are essential countermeasures.
Technology and payments dependence
- 156 venues (2024)
- Integrated POS/arcade systems increase switching friction
- Card fees ~2–3% of sales
- Outages/vendor changes cause direct revenue disruption
- Vendors can push maintenance/upgrade fees
Real estate and utilities
Dave & Buster's large-format sites (~40,000 sq ft) need high-traffic locations, limiting landlord options and increasing landlord leverage over rent escalators and tenant improvement concessions; energy-intensive operations add exposure to utility-rate volatility, with U.S. commercial electricity averaging about 16¢/kWh in 2024 (EIA); long leases (typically 10–20 years) lock in terms and reduce operational flexibility.
- Typical unit size: ~40,000 sq ft
- Leases: often 10–20 years
- U.S. commercial electricity: ~16¢/kWh (2024)
Supplier squeeze: 156 venues, 2–3% card fees, >20% commodity swings
Supplier power is moderate-high: specialized game licensors, POS/platform vendors and concentrated beer distributors limit options and raise switching costs for D&B’s 156 venues (2024). Food commodity swings >20% (2023–24) and card fees ~2–3% of sales pressure margins; long leases and large-format sites amplify vendor and utility dependence (~16¢/kWh, 2024).
| Metric | 2024 |
|---|---|
| Venues | 156 |
| Card fees | 2–3% sales |
| Electricity | 16¢/kWh |
| Commodity volatility | >20% YoY |
What is included in the product
Detailed Word Document
Uncovers key drivers of competition, customer influence, and market entry risks for Dave & Buster's, detailing supplier/buyer power and substitute threats affecting pricing and profitability. Highlights disruptive forces, barriers to entry, and strategic levers to protect market share—fully editable for reports and decks.
Customizable Excel Spreadsheet
A single-sheet Porter's Five Forces for Dave & Buster's—quickly spot competitive pressures and strategic levers to relieve pain points like declining foot traffic, rising food and entertainment costs, or supplier concentration.
Customers Bargaining Power
Low switching costs for guests
Low switching costs let guests choose bars, restaurants or nearby entertainment easily, pressing Dave & Buster's to compete on convenience and price; Dave & Buster's (NASDAQ: PLAY) operated about 152 locations and reported $2.06 billion revenue in fiscal 2023. Minimal contractual lock-in elevates price sensitivity, so promotions and local competitors materially sway traffic and per-guest spend. Loyalty programs improve retention but only partially offset churn.
Price–value scrutiny
Guests assess combined spend on food, drinks and game credits when choosing Dave & Buster's; perceived value versus alternatives like Topgolf or bowling directly shapes demand. Discounts, bundles and happy hours move price-sensitive visits and average check. With U.S. CPI up roughly 3.4% year-over-year in 2024, inflation has amplified sensitivity to total check size, increasing bargaining power of customers.
Group and corporate events influence
Large parties and corporate events give buyers leverage at Dave & Buster's because volume bookings can secure customized packages and priority access; Dave & Buster's operated 170+ locations in 2024, concentrating negotiation power at flagship sites. Seasonality—holidays and year-end team events—compresses demand into short windows, increasing buyer bargaining intensity. High service quality and reliable execution are critical to win repeat contracts and sustain group revenue.
Digital reputation effects
Online reviews and social media rapidly amplify service or pricing issues, with over 80% of consumers consulting reviews in 2024, increasing buyer power by enabling easy comparison across entertainment venues; negative sentiment can cut local foot traffic noticeably, forcing rapid remedial offers and responses to protect same-store sales. Timely responses and targeted discounts are necessary mitigants.
- Visibility boosts comparison power
- Negative sentiment shifts local demand
- Immediate responses/offers reduce churn
Diverse segments, varied expectations
Adults, families, and sports fans demand distinct mixes of food, gameplay, and broadcast quality, and Dave & Buster's scale—over 150 locations and roughly $2.1 billion revenue in FY2023—means segmented expectations materially affect perceived utility; menu breadth, game mix, and sports-viewing tech drive satisfaction, while failures in any pillar can spur defections to competitors or local alternatives.
- Segments: adults, families, sports fans
- Key drivers: menu breadth, game mix, viewing quality
- Scale: >150 locations; ~$2.1B revenue (FY2023)
- Risk: misses increase churn and reduce spend
Price-sensitive guests, reviews and promos drive traffic at ~152 locations
Low switching costs and minimal contractual lock-in make guests price-sensitive; PLAY operated ~152 locations and reported $2.06B revenue in FY2023, so promotions and local competitors heavily influence traffic. Online reviews (over 80% consult in 2024) and social media amplify complaints, raising buyer leverage. Large parties and corporate bookings exert negotiation power during peak seasons, while loyalty programs only partially curb churn.
| Metric | Value |
|---|---|
| Locations | ~152 (2024) |
| Revenue | $2.06B (FY2023) |
| U.S. CPI | ≈3.4% YoY (2024) |
| Review consult rate | >80% (2024) |
Full Version Awaits
Dave & Buster's Porter's Five Forces Analysis
This Porter’s Five Forces analysis of Dave & Buster’s examines industry rivalry, supplier and buyer power, threat of substitutes, and barriers to entry to assess competitive positioning. The preview you see is the exact, fully formatted document you’ll receive instantly after purchase. No samples or placeholders—what’s shown is what you download.











