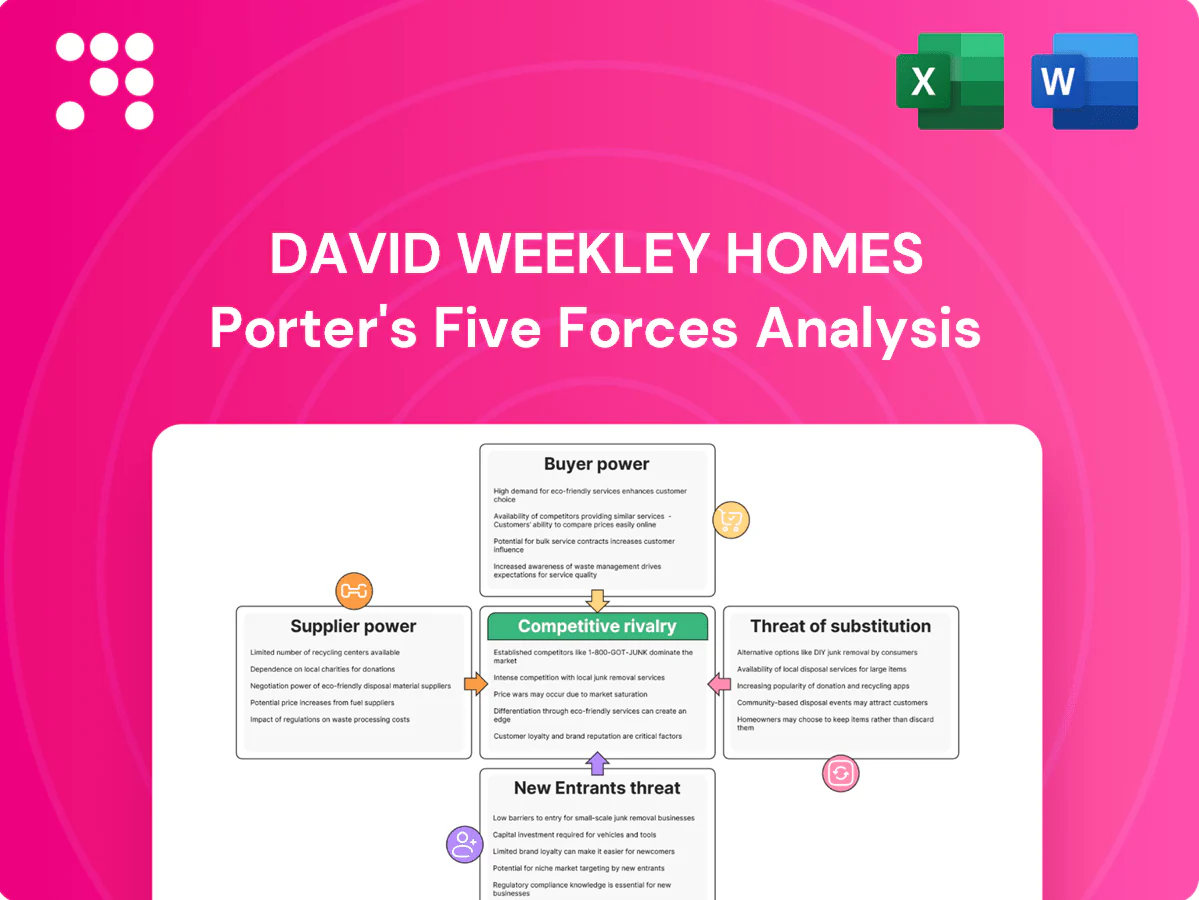
David Weekley Homes Porter's Five Forces Analysis

From Overview to Strategy Blueprint
David Weekley Homes faces varied competitive pressures—from concentrated suppliers and sophisticated buyers to regional rivals and evolving substitute offerings—shaping margins and growth prospects. This snapshot highlights key dynamics but only scratches the surface. Unlock the full Porter's Five Forces Analysis for force-by-force ratings, visuals, and actionable strategic insights.
Suppliers Bargaining Power

Material supplier concentration
Core inputs such as lumber, concrete, roofing, windows and HVAC are sourced from a relatively concentrated vendor base, raising switching costs and supplier leverage for David Weekley Homes. In 2024 NAHB noted persistent commodity price volatility that can quickly flow into build costs and compress margins. Long-term contracts and forward purchasing mitigate but do not eliminate exposure, while scale helps most with commodity buys; specialty items and cycle spikes still increase supplier power.
Skilled trade scarcity
Framers, electricians, plumbers and HVAC subs remain capacity-constrained in 2024, with industry surveys showing roughly 72% of builders reporting shortages for key trades; tight labor markets have pushed trade rates up materially and extended schedules, raising supplier leverage. Preferred trade networks secure priority but demand steady volume to maintain access. Stringent quality controls further shrink acceptable vendor pools, reinforcing supplier power.

Land developers and lot control
Access to finished lots in desirable master-planned communities is tightly mediated by dominant developers, who in 2024 left many metros with under six months of lot supply, strengthening their leverage. Competition for prime parcels pushes up lot prices and imposes longer tie-up terms. Option contracts mitigate builder risk but commonly include strict takedown schedules of 6–24 months. Limited entitled land near job hubs further amplifies upstream bargaining power.

Branded fixtures and codes
In 2024, tighter energy codes and buyer demand for smart-home features mean David Weekley increasingly specifies ENERGY STAR-certified windows, appliances, and branded smart systems, reducing approved alternatives and increasing supplier leverage. Integrated warranties and dealer service networks further lock choices; substituting brands can trigger redesign, lab testing, and permit/inspection delays that slow deliveries.
- Branded specs drive vendor power
- Fewer approved alternatives = higher leverage
- Warranty/service networks lock decisions
- Substitution causes redesign/testing/approval delays
Logistics and lead times
Supply-chain bottlenecks in 2024 — garage doors (8–20 weeks), transformers (20–52 weeks) and switchgear (12–36 weeks) — can halt construction, giving suppliers pricing and allocation leverage as extended lead times tighten supply. Builders must sequence work tightly and carry buffers, raising working capital needs and margin risk; geographic diversification only partially offsets systemic constraints.
- Lead times: garage doors 8–20 wks, transformers 20–52 wks, switchgear 12–36 wks
- Buffers raise working capital and margin pressure
- Extended lead times increase supplier leverage
- Geographic diversification ≈ partial mitigation
Suppliers tighten levers: 72% builders hit by shortages, long lead times
Suppliers exert high leverage: concentrated commodity vendors, 72% of builders reporting trade shortages in 2024, and under six months of prime lot supply raise switching costs and input price exposure. Extended lead times (garage doors 8–20 wks; transformers 20–52 wks; switchgear 12–36 wks) force higher working capital and sequencing risk. Branded specs, warranties and code-driven upgrades further entrench supplier power.
| Factor | 2024 Metric | Impact |
|---|---|---|
| Trade shortages | 72% builders | Higher rates, slower schedules |
| Lot supply | <6 months in many metros | Higher lot prices, stricter terms |
| Lead times | Garage 8–20 wks; Transformers 20–52 wks; Switchgear 12–36 wks | Stops builds, raises buffers |
What is included in the product
 Detailed Word Document
Tailored Porter's Five Forces analysis for David Weekley Homes that identifies competitive intensity, buyer and supplier power, threat of substitutes and new entrants, and highlights disruptive trends, regulatory and cost pressures affecting pricing, margins and growth prospects.

 Customizable Excel Spreadsheet
One-sheet Porter's Five Forces for David Weekley Homes—customizable pressure levels and instant spider chart visualization to clarify competitive threats and relieve strategic decision-making pain; easy to swap in your data and drop into decks for boardroom-ready insight.
Customers Bargaining Power

Price transparency
Price transparency lets buyers compare models, incentives, and specs across builders online, raising negotiating leverage. Transparent comps in the same community anchor expectations and intensify pressure on list prices. To convert buyers builders commonly offer upgrades or rate buydowns; with 30-year rates near 7% in 2024 this tactic is widespread. The result compresses base pricing and option margins for David Weekley Homes.
Mortgage rate sensitivity
Mortgage-rate sensitivity is high: Freddie Mac recorded a 2024 average 30-year fixed rate near 6.8%, which materially reduces affordability and shifts leverage to buyers. When rates climb sellers face paused demand and routine asks for concessions, buydowns and closing-cost credits. For example, a 4%→7% move can raise monthly payments by roughly 35–45%, and lender partnerships can soften but not eliminate buyer bargaining power.

Customization expectations
David Weekley’s flexible floor plans attract customization-seeking buyers who trade option value against cost; industry surveys in 2024 show a majority of new-home buyers prioritize personalization, strengthening buyer leverage. Buyers often push for design-center discounts or included upgrades, pressuring margins. Unique options reduce comparability and switching, keeping some loyalty. Tight scope management is essential to prevent margin erosion.

Service and warranty reputation
Word-of-mouth and online reviews amplify reputational risk, giving buyers leverage over David Weekley Homes; strong post-close service sets industry benchmarks competitors must meet. Buyers routinely negotiate extended warranties and pre-close fix lists, while high satisfaction reduces cancellations and price pushback.
- Reputation risk: online reviews empower buyers
- Post-close service = competitive benchmark
- Negotiation: extended warranties / fix lists
- High satisfaction lowers cancellations & price resistance
Switching costs and cancellations
Pre-close deposits for David Weekley align with 2024 industry norms of roughly 1–3% of contract value, meaningful enough to deter casual switching but not prohibitive, keeping switching costs moderate. A dense competitive footprint and abundant nearby alternatives elevate buyer clout. Strict, commercially standard contract terms and clear 2024-era build timelines and proactive communication reduce capricious cancellations and perceived risk of staying.
- deposit_range: 1–3% (2024 industry norm)
- buyer_clout: high due to many nearby alternatives
- cancellation_control: strict contracts + clear timelines cut cancellations
Rising rates (~6.8%) and 1–3% deposits spur buyer concessions and upgrade demand
Price transparency, 2024 30-year rate ~6.8% and 1–3% deposits give buyers high leverage; rate jumps (4%→7%) raise monthly payments ~40%, driving concessions. Personalization demand (majority of buyers) and strong online reviews increase requests for upgrades, buydowns, warranties, and compress margins.
| Metric | 2024 Value | Impact |
|---|---|---|
| 30-yr rate | ~6.8% | Reduces affordability, ↑buyer leverage |
| Deposits | 1–3% | Moderate switching cost |
| Payment sensitivity | ~+40% | More concessions requested |
Preview the Actual Deliverable
David Weekley Homes Porter's Five Forces Analysis
This preview shows the exact Porter's Five Forces analysis of David Weekley Homes you'll receive after purchase—no samples or placeholders. The document assesses supplier power, buyer power, threat of new entrants, substitute products, and industry rivalry. It's fully formatted, professionally written, and ready for immediate download and use.

From Overview to Strategy Blueprint
David Weekley Homes faces varied competitive pressures—from concentrated suppliers and sophisticated buyers to regional rivals and evolving substitute offerings—shaping margins and growth prospects. This snapshot highlights key dynamics but only scratches the surface. Unlock the full Porter's Five Forces Analysis for force-by-force ratings, visuals, and actionable strategic insights.
Suppliers Bargaining Power
Material supplier concentration
Core inputs such as lumber, concrete, roofing, windows and HVAC are sourced from a relatively concentrated vendor base, raising switching costs and supplier leverage for David Weekley Homes. In 2024 NAHB noted persistent commodity price volatility that can quickly flow into build costs and compress margins. Long-term contracts and forward purchasing mitigate but do not eliminate exposure, while scale helps most with commodity buys; specialty items and cycle spikes still increase supplier power.
Skilled trade scarcity
Framers, electricians, plumbers and HVAC subs remain capacity-constrained in 2024, with industry surveys showing roughly 72% of builders reporting shortages for key trades; tight labor markets have pushed trade rates up materially and extended schedules, raising supplier leverage. Preferred trade networks secure priority but demand steady volume to maintain access. Stringent quality controls further shrink acceptable vendor pools, reinforcing supplier power.
Land developers and lot control
Access to finished lots in desirable master-planned communities is tightly mediated by dominant developers, who in 2024 left many metros with under six months of lot supply, strengthening their leverage. Competition for prime parcels pushes up lot prices and imposes longer tie-up terms. Option contracts mitigate builder risk but commonly include strict takedown schedules of 6–24 months. Limited entitled land near job hubs further amplifies upstream bargaining power.
Branded fixtures and codes
In 2024, tighter energy codes and buyer demand for smart-home features mean David Weekley increasingly specifies ENERGY STAR-certified windows, appliances, and branded smart systems, reducing approved alternatives and increasing supplier leverage. Integrated warranties and dealer service networks further lock choices; substituting brands can trigger redesign, lab testing, and permit/inspection delays that slow deliveries.
- Branded specs drive vendor power
- Fewer approved alternatives = higher leverage
- Warranty/service networks lock decisions
- Substitution causes redesign/testing/approval delays
Logistics and lead times
Supply-chain bottlenecks in 2024 — garage doors (8–20 weeks), transformers (20–52 weeks) and switchgear (12–36 weeks) — can halt construction, giving suppliers pricing and allocation leverage as extended lead times tighten supply. Builders must sequence work tightly and carry buffers, raising working capital needs and margin risk; geographic diversification only partially offsets systemic constraints.
- Lead times: garage doors 8–20 wks, transformers 20–52 wks, switchgear 12–36 wks
- Buffers raise working capital and margin pressure
- Extended lead times increase supplier leverage
- Geographic diversification ≈ partial mitigation
Suppliers tighten levers: 72% builders hit by shortages, long lead times
Suppliers exert high leverage: concentrated commodity vendors, 72% of builders reporting trade shortages in 2024, and under six months of prime lot supply raise switching costs and input price exposure. Extended lead times (garage doors 8–20 wks; transformers 20–52 wks; switchgear 12–36 wks) force higher working capital and sequencing risk. Branded specs, warranties and code-driven upgrades further entrench supplier power.
| Factor | 2024 Metric | Impact |
|---|---|---|
| Trade shortages | 72% builders | Higher rates, slower schedules |
| Lot supply | <6 months in many metros | Higher lot prices, stricter terms |
| Lead times | Garage 8–20 wks; Transformers 20–52 wks; Switchgear 12–36 wks | Stops builds, raises buffers |
What is included in the product
Detailed Word Document
Tailored Porter's Five Forces analysis for David Weekley Homes that identifies competitive intensity, buyer and supplier power, threat of substitutes and new entrants, and highlights disruptive trends, regulatory and cost pressures affecting pricing, margins and growth prospects.
Customizable Excel Spreadsheet
One-sheet Porter's Five Forces for David Weekley Homes—customizable pressure levels and instant spider chart visualization to clarify competitive threats and relieve strategic decision-making pain; easy to swap in your data and drop into decks for boardroom-ready insight.
Customers Bargaining Power
Price transparency
Price transparency lets buyers compare models, incentives, and specs across builders online, raising negotiating leverage. Transparent comps in the same community anchor expectations and intensify pressure on list prices. To convert buyers builders commonly offer upgrades or rate buydowns; with 30-year rates near 7% in 2024 this tactic is widespread. The result compresses base pricing and option margins for David Weekley Homes.
Mortgage rate sensitivity
Mortgage-rate sensitivity is high: Freddie Mac recorded a 2024 average 30-year fixed rate near 6.8%, which materially reduces affordability and shifts leverage to buyers. When rates climb sellers face paused demand and routine asks for concessions, buydowns and closing-cost credits. For example, a 4%→7% move can raise monthly payments by roughly 35–45%, and lender partnerships can soften but not eliminate buyer bargaining power.
Customization expectations
David Weekley’s flexible floor plans attract customization-seeking buyers who trade option value against cost; industry surveys in 2024 show a majority of new-home buyers prioritize personalization, strengthening buyer leverage. Buyers often push for design-center discounts or included upgrades, pressuring margins. Unique options reduce comparability and switching, keeping some loyalty. Tight scope management is essential to prevent margin erosion.
Service and warranty reputation
Word-of-mouth and online reviews amplify reputational risk, giving buyers leverage over David Weekley Homes; strong post-close service sets industry benchmarks competitors must meet. Buyers routinely negotiate extended warranties and pre-close fix lists, while high satisfaction reduces cancellations and price pushback.
- Reputation risk: online reviews empower buyers
- Post-close service = competitive benchmark
- Negotiation: extended warranties / fix lists
- High satisfaction lowers cancellations & price resistance
Switching costs and cancellations
Pre-close deposits for David Weekley align with 2024 industry norms of roughly 1–3% of contract value, meaningful enough to deter casual switching but not prohibitive, keeping switching costs moderate. A dense competitive footprint and abundant nearby alternatives elevate buyer clout. Strict, commercially standard contract terms and clear 2024-era build timelines and proactive communication reduce capricious cancellations and perceived risk of staying.
- deposit_range: 1–3% (2024 industry norm)
- buyer_clout: high due to many nearby alternatives
- cancellation_control: strict contracts + clear timelines cut cancellations
Rising rates (~6.8%) and 1–3% deposits spur buyer concessions and upgrade demand
Price transparency, 2024 30-year rate ~6.8% and 1–3% deposits give buyers high leverage; rate jumps (4%→7%) raise monthly payments ~40%, driving concessions. Personalization demand (majority of buyers) and strong online reviews increase requests for upgrades, buydowns, warranties, and compress margins.
| Metric | 2024 Value | Impact |
|---|---|---|
| 30-yr rate | ~6.8% | Reduces affordability, ↑buyer leverage |
| Deposits | 1–3% | Moderate switching cost |
| Payment sensitivity | ~+40% | More concessions requested |
Preview the Actual Deliverable
David Weekley Homes Porter's Five Forces Analysis
This preview shows the exact Porter's Five Forces analysis of David Weekley Homes you'll receive after purchase—no samples or placeholders. The document assesses supplier power, buyer power, threat of new entrants, substitute products, and industry rivalry. It's fully formatted, professionally written, and ready for immediate download and use.
Original: $10.00
-65%$10.00
$3.50Description
From Overview to Strategy Blueprint
David Weekley Homes faces varied competitive pressures—from concentrated suppliers and sophisticated buyers to regional rivals and evolving substitute offerings—shaping margins and growth prospects. This snapshot highlights key dynamics but only scratches the surface. Unlock the full Porter's Five Forces Analysis for force-by-force ratings, visuals, and actionable strategic insights.
Suppliers Bargaining Power
Material supplier concentration
Core inputs such as lumber, concrete, roofing, windows and HVAC are sourced from a relatively concentrated vendor base, raising switching costs and supplier leverage for David Weekley Homes. In 2024 NAHB noted persistent commodity price volatility that can quickly flow into build costs and compress margins. Long-term contracts and forward purchasing mitigate but do not eliminate exposure, while scale helps most with commodity buys; specialty items and cycle spikes still increase supplier power.
Skilled trade scarcity
Framers, electricians, plumbers and HVAC subs remain capacity-constrained in 2024, with industry surveys showing roughly 72% of builders reporting shortages for key trades; tight labor markets have pushed trade rates up materially and extended schedules, raising supplier leverage. Preferred trade networks secure priority but demand steady volume to maintain access. Stringent quality controls further shrink acceptable vendor pools, reinforcing supplier power.
Land developers and lot control
Access to finished lots in desirable master-planned communities is tightly mediated by dominant developers, who in 2024 left many metros with under six months of lot supply, strengthening their leverage. Competition for prime parcels pushes up lot prices and imposes longer tie-up terms. Option contracts mitigate builder risk but commonly include strict takedown schedules of 6–24 months. Limited entitled land near job hubs further amplifies upstream bargaining power.
Branded fixtures and codes
In 2024, tighter energy codes and buyer demand for smart-home features mean David Weekley increasingly specifies ENERGY STAR-certified windows, appliances, and branded smart systems, reducing approved alternatives and increasing supplier leverage. Integrated warranties and dealer service networks further lock choices; substituting brands can trigger redesign, lab testing, and permit/inspection delays that slow deliveries.
- Branded specs drive vendor power
- Fewer approved alternatives = higher leverage
- Warranty/service networks lock decisions
- Substitution causes redesign/testing/approval delays
Logistics and lead times
Supply-chain bottlenecks in 2024 — garage doors (8–20 weeks), transformers (20–52 weeks) and switchgear (12–36 weeks) — can halt construction, giving suppliers pricing and allocation leverage as extended lead times tighten supply. Builders must sequence work tightly and carry buffers, raising working capital needs and margin risk; geographic diversification only partially offsets systemic constraints.
- Lead times: garage doors 8–20 wks, transformers 20–52 wks, switchgear 12–36 wks
- Buffers raise working capital and margin pressure
- Extended lead times increase supplier leverage
- Geographic diversification ≈ partial mitigation
Suppliers tighten levers: 72% builders hit by shortages, long lead times
Suppliers exert high leverage: concentrated commodity vendors, 72% of builders reporting trade shortages in 2024, and under six months of prime lot supply raise switching costs and input price exposure. Extended lead times (garage doors 8–20 wks; transformers 20–52 wks; switchgear 12–36 wks) force higher working capital and sequencing risk. Branded specs, warranties and code-driven upgrades further entrench supplier power.
| Factor | 2024 Metric | Impact |
|---|---|---|
| Trade shortages | 72% builders | Higher rates, slower schedules |
| Lot supply | <6 months in many metros | Higher lot prices, stricter terms |
| Lead times | Garage 8–20 wks; Transformers 20–52 wks; Switchgear 12–36 wks | Stops builds, raises buffers |
What is included in the product
Detailed Word Document
Tailored Porter's Five Forces analysis for David Weekley Homes that identifies competitive intensity, buyer and supplier power, threat of substitutes and new entrants, and highlights disruptive trends, regulatory and cost pressures affecting pricing, margins and growth prospects.
Customizable Excel Spreadsheet
One-sheet Porter's Five Forces for David Weekley Homes—customizable pressure levels and instant spider chart visualization to clarify competitive threats and relieve strategic decision-making pain; easy to swap in your data and drop into decks for boardroom-ready insight.
Customers Bargaining Power
Price transparency
Price transparency lets buyers compare models, incentives, and specs across builders online, raising negotiating leverage. Transparent comps in the same community anchor expectations and intensify pressure on list prices. To convert buyers builders commonly offer upgrades or rate buydowns; with 30-year rates near 7% in 2024 this tactic is widespread. The result compresses base pricing and option margins for David Weekley Homes.
Mortgage rate sensitivity
Mortgage-rate sensitivity is high: Freddie Mac recorded a 2024 average 30-year fixed rate near 6.8%, which materially reduces affordability and shifts leverage to buyers. When rates climb sellers face paused demand and routine asks for concessions, buydowns and closing-cost credits. For example, a 4%→7% move can raise monthly payments by roughly 35–45%, and lender partnerships can soften but not eliminate buyer bargaining power.
Customization expectations
David Weekley’s flexible floor plans attract customization-seeking buyers who trade option value against cost; industry surveys in 2024 show a majority of new-home buyers prioritize personalization, strengthening buyer leverage. Buyers often push for design-center discounts or included upgrades, pressuring margins. Unique options reduce comparability and switching, keeping some loyalty. Tight scope management is essential to prevent margin erosion.
Service and warranty reputation
Word-of-mouth and online reviews amplify reputational risk, giving buyers leverage over David Weekley Homes; strong post-close service sets industry benchmarks competitors must meet. Buyers routinely negotiate extended warranties and pre-close fix lists, while high satisfaction reduces cancellations and price pushback.
- Reputation risk: online reviews empower buyers
- Post-close service = competitive benchmark
- Negotiation: extended warranties / fix lists
- High satisfaction lowers cancellations & price resistance
Switching costs and cancellations
Pre-close deposits for David Weekley align with 2024 industry norms of roughly 1–3% of contract value, meaningful enough to deter casual switching but not prohibitive, keeping switching costs moderate. A dense competitive footprint and abundant nearby alternatives elevate buyer clout. Strict, commercially standard contract terms and clear 2024-era build timelines and proactive communication reduce capricious cancellations and perceived risk of staying.
- deposit_range: 1–3% (2024 industry norm)
- buyer_clout: high due to many nearby alternatives
- cancellation_control: strict contracts + clear timelines cut cancellations
Rising rates (~6.8%) and 1–3% deposits spur buyer concessions and upgrade demand
Price transparency, 2024 30-year rate ~6.8% and 1–3% deposits give buyers high leverage; rate jumps (4%→7%) raise monthly payments ~40%, driving concessions. Personalization demand (majority of buyers) and strong online reviews increase requests for upgrades, buydowns, warranties, and compress margins.
| Metric | 2024 Value | Impact |
|---|---|---|
| 30-yr rate | ~6.8% | Reduces affordability, ↑buyer leverage |
| Deposits | 1–3% | Moderate switching cost |
| Payment sensitivity | ~+40% | More concessions requested |
Preview the Actual Deliverable
David Weekley Homes Porter's Five Forces Analysis
This preview shows the exact Porter's Five Forces analysis of David Weekley Homes you'll receive after purchase—no samples or placeholders. The document assesses supplier power, buyer power, threat of new entrants, substitute products, and industry rivalry. It's fully formatted, professionally written, and ready for immediate download and use.











