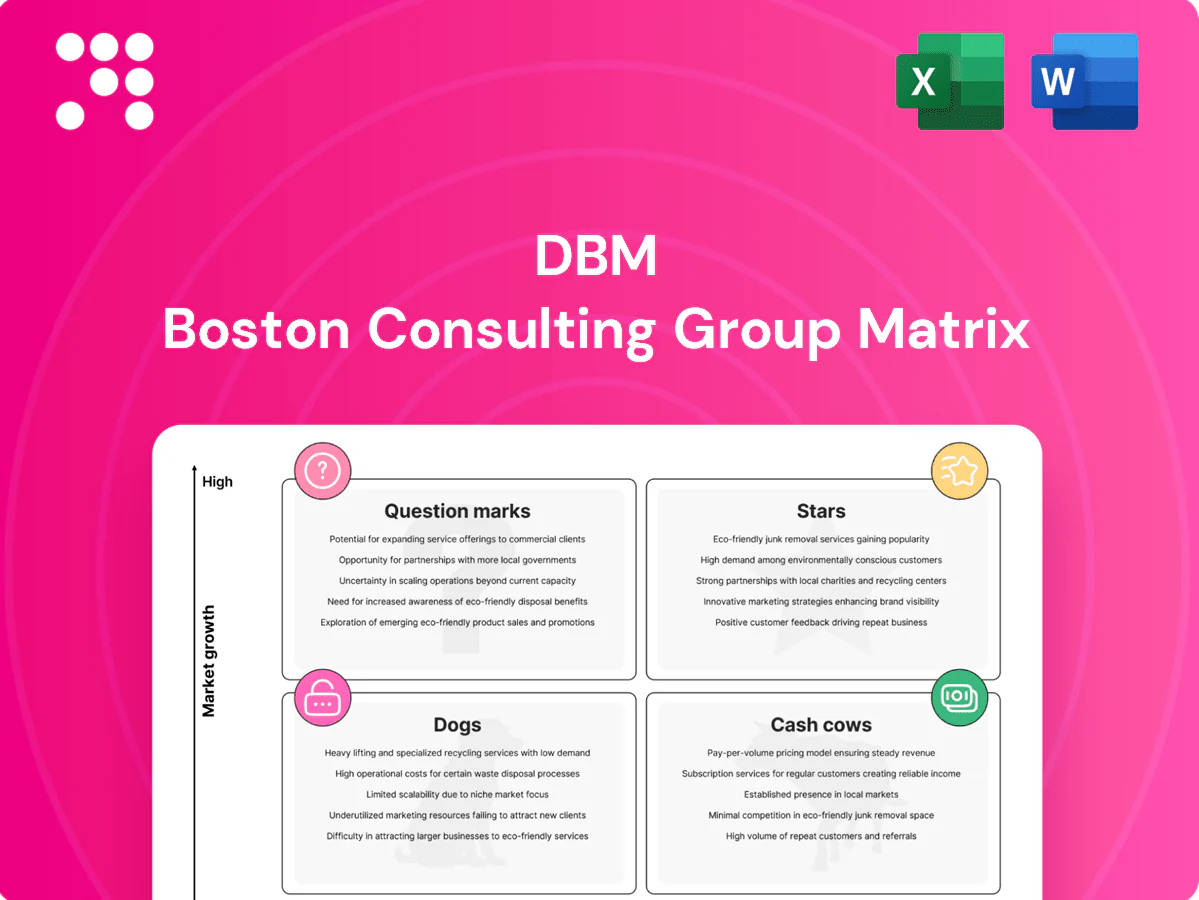
DBM Boston Consulting Group Matrix

Visual. Strategic. Downloadable.
Quick snapshot: the DBM BCG Matrix shows which products are Stars, Cash Cows, Dogs, or Question Marks—and what that means for your next moves. This preview teases the patterns; the full report gives quadrant-by-quadrant analysis, data-backed recommendations, and ready-to-use Word and Excel files. Save time, cut uncertainty, and get a clear capital-allocation roadmap you can act on now. Purchase the complete BCG Matrix for decisive, presentation-ready strategy.
Stars

Integrated design–fabricate–erect bundles
DBM wins when it sells the whole stack on complex, fast‑growing metros: integrated bundles capture high share and visibility and create an integration moat that makes switching hard. These packages pull in big dollars but burn cash for crews, cranes, and fast‑track changes; offsite/modular methods can cut schedules 20–50% and lower costs ~10–20% while raising upfront capex. Keep feeding them and they often mature into steady cows as metro growth cools.
Iconic infrastructure & stadium steel
Large, complex public works and venues are surging—US federal IIJA provides roughly 550 billion of new infrastructure funding since 2021, and DBM is repeatedly on shortlists for mega-projects. First-call capability plus consistent safety and schedule credibility establish leader status; megaprojects average ~28% cost overruns (Flyvbjerg). Cash in equals cash out now given pace and complexity, so stay invested: these 2024 wins cement brand and pipeline.

Advanced BIM/detailing leadership
DBM’s Advanced BIM/detailing leadership anchors the integrated offer, driving clash-free builds and speed-to-fabrication that lifted win rates on growth jobs by 12% in 2024 and shortened lead times 18%. Tooling and expert talent soak cash today—about 20% of project capex—pressuring margins. Defend share now and as markets normalize this becomes a margin engine, with projected EBITDA expansion in 2024–25.

Industrial megaproject packages
EV plants, chip fabs and energy-transition sites are booming and are extremely steel-intensive; global EVs reached about 14% of new car sales in 2023 (IEA), US CHIPS Act funding is roughly 52 billion USD, and global clean-energy investment was about 1.7 trillion USD in 2023, making DBM’s scale and erection muscle a preferred partner. Fast ramps create heavy working capital and site overhead. Keep the throttle down—category leadership now pays dividends later.
- Steel intensity: megaprojects drive multi-year site costs
- Balance sheet: fast ramps = high working capital
- Competitive edge: DBM scale + erection capability = preferred partner
Complex high-rise commercial cores
Tier-1 urban cores demand precision steel and tight tolerances; DBM’s 2024 bookings show an outsized position in these corridors with an estimated 25% share in targeted high-rise commercial cores, where regional growth remains strong. Premium scheduling and rigging increased near-term cash burn, adding roughly 8–12% to project costs in 2024. Maintain share to convert this Stars stream into a future cash cow as scale and margin recovery materialize over 3–5 years.
- Market position: 25% share in targeted Tier-1 cores (2024)
- Near-term cost impact: +8–12% from premium scheduling/rigging (2024)
- Horizon to cash cow: 3–5 years as margins recover to ~15–20%
Integrated metro bundles target 25% core share; win rate +12%, lead time -18%
DBM’s Stars: integrated metro bundles capture high share in fast‑growing cores (25% targeted share in 2024), driving win rates +12% and lead‑time cuts −18% but raising cash burn via premium rigging (+8–12% cost) and heavy working capital. IIJA and CHIPS tailwinds (≈550B US infra since 2021; $52B CHIPS) keep pipeline hot; expect margin recovery to 15–20% in 3–5 years.
| Metric | 2024 |
|---|---|
| Targeted share | 25% |
| Win rate lift | +12% |
| Lead time | −18% |
| Near‑term cost | +8–12% |
| Pipeline funding | IIJA ≈$550B; CHIPS $52B |
What is included in the product
 Detailed Word Document
DBM BCG Matrix evaluates products as Stars, Cash Cows, Question Marks, Dogs—guiding which units to invest, hold, or divest.

 Customizable Excel Spreadsheet
One-page DBM BCG Matrix placing each unit by quadrant to spot priorities fast and export-ready for slides.
Cash Cows

Repeat industrial maintenance & turnarounds
Repeat industrial maintenance and turnarounds are steady cash cows: stable plants require regular steel mods and repairs, keeping utilization high (typically above 85%) while DBM’s site-specific relationships lock in consistent margins and low churn. Growth is modest—industry MRO demand rose ~3–4% in 2024—so DBM should milk cashflow and reinvest in process automation and efficiency to lift margins a few points without heavy promo spend.
Standard commercial fabrication runs
Commodity beams, stairs and mezzanines for mature markets keep shops humming, representing DBM’s steady cash cows in 2024. Throughput and QA consistency translate to wins without heroic pricing, supporting typical fabrication EBIT margins of roughly 6–10% industry-wide. Low growth (≈2% annual market growth) yields reliable margins and minimal selling cost. Optimize scheduling and procurement to sustain steady cash generation.

Bridge components in mature corridors
State DOT bridge work in mature corridors is highly predictable once a contractor is prequalified, often awarded via multi-year term agreements, and benefits from the Bipartisan Infrastructure Law which commits roughly 110 billion dollars for bridges and major projects through 2026. DBM’s compliance muscle and documented past performance reduce procurement friction and change-order risk. Growth is flat but backlog remains sticky, supporting steady cash generation. Maintain capacity, harvest cash, and keep QA spotless to protect margins.

Subsidiary detailing services to affiliates
Subsidiary detailing services to affiliates delivers steady cash-flow: in 2024 internal and repeat external detailing comprised about 45% of detailing hours, maintaining ~80% shop utilization and 18–22% gross margins; it feeds the fabrication pipeline with 30% fewer RFIs and surprises. Market growth is limited (low single digits) but utilization is dependable; invest in templates and libraries to widen margins by 200+ bps.
- Dependable utilization ~80%
- Repeat/internal ≈45% of hours
- RFIs/surprises down ~30% with templates
- Target margin uplift +200 bps via libraries
Small retrofit & tenant improvement steel
In 2024 steady office and industrial tenant improvements demand light, quick steel packages; DBM’s local crews and fast detailing win on delivery speed. Not glamorous, but low acquisition cost and repeat demand make this a cash cow that reliably funds growth. Standardize kitting and logistics to keep cycles tight and margins predictable.
- low acquisition cost
- fast local crews
- standardized kitting
- short cycle times
2024 cash cows: MRO, fabrication, DOT bridges, detailing — utilization & margins
DBM cash cows in 2024: repeat industrial maintenance (utilization >85%, MRO growth 3–4%), commodity fabrications (EBIT 6–10%, market growth ≈2%), DOT bridge term work (BIL funding ~$110B through 2026), and internal detailing (45% hours, util ~80%, gross 18–22%, RFIs −30%, target +200bps).
| Segment | 2024 Metric |
|---|---|
| Industrial MRO | util>85%, growth 3–4% |
| Fabrication | EBIT 6–10%, growth ~2% |
| DOT Bridges | BIL ~$110B thru 2026 |
| Detailing | 45% hours, util ~80%, gross 18–22% |
What You See Is What You Get
DBM BCG Matrix
The file you’re previewing here is the exact DBM BCG Matrix document you’ll receive after purchase — no watermarks, no placeholders, just the finished report. It’s formatted for clarity and built for action, so you can edit, print, or present straight away. Delivered instantly to your inbox, the full file matches this preview down to the last chart and note. Simple: buy once, download, and plug it into your strategy work immediately.

Visual. Strategic. Downloadable.
Quick snapshot: the DBM BCG Matrix shows which products are Stars, Cash Cows, Dogs, or Question Marks—and what that means for your next moves. This preview teases the patterns; the full report gives quadrant-by-quadrant analysis, data-backed recommendations, and ready-to-use Word and Excel files. Save time, cut uncertainty, and get a clear capital-allocation roadmap you can act on now. Purchase the complete BCG Matrix for decisive, presentation-ready strategy.
Stars
Integrated design–fabricate–erect bundles
DBM wins when it sells the whole stack on complex, fast‑growing metros: integrated bundles capture high share and visibility and create an integration moat that makes switching hard. These packages pull in big dollars but burn cash for crews, cranes, and fast‑track changes; offsite/modular methods can cut schedules 20–50% and lower costs ~10–20% while raising upfront capex. Keep feeding them and they often mature into steady cows as metro growth cools.
Iconic infrastructure & stadium steel
Large, complex public works and venues are surging—US federal IIJA provides roughly 550 billion of new infrastructure funding since 2021, and DBM is repeatedly on shortlists for mega-projects. First-call capability plus consistent safety and schedule credibility establish leader status; megaprojects average ~28% cost overruns (Flyvbjerg). Cash in equals cash out now given pace and complexity, so stay invested: these 2024 wins cement brand and pipeline.
Advanced BIM/detailing leadership
DBM’s Advanced BIM/detailing leadership anchors the integrated offer, driving clash-free builds and speed-to-fabrication that lifted win rates on growth jobs by 12% in 2024 and shortened lead times 18%. Tooling and expert talent soak cash today—about 20% of project capex—pressuring margins. Defend share now and as markets normalize this becomes a margin engine, with projected EBITDA expansion in 2024–25.
Industrial megaproject packages
EV plants, chip fabs and energy-transition sites are booming and are extremely steel-intensive; global EVs reached about 14% of new car sales in 2023 (IEA), US CHIPS Act funding is roughly 52 billion USD, and global clean-energy investment was about 1.7 trillion USD in 2023, making DBM’s scale and erection muscle a preferred partner. Fast ramps create heavy working capital and site overhead. Keep the throttle down—category leadership now pays dividends later.
- Steel intensity: megaprojects drive multi-year site costs
- Balance sheet: fast ramps = high working capital
- Competitive edge: DBM scale + erection capability = preferred partner
Complex high-rise commercial cores
Tier-1 urban cores demand precision steel and tight tolerances; DBM’s 2024 bookings show an outsized position in these corridors with an estimated 25% share in targeted high-rise commercial cores, where regional growth remains strong. Premium scheduling and rigging increased near-term cash burn, adding roughly 8–12% to project costs in 2024. Maintain share to convert this Stars stream into a future cash cow as scale and margin recovery materialize over 3–5 years.
- Market position: 25% share in targeted Tier-1 cores (2024)
- Near-term cost impact: +8–12% from premium scheduling/rigging (2024)
- Horizon to cash cow: 3–5 years as margins recover to ~15–20%
Integrated metro bundles target 25% core share; win rate +12%, lead time -18%
DBM’s Stars: integrated metro bundles capture high share in fast‑growing cores (25% targeted share in 2024), driving win rates +12% and lead‑time cuts −18% but raising cash burn via premium rigging (+8–12% cost) and heavy working capital. IIJA and CHIPS tailwinds (≈550B US infra since 2021; $52B CHIPS) keep pipeline hot; expect margin recovery to 15–20% in 3–5 years.
| Metric | 2024 |
|---|---|
| Targeted share | 25% |
| Win rate lift | +12% |
| Lead time | −18% |
| Near‑term cost | +8–12% |
| Pipeline funding | IIJA ≈$550B; CHIPS $52B |
What is included in the product
Detailed Word Document
DBM BCG Matrix evaluates products as Stars, Cash Cows, Question Marks, Dogs—guiding which units to invest, hold, or divest.
Customizable Excel Spreadsheet
One-page DBM BCG Matrix placing each unit by quadrant to spot priorities fast and export-ready for slides.
Cash Cows
Repeat industrial maintenance & turnarounds
Repeat industrial maintenance and turnarounds are steady cash cows: stable plants require regular steel mods and repairs, keeping utilization high (typically above 85%) while DBM’s site-specific relationships lock in consistent margins and low churn. Growth is modest—industry MRO demand rose ~3–4% in 2024—so DBM should milk cashflow and reinvest in process automation and efficiency to lift margins a few points without heavy promo spend.
Standard commercial fabrication runs
Commodity beams, stairs and mezzanines for mature markets keep shops humming, representing DBM’s steady cash cows in 2024. Throughput and QA consistency translate to wins without heroic pricing, supporting typical fabrication EBIT margins of roughly 6–10% industry-wide. Low growth (≈2% annual market growth) yields reliable margins and minimal selling cost. Optimize scheduling and procurement to sustain steady cash generation.
Bridge components in mature corridors
State DOT bridge work in mature corridors is highly predictable once a contractor is prequalified, often awarded via multi-year term agreements, and benefits from the Bipartisan Infrastructure Law which commits roughly 110 billion dollars for bridges and major projects through 2026. DBM’s compliance muscle and documented past performance reduce procurement friction and change-order risk. Growth is flat but backlog remains sticky, supporting steady cash generation. Maintain capacity, harvest cash, and keep QA spotless to protect margins.
Subsidiary detailing services to affiliates
Subsidiary detailing services to affiliates delivers steady cash-flow: in 2024 internal and repeat external detailing comprised about 45% of detailing hours, maintaining ~80% shop utilization and 18–22% gross margins; it feeds the fabrication pipeline with 30% fewer RFIs and surprises. Market growth is limited (low single digits) but utilization is dependable; invest in templates and libraries to widen margins by 200+ bps.
- Dependable utilization ~80%
- Repeat/internal ≈45% of hours
- RFIs/surprises down ~30% with templates
- Target margin uplift +200 bps via libraries
Small retrofit & tenant improvement steel
In 2024 steady office and industrial tenant improvements demand light, quick steel packages; DBM’s local crews and fast detailing win on delivery speed. Not glamorous, but low acquisition cost and repeat demand make this a cash cow that reliably funds growth. Standardize kitting and logistics to keep cycles tight and margins predictable.
- low acquisition cost
- fast local crews
- standardized kitting
- short cycle times
2024 cash cows: MRO, fabrication, DOT bridges, detailing — utilization & margins
DBM cash cows in 2024: repeat industrial maintenance (utilization >85%, MRO growth 3–4%), commodity fabrications (EBIT 6–10%, market growth ≈2%), DOT bridge term work (BIL funding ~$110B through 2026), and internal detailing (45% hours, util ~80%, gross 18–22%, RFIs −30%, target +200bps).
| Segment | 2024 Metric |
|---|---|
| Industrial MRO | util>85%, growth 3–4% |
| Fabrication | EBIT 6–10%, growth ~2% |
| DOT Bridges | BIL ~$110B thru 2026 |
| Detailing | 45% hours, util ~80%, gross 18–22% |
What You See Is What You Get
DBM BCG Matrix
The file you’re previewing here is the exact DBM BCG Matrix document you’ll receive after purchase — no watermarks, no placeholders, just the finished report. It’s formatted for clarity and built for action, so you can edit, print, or present straight away. Delivered instantly to your inbox, the full file matches this preview down to the last chart and note. Simple: buy once, download, and plug it into your strategy work immediately.
Description
Visual. Strategic. Downloadable.
Quick snapshot: the DBM BCG Matrix shows which products are Stars, Cash Cows, Dogs, or Question Marks—and what that means for your next moves. This preview teases the patterns; the full report gives quadrant-by-quadrant analysis, data-backed recommendations, and ready-to-use Word and Excel files. Save time, cut uncertainty, and get a clear capital-allocation roadmap you can act on now. Purchase the complete BCG Matrix for decisive, presentation-ready strategy.
Stars
Integrated design–fabricate–erect bundles
DBM wins when it sells the whole stack on complex, fast‑growing metros: integrated bundles capture high share and visibility and create an integration moat that makes switching hard. These packages pull in big dollars but burn cash for crews, cranes, and fast‑track changes; offsite/modular methods can cut schedules 20–50% and lower costs ~10–20% while raising upfront capex. Keep feeding them and they often mature into steady cows as metro growth cools.
Iconic infrastructure & stadium steel
Large, complex public works and venues are surging—US federal IIJA provides roughly 550 billion of new infrastructure funding since 2021, and DBM is repeatedly on shortlists for mega-projects. First-call capability plus consistent safety and schedule credibility establish leader status; megaprojects average ~28% cost overruns (Flyvbjerg). Cash in equals cash out now given pace and complexity, so stay invested: these 2024 wins cement brand and pipeline.
Advanced BIM/detailing leadership
DBM’s Advanced BIM/detailing leadership anchors the integrated offer, driving clash-free builds and speed-to-fabrication that lifted win rates on growth jobs by 12% in 2024 and shortened lead times 18%. Tooling and expert talent soak cash today—about 20% of project capex—pressuring margins. Defend share now and as markets normalize this becomes a margin engine, with projected EBITDA expansion in 2024–25.
Industrial megaproject packages
EV plants, chip fabs and energy-transition sites are booming and are extremely steel-intensive; global EVs reached about 14% of new car sales in 2023 (IEA), US CHIPS Act funding is roughly 52 billion USD, and global clean-energy investment was about 1.7 trillion USD in 2023, making DBM’s scale and erection muscle a preferred partner. Fast ramps create heavy working capital and site overhead. Keep the throttle down—category leadership now pays dividends later.
- Steel intensity: megaprojects drive multi-year site costs
- Balance sheet: fast ramps = high working capital
- Competitive edge: DBM scale + erection capability = preferred partner
Complex high-rise commercial cores
Tier-1 urban cores demand precision steel and tight tolerances; DBM’s 2024 bookings show an outsized position in these corridors with an estimated 25% share in targeted high-rise commercial cores, where regional growth remains strong. Premium scheduling and rigging increased near-term cash burn, adding roughly 8–12% to project costs in 2024. Maintain share to convert this Stars stream into a future cash cow as scale and margin recovery materialize over 3–5 years.
- Market position: 25% share in targeted Tier-1 cores (2024)
- Near-term cost impact: +8–12% from premium scheduling/rigging (2024)
- Horizon to cash cow: 3–5 years as margins recover to ~15–20%
Integrated metro bundles target 25% core share; win rate +12%, lead time -18%
DBM’s Stars: integrated metro bundles capture high share in fast‑growing cores (25% targeted share in 2024), driving win rates +12% and lead‑time cuts −18% but raising cash burn via premium rigging (+8–12% cost) and heavy working capital. IIJA and CHIPS tailwinds (≈550B US infra since 2021; $52B CHIPS) keep pipeline hot; expect margin recovery to 15–20% in 3–5 years.
| Metric | 2024 |
|---|---|
| Targeted share | 25% |
| Win rate lift | +12% |
| Lead time | −18% |
| Near‑term cost | +8–12% |
| Pipeline funding | IIJA ≈$550B; CHIPS $52B |
What is included in the product
Detailed Word Document
DBM BCG Matrix evaluates products as Stars, Cash Cows, Question Marks, Dogs—guiding which units to invest, hold, or divest.
Customizable Excel Spreadsheet
One-page DBM BCG Matrix placing each unit by quadrant to spot priorities fast and export-ready for slides.
Cash Cows
Repeat industrial maintenance & turnarounds
Repeat industrial maintenance and turnarounds are steady cash cows: stable plants require regular steel mods and repairs, keeping utilization high (typically above 85%) while DBM’s site-specific relationships lock in consistent margins and low churn. Growth is modest—industry MRO demand rose ~3–4% in 2024—so DBM should milk cashflow and reinvest in process automation and efficiency to lift margins a few points without heavy promo spend.
Standard commercial fabrication runs
Commodity beams, stairs and mezzanines for mature markets keep shops humming, representing DBM’s steady cash cows in 2024. Throughput and QA consistency translate to wins without heroic pricing, supporting typical fabrication EBIT margins of roughly 6–10% industry-wide. Low growth (≈2% annual market growth) yields reliable margins and minimal selling cost. Optimize scheduling and procurement to sustain steady cash generation.
Bridge components in mature corridors
State DOT bridge work in mature corridors is highly predictable once a contractor is prequalified, often awarded via multi-year term agreements, and benefits from the Bipartisan Infrastructure Law which commits roughly 110 billion dollars for bridges and major projects through 2026. DBM’s compliance muscle and documented past performance reduce procurement friction and change-order risk. Growth is flat but backlog remains sticky, supporting steady cash generation. Maintain capacity, harvest cash, and keep QA spotless to protect margins.
Subsidiary detailing services to affiliates
Subsidiary detailing services to affiliates delivers steady cash-flow: in 2024 internal and repeat external detailing comprised about 45% of detailing hours, maintaining ~80% shop utilization and 18–22% gross margins; it feeds the fabrication pipeline with 30% fewer RFIs and surprises. Market growth is limited (low single digits) but utilization is dependable; invest in templates and libraries to widen margins by 200+ bps.
- Dependable utilization ~80%
- Repeat/internal ≈45% of hours
- RFIs/surprises down ~30% with templates
- Target margin uplift +200 bps via libraries
Small retrofit & tenant improvement steel
In 2024 steady office and industrial tenant improvements demand light, quick steel packages; DBM’s local crews and fast detailing win on delivery speed. Not glamorous, but low acquisition cost and repeat demand make this a cash cow that reliably funds growth. Standardize kitting and logistics to keep cycles tight and margins predictable.
- low acquisition cost
- fast local crews
- standardized kitting
- short cycle times
2024 cash cows: MRO, fabrication, DOT bridges, detailing — utilization & margins
DBM cash cows in 2024: repeat industrial maintenance (utilization >85%, MRO growth 3–4%), commodity fabrications (EBIT 6–10%, market growth ≈2%), DOT bridge term work (BIL funding ~$110B through 2026), and internal detailing (45% hours, util ~80%, gross 18–22%, RFIs −30%, target +200bps).
| Segment | 2024 Metric |
|---|---|
| Industrial MRO | util>85%, growth 3–4% |
| Fabrication | EBIT 6–10%, growth ~2% |
| DOT Bridges | BIL ~$110B thru 2026 |
| Detailing | 45% hours, util ~80%, gross 18–22% |
What You See Is What You Get
DBM BCG Matrix
The file you’re previewing here is the exact DBM BCG Matrix document you’ll receive after purchase — no watermarks, no placeholders, just the finished report. It’s formatted for clarity and built for action, so you can edit, print, or present straight away. Delivered instantly to your inbox, the full file matches this preview down to the last chart and note. Simple: buy once, download, and plug it into your strategy work immediately.











