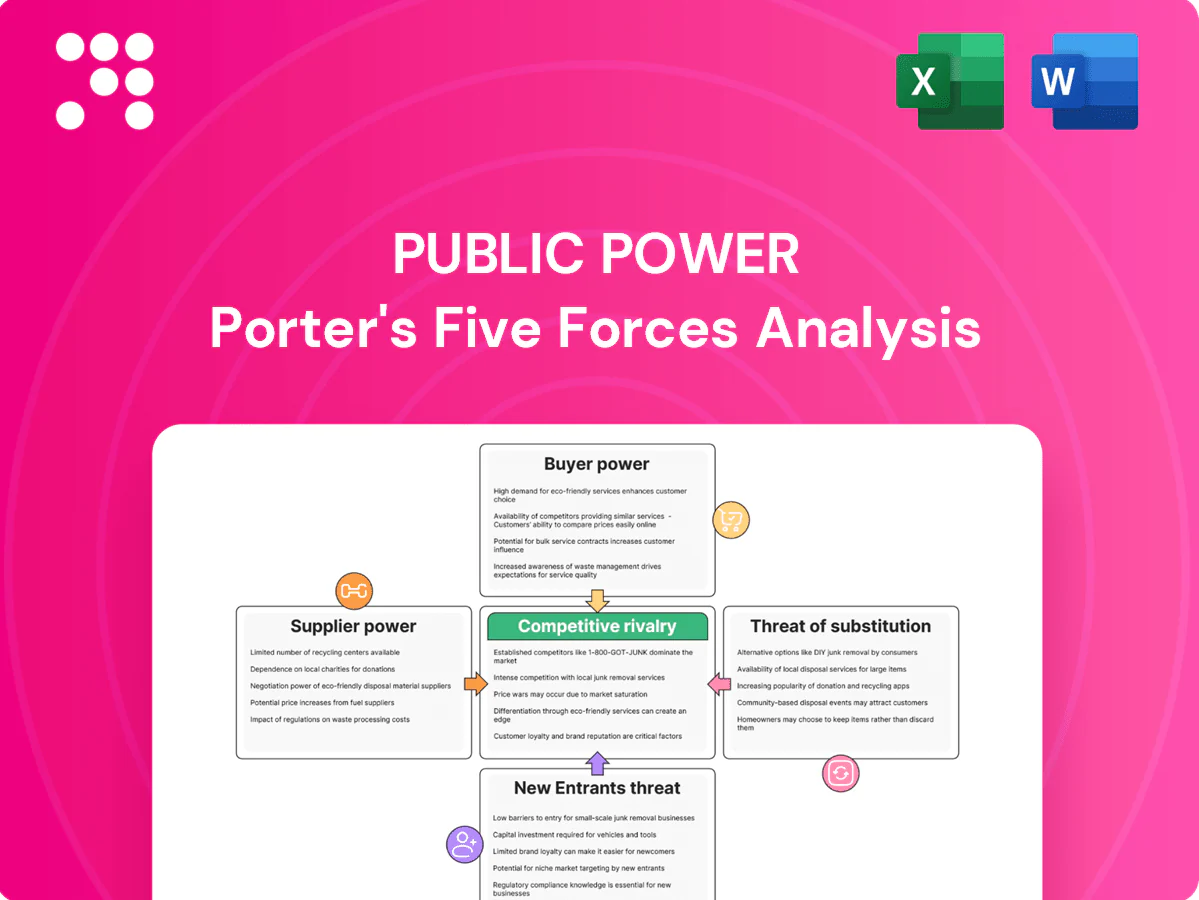
Public Power Porter's Five Forces Analysis

Elevate Your Analysis with the Complete Porter's Five Forces Analysis
Public Power’s Porter's Five Forces highlights supplier leverage, buyer pressure, competitive rivalry, threats from new entrants and substitutes, and regulatory impact. This brief snapshot surfaces key tensions and strategic levers. Unlock the full analysis for force-by-force ratings, visuals, and actionable recommendations.
Suppliers Bargaining Power

Fuel and carbon inputs
PPC depends on natural gas, imported coal alternatives and EU ETS allowances, with EU gas import dependency around 80% and EUA prices near €100/ton in 2024, creating concentrated, volatile input markets. Limited domestic gas suppliers and LNG regas slot constraints amplify supplier bargaining power and price pass-through. Carbon price swings materially shift generation costs toward allowance markets. Long-term contracts and hedging reduce but do not eliminate exposure.
OEMs and grid equipment
OEM concentration in turbines, inverters, transformers and HV gear leaves a few global suppliers controlling roughly 60–70% of capacity in 2024. Long lead times (turbines 9–18 months, transformers 6–12, inverters 3–9) and technical lock‑in raise PPC switching costs. Supply‑chain tightness in 2021–24 pushed supplier leverage and price pressure of ~10–15% during expansion cycles. Framework agreements mitigate risk, but bespoke specs sustain OEM power.

EPCs and RES component suppliers
Renewables growth ties PPC to EPC firms and module, inverter and battery suppliers, with module ASPs down about 20–30% since 2022 to roughly $0.12–0.20/W in 2024 and battery packs near $130/kWh. Interconnection and BOS (civil, transformers, grid works) still form 25–35% of capex and can bottleneck delivery. Quality and warranty terms concentrate power with tier‑1 suppliers (bankable vendors supply >60% of financed projects), while competitive tenders lower prices but bankability requirements narrow the bidder field.

Labor and specialized contractors
Unionized labor and skilled technicians are critical for generation, grid works, and maintenance, and collectively hold significant bargaining power in public power utilities; negotiated contracts in 2024 continued to shape wage and overtime costs and operational flexibility. Scarcity of high-voltage and digital grid skills gives specialized contractors leverage on project pricing and timelines. Expanding training pipelines and stronger in-house electrician and relay technician teams can gradually rebalance supplier power.
- Union presence concentrated in utility trades (2024)
- High-voltage/digital skills scarce, raising contractor rates
- Contracts drive cost structure and workforce flexibility
- Investment in training/in-house reduces supplier leverage over time
Transmission and system services
PPC depends on access to the national TSO ADMIE (IPTO) for dispatch, balancing and ancillary services as of 2024. Congestion, curtailment and evolving grid codes directly shape operational costs and revenue, while transmission capacity constraints can indirectly elevate supplier-like power. Coordination and targeted grid investment planning are essential to reduce exposure.
- TSO dependency: ADMIE (IPTO) handles dispatch/balancing
- Risks: congestion, curtailment, grid-code compliance
- Mitigation: coordinated planning and transmission investment
Supply squeeze: gas import, €100 EUA, OEM concentration and BOS costs
PPC faces strong supplier power from fuel and carbon markets (EU gas ~80% import dependence; EUA ~€100/t in 2024), concentrated OEMs (60–70% share; turbines 9–18m lead) and BOS/EPC bottlenecks (modules $0.12–0.20/W; batteries ~$130/kWh). Unionized labor and TSO (ADMIE) dependencies further raise switching costs; long contracts and hedges partly mitigate risk.
| Risk | 2024 metric |
|---|---|
| Gas import dep | ~80% |
| EUA price | ~€100/t |
| OEM concentration | 60–70% |
| Module ASP | $0.12–0.20/W |
| Battery pack | ~$130/kWh |
What is included in the product
 Detailed Word Document
Uncovers key drivers of competition, supplier and buyer power, entry barriers, substitutes, and rivalry specific to Public Power, highlighting disruptive threats, pricing influence, and strategic protections to inform investor presentations, business plans, and internal strategy work.

 Customizable Excel Spreadsheet
A concise, one-sheet Porter's Five Forces for public power—instantly reveal regulatory, supplier, entrant and buyer pressures to unblock strategic decisions and feed slide-ready summaries for boards or capital planners.
Customers Bargaining Power

Households and SMEs
Households and SMEs are numerous and highly fragmented—as of 2024 the UK has about 27.8 million households and 5.5 million SMEs—which limits individual bargaining power. Tariff transparency and easier switching (retail switching rates rising above pre-2020 levels) increase collective pressure on public utilities. Government social tariffs and regulatory price caps constrain pricing latitude, while customer experience and brand trust drive churn risk and retention economics.
Large industrials and C&I
Large industrials and C&I can demand bespoke contracts, volume discounts and tailored PPAs, leveraging economies of scale; in the US C&I accounts for roughly 60% of electricity consumption as of 2024 (EIA). Their ability to switch retailers or self-generate increases bargaining power and raises churn risk for public power. Detailed load profiles, onsite generation and participation in demand-response programs provide further negotiating tools. PPCs must weigh margin compression against retention and improved load factor benefits.

Retail competition and switching
Liberalization has opened retail choice—17 US states plus DC and several EU markets allow alternative suppliers as of 2024—boosting buyer bargaining power. Promotional offers, hedged products and green tariffs increase price sensitivity and churn, with many consumers switching within 1–2 billing cycles. Moderate switching costs enhance retail buyer leverage. Service reliability and billing accuracy often determine supplier retention.

Demand elasticity and energy efficiency
Rising retail prices have driven conservation, faster appliance upgrades, and process optimization, with studies in 2024 showing discretionary load elasticity near -0.5 while essential usage remains around -0.1, gradually eroding Public Power Companys pricing power as consumption falls.
- Price rise → conservation, appliance upgrades
- Elasticity: essentials ~-0.1, discretionary ~-0.5 (2024)
- Efficiency reduces utility revenue over time
- Government rebates and incentives speed adoption
Green preferences and PPAs
Corporate decarbonization in 2024 pushed demand for certified green power and long-term PPAs, with global corporate PPA volumes ~36 GW in 2024, tightening merchant margins but locking volumes; guarantees of origin and PPAs secure price and sustainability claims. PPC’s expanding RES base, roughly 2.0 GW by 2024, positions it to capture this buyer preference and stabilize cash flows.
- Corporate targets: 36 GW global PPAs (2024)
- Buyer tools: guarantees of origin + long-term PPAs
- Impact: margin compression, volume stability
- PPC: ~2.0 GW RES capacity (2024)
Fragmented households and SMEs face rising buyer power as C&I PPAs, liberalisation squeeze margins
Households (27.8m UK) and 5.5m SMEs are fragmented, limiting individual leverage, while tariff transparency and switching raise collective pressure. Large C&I (≈60% US consumption) use PPAs and self‑generation to extract discounts and shift risk. Liberalisation (17 US states+DC retail choice) and 36 GW corporate PPAs (2024) increase buyer power, and efficiency (elasticity discretionary ~-0.5, essential ~-0.1) erodes pricing power.
| Metric | 2024 value |
|---|---|
| UK households | 27.8m |
| UK SMEs | 5.5m |
| US C&I share | ≈60% |
| Corporate PPAs | 36 GW |
| PPC RES | ~2.0 GW |
| Elasticity (disc/ess) | -0.5 / -0.1 |
Same Document Delivered
Public Power Porter's Five Forces Analysis
This Public Power Porter's Five Forces analysis evaluates competitive rivalry, supplier and buyer power, threat of substitutes, and barriers to entry to clarify strategic positioning and regulatory risks. You're previewing the final version—precisely the same document that will be available to you instantly after buying. It is professionally formatted and ready for immediate use.

Elevate Your Analysis with the Complete Porter's Five Forces Analysis
Public Power’s Porter's Five Forces highlights supplier leverage, buyer pressure, competitive rivalry, threats from new entrants and substitutes, and regulatory impact. This brief snapshot surfaces key tensions and strategic levers. Unlock the full analysis for force-by-force ratings, visuals, and actionable recommendations.
Suppliers Bargaining Power
Fuel and carbon inputs
PPC depends on natural gas, imported coal alternatives and EU ETS allowances, with EU gas import dependency around 80% and EUA prices near €100/ton in 2024, creating concentrated, volatile input markets. Limited domestic gas suppliers and LNG regas slot constraints amplify supplier bargaining power and price pass-through. Carbon price swings materially shift generation costs toward allowance markets. Long-term contracts and hedging reduce but do not eliminate exposure.
OEMs and grid equipment
OEM concentration in turbines, inverters, transformers and HV gear leaves a few global suppliers controlling roughly 60–70% of capacity in 2024. Long lead times (turbines 9–18 months, transformers 6–12, inverters 3–9) and technical lock‑in raise PPC switching costs. Supply‑chain tightness in 2021–24 pushed supplier leverage and price pressure of ~10–15% during expansion cycles. Framework agreements mitigate risk, but bespoke specs sustain OEM power.
EPCs and RES component suppliers
Renewables growth ties PPC to EPC firms and module, inverter and battery suppliers, with module ASPs down about 20–30% since 2022 to roughly $0.12–0.20/W in 2024 and battery packs near $130/kWh. Interconnection and BOS (civil, transformers, grid works) still form 25–35% of capex and can bottleneck delivery. Quality and warranty terms concentrate power with tier‑1 suppliers (bankable vendors supply >60% of financed projects), while competitive tenders lower prices but bankability requirements narrow the bidder field.
Labor and specialized contractors
Unionized labor and skilled technicians are critical for generation, grid works, and maintenance, and collectively hold significant bargaining power in public power utilities; negotiated contracts in 2024 continued to shape wage and overtime costs and operational flexibility. Scarcity of high-voltage and digital grid skills gives specialized contractors leverage on project pricing and timelines. Expanding training pipelines and stronger in-house electrician and relay technician teams can gradually rebalance supplier power.
- Union presence concentrated in utility trades (2024)
- High-voltage/digital skills scarce, raising contractor rates
- Contracts drive cost structure and workforce flexibility
- Investment in training/in-house reduces supplier leverage over time
Transmission and system services
PPC depends on access to the national TSO ADMIE (IPTO) for dispatch, balancing and ancillary services as of 2024. Congestion, curtailment and evolving grid codes directly shape operational costs and revenue, while transmission capacity constraints can indirectly elevate supplier-like power. Coordination and targeted grid investment planning are essential to reduce exposure.
- TSO dependency: ADMIE (IPTO) handles dispatch/balancing
- Risks: congestion, curtailment, grid-code compliance
- Mitigation: coordinated planning and transmission investment
Supply squeeze: gas import, €100 EUA, OEM concentration and BOS costs
PPC faces strong supplier power from fuel and carbon markets (EU gas ~80% import dependence; EUA ~€100/t in 2024), concentrated OEMs (60–70% share; turbines 9–18m lead) and BOS/EPC bottlenecks (modules $0.12–0.20/W; batteries ~$130/kWh). Unionized labor and TSO (ADMIE) dependencies further raise switching costs; long contracts and hedges partly mitigate risk.
| Risk | 2024 metric |
|---|---|
| Gas import dep | ~80% |
| EUA price | ~€100/t |
| OEM concentration | 60–70% |
| Module ASP | $0.12–0.20/W |
| Battery pack | ~$130/kWh |
What is included in the product
Detailed Word Document
Uncovers key drivers of competition, supplier and buyer power, entry barriers, substitutes, and rivalry specific to Public Power, highlighting disruptive threats, pricing influence, and strategic protections to inform investor presentations, business plans, and internal strategy work.
Customizable Excel Spreadsheet
A concise, one-sheet Porter's Five Forces for public power—instantly reveal regulatory, supplier, entrant and buyer pressures to unblock strategic decisions and feed slide-ready summaries for boards or capital planners.
Customers Bargaining Power
Households and SMEs
Households and SMEs are numerous and highly fragmented—as of 2024 the UK has about 27.8 million households and 5.5 million SMEs—which limits individual bargaining power. Tariff transparency and easier switching (retail switching rates rising above pre-2020 levels) increase collective pressure on public utilities. Government social tariffs and regulatory price caps constrain pricing latitude, while customer experience and brand trust drive churn risk and retention economics.
Large industrials and C&I
Large industrials and C&I can demand bespoke contracts, volume discounts and tailored PPAs, leveraging economies of scale; in the US C&I accounts for roughly 60% of electricity consumption as of 2024 (EIA). Their ability to switch retailers or self-generate increases bargaining power and raises churn risk for public power. Detailed load profiles, onsite generation and participation in demand-response programs provide further negotiating tools. PPCs must weigh margin compression against retention and improved load factor benefits.
Retail competition and switching
Liberalization has opened retail choice—17 US states plus DC and several EU markets allow alternative suppliers as of 2024—boosting buyer bargaining power. Promotional offers, hedged products and green tariffs increase price sensitivity and churn, with many consumers switching within 1–2 billing cycles. Moderate switching costs enhance retail buyer leverage. Service reliability and billing accuracy often determine supplier retention.
Demand elasticity and energy efficiency
Rising retail prices have driven conservation, faster appliance upgrades, and process optimization, with studies in 2024 showing discretionary load elasticity near -0.5 while essential usage remains around -0.1, gradually eroding Public Power Companys pricing power as consumption falls.
- Price rise → conservation, appliance upgrades
- Elasticity: essentials ~-0.1, discretionary ~-0.5 (2024)
- Efficiency reduces utility revenue over time
- Government rebates and incentives speed adoption
Green preferences and PPAs
Corporate decarbonization in 2024 pushed demand for certified green power and long-term PPAs, with global corporate PPA volumes ~36 GW in 2024, tightening merchant margins but locking volumes; guarantees of origin and PPAs secure price and sustainability claims. PPC’s expanding RES base, roughly 2.0 GW by 2024, positions it to capture this buyer preference and stabilize cash flows.
- Corporate targets: 36 GW global PPAs (2024)
- Buyer tools: guarantees of origin + long-term PPAs
- Impact: margin compression, volume stability
- PPC: ~2.0 GW RES capacity (2024)
Fragmented households and SMEs face rising buyer power as C&I PPAs, liberalisation squeeze margins
Households (27.8m UK) and 5.5m SMEs are fragmented, limiting individual leverage, while tariff transparency and switching raise collective pressure. Large C&I (≈60% US consumption) use PPAs and self‑generation to extract discounts and shift risk. Liberalisation (17 US states+DC retail choice) and 36 GW corporate PPAs (2024) increase buyer power, and efficiency (elasticity discretionary ~-0.5, essential ~-0.1) erodes pricing power.
| Metric | 2024 value |
|---|---|
| UK households | 27.8m |
| UK SMEs | 5.5m |
| US C&I share | ≈60% |
| Corporate PPAs | 36 GW |
| PPC RES | ~2.0 GW |
| Elasticity (disc/ess) | -0.5 / -0.1 |
Same Document Delivered
Public Power Porter's Five Forces Analysis
This Public Power Porter's Five Forces analysis evaluates competitive rivalry, supplier and buyer power, threat of substitutes, and barriers to entry to clarify strategic positioning and regulatory risks. You're previewing the final version—precisely the same document that will be available to you instantly after buying. It is professionally formatted and ready for immediate use.
Original: $10.00
-65%$10.00
$3.50Description
Elevate Your Analysis with the Complete Porter's Five Forces Analysis
Public Power’s Porter's Five Forces highlights supplier leverage, buyer pressure, competitive rivalry, threats from new entrants and substitutes, and regulatory impact. This brief snapshot surfaces key tensions and strategic levers. Unlock the full analysis for force-by-force ratings, visuals, and actionable recommendations.
Suppliers Bargaining Power
Fuel and carbon inputs
PPC depends on natural gas, imported coal alternatives and EU ETS allowances, with EU gas import dependency around 80% and EUA prices near €100/ton in 2024, creating concentrated, volatile input markets. Limited domestic gas suppliers and LNG regas slot constraints amplify supplier bargaining power and price pass-through. Carbon price swings materially shift generation costs toward allowance markets. Long-term contracts and hedging reduce but do not eliminate exposure.
OEMs and grid equipment
OEM concentration in turbines, inverters, transformers and HV gear leaves a few global suppliers controlling roughly 60–70% of capacity in 2024. Long lead times (turbines 9–18 months, transformers 6–12, inverters 3–9) and technical lock‑in raise PPC switching costs. Supply‑chain tightness in 2021–24 pushed supplier leverage and price pressure of ~10–15% during expansion cycles. Framework agreements mitigate risk, but bespoke specs sustain OEM power.
EPCs and RES component suppliers
Renewables growth ties PPC to EPC firms and module, inverter and battery suppliers, with module ASPs down about 20–30% since 2022 to roughly $0.12–0.20/W in 2024 and battery packs near $130/kWh. Interconnection and BOS (civil, transformers, grid works) still form 25–35% of capex and can bottleneck delivery. Quality and warranty terms concentrate power with tier‑1 suppliers (bankable vendors supply >60% of financed projects), while competitive tenders lower prices but bankability requirements narrow the bidder field.
Labor and specialized contractors
Unionized labor and skilled technicians are critical for generation, grid works, and maintenance, and collectively hold significant bargaining power in public power utilities; negotiated contracts in 2024 continued to shape wage and overtime costs and operational flexibility. Scarcity of high-voltage and digital grid skills gives specialized contractors leverage on project pricing and timelines. Expanding training pipelines and stronger in-house electrician and relay technician teams can gradually rebalance supplier power.
- Union presence concentrated in utility trades (2024)
- High-voltage/digital skills scarce, raising contractor rates
- Contracts drive cost structure and workforce flexibility
- Investment in training/in-house reduces supplier leverage over time
Transmission and system services
PPC depends on access to the national TSO ADMIE (IPTO) for dispatch, balancing and ancillary services as of 2024. Congestion, curtailment and evolving grid codes directly shape operational costs and revenue, while transmission capacity constraints can indirectly elevate supplier-like power. Coordination and targeted grid investment planning are essential to reduce exposure.
- TSO dependency: ADMIE (IPTO) handles dispatch/balancing
- Risks: congestion, curtailment, grid-code compliance
- Mitigation: coordinated planning and transmission investment
Supply squeeze: gas import, €100 EUA, OEM concentration and BOS costs
PPC faces strong supplier power from fuel and carbon markets (EU gas ~80% import dependence; EUA ~€100/t in 2024), concentrated OEMs (60–70% share; turbines 9–18m lead) and BOS/EPC bottlenecks (modules $0.12–0.20/W; batteries ~$130/kWh). Unionized labor and TSO (ADMIE) dependencies further raise switching costs; long contracts and hedges partly mitigate risk.
| Risk | 2024 metric |
|---|---|
| Gas import dep | ~80% |
| EUA price | ~€100/t |
| OEM concentration | 60–70% |
| Module ASP | $0.12–0.20/W |
| Battery pack | ~$130/kWh |
What is included in the product
Detailed Word Document
Uncovers key drivers of competition, supplier and buyer power, entry barriers, substitutes, and rivalry specific to Public Power, highlighting disruptive threats, pricing influence, and strategic protections to inform investor presentations, business plans, and internal strategy work.
Customizable Excel Spreadsheet
A concise, one-sheet Porter's Five Forces for public power—instantly reveal regulatory, supplier, entrant and buyer pressures to unblock strategic decisions and feed slide-ready summaries for boards or capital planners.
Customers Bargaining Power
Households and SMEs
Households and SMEs are numerous and highly fragmented—as of 2024 the UK has about 27.8 million households and 5.5 million SMEs—which limits individual bargaining power. Tariff transparency and easier switching (retail switching rates rising above pre-2020 levels) increase collective pressure on public utilities. Government social tariffs and regulatory price caps constrain pricing latitude, while customer experience and brand trust drive churn risk and retention economics.
Large industrials and C&I
Large industrials and C&I can demand bespoke contracts, volume discounts and tailored PPAs, leveraging economies of scale; in the US C&I accounts for roughly 60% of electricity consumption as of 2024 (EIA). Their ability to switch retailers or self-generate increases bargaining power and raises churn risk for public power. Detailed load profiles, onsite generation and participation in demand-response programs provide further negotiating tools. PPCs must weigh margin compression against retention and improved load factor benefits.
Retail competition and switching
Liberalization has opened retail choice—17 US states plus DC and several EU markets allow alternative suppliers as of 2024—boosting buyer bargaining power. Promotional offers, hedged products and green tariffs increase price sensitivity and churn, with many consumers switching within 1–2 billing cycles. Moderate switching costs enhance retail buyer leverage. Service reliability and billing accuracy often determine supplier retention.
Demand elasticity and energy efficiency
Rising retail prices have driven conservation, faster appliance upgrades, and process optimization, with studies in 2024 showing discretionary load elasticity near -0.5 while essential usage remains around -0.1, gradually eroding Public Power Companys pricing power as consumption falls.
- Price rise → conservation, appliance upgrades
- Elasticity: essentials ~-0.1, discretionary ~-0.5 (2024)
- Efficiency reduces utility revenue over time
- Government rebates and incentives speed adoption
Green preferences and PPAs
Corporate decarbonization in 2024 pushed demand for certified green power and long-term PPAs, with global corporate PPA volumes ~36 GW in 2024, tightening merchant margins but locking volumes; guarantees of origin and PPAs secure price and sustainability claims. PPC’s expanding RES base, roughly 2.0 GW by 2024, positions it to capture this buyer preference and stabilize cash flows.
- Corporate targets: 36 GW global PPAs (2024)
- Buyer tools: guarantees of origin + long-term PPAs
- Impact: margin compression, volume stability
- PPC: ~2.0 GW RES capacity (2024)
Fragmented households and SMEs face rising buyer power as C&I PPAs, liberalisation squeeze margins
Households (27.8m UK) and 5.5m SMEs are fragmented, limiting individual leverage, while tariff transparency and switching raise collective pressure. Large C&I (≈60% US consumption) use PPAs and self‑generation to extract discounts and shift risk. Liberalisation (17 US states+DC retail choice) and 36 GW corporate PPAs (2024) increase buyer power, and efficiency (elasticity discretionary ~-0.5, essential ~-0.1) erodes pricing power.
| Metric | 2024 value |
|---|---|
| UK households | 27.8m |
| UK SMEs | 5.5m |
| US C&I share | ≈60% |
| Corporate PPAs | 36 GW |
| PPC RES | ~2.0 GW |
| Elasticity (disc/ess) | -0.5 / -0.1 |
Same Document Delivered
Public Power Porter's Five Forces Analysis
This Public Power Porter's Five Forces analysis evaluates competitive rivalry, supplier and buyer power, threat of substitutes, and barriers to entry to clarify strategic positioning and regulatory risks. You're previewing the final version—precisely the same document that will be available to you instantly after buying. It is professionally formatted and ready for immediate use.











