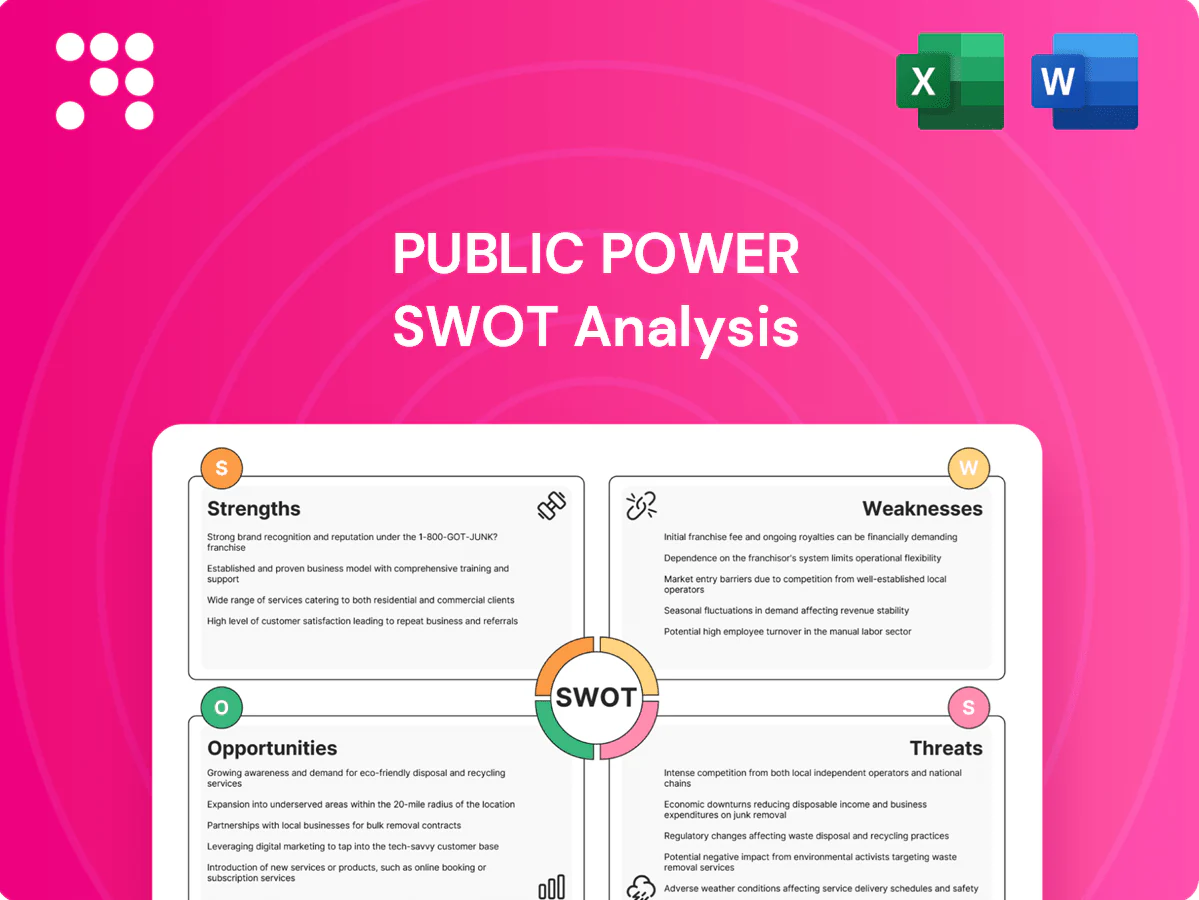
Public Power SWOT Analysis

Go Beyond the Preview—Access the Full Strategic Report
Public Power's SWOT snapshot highlights regulatory resilience, municipal customer focus, and infrastructure scale, alongside aging assets and funding pressures. It outlines market risks and near-term opportunities in grid modernization. Want the full strategic picture? Purchase the complete SWOT for a professionally formatted, editable report and Excel matrix to guide investment or planning decisions.
Strengths

Market leadership in Greece
PPC holds dominant share across generation, supply and networks, supplying over half of Greece’s electricity market (share >50% as of 2023), anchoring significant scale advantages. Its strong brand recognition and nationwide customer reach lower acquisition costs and churn, aiding margin stability. Incumbency and network effects give PPC negotiating leverage with suppliers, regulators and municipalities. This market position underpins resilient, cyclical cash flows for the group.
Fully integrated value chain
PPC spans generation, transmission interface, distribution and retail supply, optimizing end-to-end economics and serving about 6.2 million customers with ~10.6 GW installed capacity and ~30 TWh generation (2023). Integration improves dispatch, hedging and balancing capabilities across the stack. It enables coordinated investment between grid and generation assets. Operational data synergies enhance reliability and customer service.

Accelerating renewables portfolio
Public Power is shifting from lignite to wind, solar, hydro and storage, boosting RES share and lowering plant carbon intensity; solar and wind operating marginal costs are effectively near zero, improving dispatch economics. EU ETS carbon prices averaged about €85/t in H1 2025, so lower emissions cut exposure. Renewables offer long-term, lower-marginal-cost generation and stronger ESG alignment, easing access to green financing and cheaper capital.

Large, diversified customer base
PPC supplies residential, commercial, and industrial customers nationwide, smoothing demand volatility and credit risk through a diversified base. Cross-selling into energy services, e-mobility and efficiency solutions leverages the existing meter footprint amid rising EV uptake. Scale supports advanced billing, analytics and service innovation; public power utilities in the US serve about 49 million customers (APPA).
- Diversified customer mix
- Cross-sell: energy services, e-mobility, efficiency
- Scale for billing & analytics
Established regulatory and stakeholder relationships
Longstanding engagement with Greek and EU energy frameworks (EU 2030 targets: 55% GHG reduction and 42.5% renewables) supports clearer compliance pathways and multi-year planning. Institutional experience navigating tariff and market reforms reduces execution risk and cost overruns. Established stakeholder trust speeds permitting and grid project delivery, shortening approval timelines for strategic investments.
- Regulatory alignment with EU 2030 targets
- Proven execution on tariff/market reforms
- Stakeholder trust that accelerates permits and grid works
Dominant Greek power utility: >50% market share, integrated gen-to-retail, renewable pivot
PPC commands >50% of Greece’s electricity market (2023), serving ~6.2m customers with ~10.6 GW installed and ~30 TWh generation, delivering scale-driven stable cash flows. Integrated generation-to-retail structure improves dispatch, hedging and operational synergies. Rapid shift to RES reduces ETS exposure (EU ETS ~€85/t H1 2025) and lowers marginal costs, enabling green finance access.
| Metric | Value |
|---|---|
| Market share (2023) | >50% |
| Customers | ~6.2m |
| Installed capacity | ~10.6 GW |
| Generation (2023) | ~30 TWh |
| EU ETS price H1 2025 | ~€85/t |
What is included in the product
 Detailed Word Document
Delivers a strategic overview of Public Power’s internal and external business factors, outlining strengths, weaknesses, opportunities, and threats to its competitive position and future growth.

 Customizable Excel Spreadsheet
Provides a focused Public Power SWOT matrix that highlights regulatory, infrastructure, and funding pain points for rapid prioritization and action planning.
Weaknesses

Legacy thermal and lignite exposure
Older thermal plants carry elevated operating and maintenance costs and efficiency penalties that erode unit margins. Lignite assets face steep CO2 costs and regulatory scrutiny: at an EU ETS price near €95/t and ~1.1 tCO2/MWh that implies roughly €104/MWh in CO2 expense alone. Transitioning and decommissioning demand significant capital outlays and careful workforce planning. Residual fossil exposure compresses margins during commodity price swings.
High capex intensity and financing needs
Rapid RES buildout, grid digitalization and rising storage demand are driving record power-sector capex—IEA reports roughly $1.3 trillion invested in the power sector in 2023—forcing sustained investment that can compress free cash flow and strain leverage. Elevated capex raises risk of execution delays, cost overruns and diluted returns, while funding must balance debt capacity with equity and strategic partnerships to avoid solvency stress given growing storage additions (~28–30 GW added in 2023).

Regulatory and political sensitivity
Tariffs, evolving market rules and social policy materially affect public power profitability, with US average retail electricity prices at about 16.9 cents/kWh in 2024 (EIA), compressing margins when rates are capped. Political pressure to protect vulnerable customers—via lifeline rates or disconnection limits—reduces pricing flexibility and revenue recovery. Compliance with overlapping federal, state and local rules increases administrative burden and staffing costs. Midstream regulatory shifts can change project economics and financing conditions, risking stranded assets.

Aging grid assets and island challenges
Portions of the distribution network are aging and require modernization; ASCE gave the U.S. grid a D+ in 2021, highlighting urgent upgrades. Non-interconnected islands add logistical and cost complexity for crews and spares. Reliability upgrades and smart meter rollouts—typically $200–$400 per meter—require large-scale investment and coordination across fragmented geographies.
- Aging assets: ASCE grid grade D+
- Smart meters: $200–$400 per meter
- Islands: higher logistics and spare-part costs
- Fragmented geography: increased maintenance overhead
Customer arrears and collections risk
Historical receivables deterioration has stretched DSO to about 60 days in 2024 and elevated arrears to roughly 5–7%, weakening cash conversion and liquidity. Economic stress in 2024–25 has lifted retail default risk, requiring tighter credit controls that must still honor universal service obligations. Improving collections efficiency is critical: a 1‑day DSO reduction can meaningfully free working capital.
- DSO ~60 days (2024)
- Arrears ~5–7% (2024)
- Retail defaults rising in 2024–25
- Collections efficiency directly affects working capital
Thermal plants squeezed: EU ETS costs, $1.3tn capex surge, DSO ~60d & 5–7% arrears
Legacy thermal and lignite plants face high O&M and CO2 costs (EU ETS ~€95/t → ~€104/MWh), squeezing margins; retirement and workforce transition demand large capex. Power-sector capex surged (~$1.3tn in 2023), pressuring cash flow and execution risk. Distribution aging, DSO ~60 days and arrears 5–7% (2024) weaken liquidity.
| Metric | 2023–24 |
|---|---|
| EU ETS price | ~€95/t (2024) |
| Power capex | $1.3tn (2023) |
| DSO | ~60 days (2024) |
| Arrears | 5–7% (2024) |
Same Document Delivered
Public Power SWOT Analysis
This is the actual Public Power SWOT analysis document you’ll receive upon purchase—no surprises, just professional quality. The preview below is taken directly from the full SWOT report you'll get, with structured strengths, weaknesses, opportunities, and threats. Buy now to unlock the complete, editable version and access the full in-depth analysis immediately after payment.

Go Beyond the Preview—Access the Full Strategic Report
Public Power's SWOT snapshot highlights regulatory resilience, municipal customer focus, and infrastructure scale, alongside aging assets and funding pressures. It outlines market risks and near-term opportunities in grid modernization. Want the full strategic picture? Purchase the complete SWOT for a professionally formatted, editable report and Excel matrix to guide investment or planning decisions.
Strengths
Market leadership in Greece
PPC holds dominant share across generation, supply and networks, supplying over half of Greece’s electricity market (share >50% as of 2023), anchoring significant scale advantages. Its strong brand recognition and nationwide customer reach lower acquisition costs and churn, aiding margin stability. Incumbency and network effects give PPC negotiating leverage with suppliers, regulators and municipalities. This market position underpins resilient, cyclical cash flows for the group.
Fully integrated value chain
PPC spans generation, transmission interface, distribution and retail supply, optimizing end-to-end economics and serving about 6.2 million customers with ~10.6 GW installed capacity and ~30 TWh generation (2023). Integration improves dispatch, hedging and balancing capabilities across the stack. It enables coordinated investment between grid and generation assets. Operational data synergies enhance reliability and customer service.
Accelerating renewables portfolio
Public Power is shifting from lignite to wind, solar, hydro and storage, boosting RES share and lowering plant carbon intensity; solar and wind operating marginal costs are effectively near zero, improving dispatch economics. EU ETS carbon prices averaged about €85/t in H1 2025, so lower emissions cut exposure. Renewables offer long-term, lower-marginal-cost generation and stronger ESG alignment, easing access to green financing and cheaper capital.
Large, diversified customer base
PPC supplies residential, commercial, and industrial customers nationwide, smoothing demand volatility and credit risk through a diversified base. Cross-selling into energy services, e-mobility and efficiency solutions leverages the existing meter footprint amid rising EV uptake. Scale supports advanced billing, analytics and service innovation; public power utilities in the US serve about 49 million customers (APPA).
- Diversified customer mix
- Cross-sell: energy services, e-mobility, efficiency
- Scale for billing & analytics
Established regulatory and stakeholder relationships
Longstanding engagement with Greek and EU energy frameworks (EU 2030 targets: 55% GHG reduction and 42.5% renewables) supports clearer compliance pathways and multi-year planning. Institutional experience navigating tariff and market reforms reduces execution risk and cost overruns. Established stakeholder trust speeds permitting and grid project delivery, shortening approval timelines for strategic investments.
- Regulatory alignment with EU 2030 targets
- Proven execution on tariff/market reforms
- Stakeholder trust that accelerates permits and grid works
Dominant Greek power utility: >50% market share, integrated gen-to-retail, renewable pivot
PPC commands >50% of Greece’s electricity market (2023), serving ~6.2m customers with ~10.6 GW installed and ~30 TWh generation, delivering scale-driven stable cash flows. Integrated generation-to-retail structure improves dispatch, hedging and operational synergies. Rapid shift to RES reduces ETS exposure (EU ETS ~€85/t H1 2025) and lowers marginal costs, enabling green finance access.
| Metric | Value |
|---|---|
| Market share (2023) | >50% |
| Customers | ~6.2m |
| Installed capacity | ~10.6 GW |
| Generation (2023) | ~30 TWh |
| EU ETS price H1 2025 | ~€85/t |
What is included in the product
Detailed Word Document
Delivers a strategic overview of Public Power’s internal and external business factors, outlining strengths, weaknesses, opportunities, and threats to its competitive position and future growth.
Customizable Excel Spreadsheet
Provides a focused Public Power SWOT matrix that highlights regulatory, infrastructure, and funding pain points for rapid prioritization and action planning.
Weaknesses
Legacy thermal and lignite exposure
Older thermal plants carry elevated operating and maintenance costs and efficiency penalties that erode unit margins. Lignite assets face steep CO2 costs and regulatory scrutiny: at an EU ETS price near €95/t and ~1.1 tCO2/MWh that implies roughly €104/MWh in CO2 expense alone. Transitioning and decommissioning demand significant capital outlays and careful workforce planning. Residual fossil exposure compresses margins during commodity price swings.
High capex intensity and financing needs
Rapid RES buildout, grid digitalization and rising storage demand are driving record power-sector capex—IEA reports roughly $1.3 trillion invested in the power sector in 2023—forcing sustained investment that can compress free cash flow and strain leverage. Elevated capex raises risk of execution delays, cost overruns and diluted returns, while funding must balance debt capacity with equity and strategic partnerships to avoid solvency stress given growing storage additions (~28–30 GW added in 2023).
Regulatory and political sensitivity
Tariffs, evolving market rules and social policy materially affect public power profitability, with US average retail electricity prices at about 16.9 cents/kWh in 2024 (EIA), compressing margins when rates are capped. Political pressure to protect vulnerable customers—via lifeline rates or disconnection limits—reduces pricing flexibility and revenue recovery. Compliance with overlapping federal, state and local rules increases administrative burden and staffing costs. Midstream regulatory shifts can change project economics and financing conditions, risking stranded assets.
Aging grid assets and island challenges
Portions of the distribution network are aging and require modernization; ASCE gave the U.S. grid a D+ in 2021, highlighting urgent upgrades. Non-interconnected islands add logistical and cost complexity for crews and spares. Reliability upgrades and smart meter rollouts—typically $200–$400 per meter—require large-scale investment and coordination across fragmented geographies.
- Aging assets: ASCE grid grade D+
- Smart meters: $200–$400 per meter
- Islands: higher logistics and spare-part costs
- Fragmented geography: increased maintenance overhead
Customer arrears and collections risk
Historical receivables deterioration has stretched DSO to about 60 days in 2024 and elevated arrears to roughly 5–7%, weakening cash conversion and liquidity. Economic stress in 2024–25 has lifted retail default risk, requiring tighter credit controls that must still honor universal service obligations. Improving collections efficiency is critical: a 1‑day DSO reduction can meaningfully free working capital.
- DSO ~60 days (2024)
- Arrears ~5–7% (2024)
- Retail defaults rising in 2024–25
- Collections efficiency directly affects working capital
Thermal plants squeezed: EU ETS costs, $1.3tn capex surge, DSO ~60d & 5–7% arrears
Legacy thermal and lignite plants face high O&M and CO2 costs (EU ETS ~€95/t → ~€104/MWh), squeezing margins; retirement and workforce transition demand large capex. Power-sector capex surged (~$1.3tn in 2023), pressuring cash flow and execution risk. Distribution aging, DSO ~60 days and arrears 5–7% (2024) weaken liquidity.
| Metric | 2023–24 |
|---|---|
| EU ETS price | ~€95/t (2024) |
| Power capex | $1.3tn (2023) |
| DSO | ~60 days (2024) |
| Arrears | 5–7% (2024) |
Same Document Delivered
Public Power SWOT Analysis
This is the actual Public Power SWOT analysis document you’ll receive upon purchase—no surprises, just professional quality. The preview below is taken directly from the full SWOT report you'll get, with structured strengths, weaknesses, opportunities, and threats. Buy now to unlock the complete, editable version and access the full in-depth analysis immediately after payment.
Description
Go Beyond the Preview—Access the Full Strategic Report
Public Power's SWOT snapshot highlights regulatory resilience, municipal customer focus, and infrastructure scale, alongside aging assets and funding pressures. It outlines market risks and near-term opportunities in grid modernization. Want the full strategic picture? Purchase the complete SWOT for a professionally formatted, editable report and Excel matrix to guide investment or planning decisions.
Strengths
Market leadership in Greece
PPC holds dominant share across generation, supply and networks, supplying over half of Greece’s electricity market (share >50% as of 2023), anchoring significant scale advantages. Its strong brand recognition and nationwide customer reach lower acquisition costs and churn, aiding margin stability. Incumbency and network effects give PPC negotiating leverage with suppliers, regulators and municipalities. This market position underpins resilient, cyclical cash flows for the group.
Fully integrated value chain
PPC spans generation, transmission interface, distribution and retail supply, optimizing end-to-end economics and serving about 6.2 million customers with ~10.6 GW installed capacity and ~30 TWh generation (2023). Integration improves dispatch, hedging and balancing capabilities across the stack. It enables coordinated investment between grid and generation assets. Operational data synergies enhance reliability and customer service.
Accelerating renewables portfolio
Public Power is shifting from lignite to wind, solar, hydro and storage, boosting RES share and lowering plant carbon intensity; solar and wind operating marginal costs are effectively near zero, improving dispatch economics. EU ETS carbon prices averaged about €85/t in H1 2025, so lower emissions cut exposure. Renewables offer long-term, lower-marginal-cost generation and stronger ESG alignment, easing access to green financing and cheaper capital.
Large, diversified customer base
PPC supplies residential, commercial, and industrial customers nationwide, smoothing demand volatility and credit risk through a diversified base. Cross-selling into energy services, e-mobility and efficiency solutions leverages the existing meter footprint amid rising EV uptake. Scale supports advanced billing, analytics and service innovation; public power utilities in the US serve about 49 million customers (APPA).
- Diversified customer mix
- Cross-sell: energy services, e-mobility, efficiency
- Scale for billing & analytics
Established regulatory and stakeholder relationships
Longstanding engagement with Greek and EU energy frameworks (EU 2030 targets: 55% GHG reduction and 42.5% renewables) supports clearer compliance pathways and multi-year planning. Institutional experience navigating tariff and market reforms reduces execution risk and cost overruns. Established stakeholder trust speeds permitting and grid project delivery, shortening approval timelines for strategic investments.
- Regulatory alignment with EU 2030 targets
- Proven execution on tariff/market reforms
- Stakeholder trust that accelerates permits and grid works
Dominant Greek power utility: >50% market share, integrated gen-to-retail, renewable pivot
PPC commands >50% of Greece’s electricity market (2023), serving ~6.2m customers with ~10.6 GW installed and ~30 TWh generation, delivering scale-driven stable cash flows. Integrated generation-to-retail structure improves dispatch, hedging and operational synergies. Rapid shift to RES reduces ETS exposure (EU ETS ~€85/t H1 2025) and lowers marginal costs, enabling green finance access.
| Metric | Value |
|---|---|
| Market share (2023) | >50% |
| Customers | ~6.2m |
| Installed capacity | ~10.6 GW |
| Generation (2023) | ~30 TWh |
| EU ETS price H1 2025 | ~€85/t |
What is included in the product
Detailed Word Document
Delivers a strategic overview of Public Power’s internal and external business factors, outlining strengths, weaknesses, opportunities, and threats to its competitive position and future growth.
Customizable Excel Spreadsheet
Provides a focused Public Power SWOT matrix that highlights regulatory, infrastructure, and funding pain points for rapid prioritization and action planning.
Weaknesses
Legacy thermal and lignite exposure
Older thermal plants carry elevated operating and maintenance costs and efficiency penalties that erode unit margins. Lignite assets face steep CO2 costs and regulatory scrutiny: at an EU ETS price near €95/t and ~1.1 tCO2/MWh that implies roughly €104/MWh in CO2 expense alone. Transitioning and decommissioning demand significant capital outlays and careful workforce planning. Residual fossil exposure compresses margins during commodity price swings.
High capex intensity and financing needs
Rapid RES buildout, grid digitalization and rising storage demand are driving record power-sector capex—IEA reports roughly $1.3 trillion invested in the power sector in 2023—forcing sustained investment that can compress free cash flow and strain leverage. Elevated capex raises risk of execution delays, cost overruns and diluted returns, while funding must balance debt capacity with equity and strategic partnerships to avoid solvency stress given growing storage additions (~28–30 GW added in 2023).
Regulatory and political sensitivity
Tariffs, evolving market rules and social policy materially affect public power profitability, with US average retail electricity prices at about 16.9 cents/kWh in 2024 (EIA), compressing margins when rates are capped. Political pressure to protect vulnerable customers—via lifeline rates or disconnection limits—reduces pricing flexibility and revenue recovery. Compliance with overlapping federal, state and local rules increases administrative burden and staffing costs. Midstream regulatory shifts can change project economics and financing conditions, risking stranded assets.
Aging grid assets and island challenges
Portions of the distribution network are aging and require modernization; ASCE gave the U.S. grid a D+ in 2021, highlighting urgent upgrades. Non-interconnected islands add logistical and cost complexity for crews and spares. Reliability upgrades and smart meter rollouts—typically $200–$400 per meter—require large-scale investment and coordination across fragmented geographies.
- Aging assets: ASCE grid grade D+
- Smart meters: $200–$400 per meter
- Islands: higher logistics and spare-part costs
- Fragmented geography: increased maintenance overhead
Customer arrears and collections risk
Historical receivables deterioration has stretched DSO to about 60 days in 2024 and elevated arrears to roughly 5–7%, weakening cash conversion and liquidity. Economic stress in 2024–25 has lifted retail default risk, requiring tighter credit controls that must still honor universal service obligations. Improving collections efficiency is critical: a 1‑day DSO reduction can meaningfully free working capital.
- DSO ~60 days (2024)
- Arrears ~5–7% (2024)
- Retail defaults rising in 2024–25
- Collections efficiency directly affects working capital
Thermal plants squeezed: EU ETS costs, $1.3tn capex surge, DSO ~60d & 5–7% arrears
Legacy thermal and lignite plants face high O&M and CO2 costs (EU ETS ~€95/t → ~€104/MWh), squeezing margins; retirement and workforce transition demand large capex. Power-sector capex surged (~$1.3tn in 2023), pressuring cash flow and execution risk. Distribution aging, DSO ~60 days and arrears 5–7% (2024) weaken liquidity.
| Metric | 2023–24 |
|---|---|
| EU ETS price | ~€95/t (2024) |
| Power capex | $1.3tn (2023) |
| DSO | ~60 days (2024) |
| Arrears | 5–7% (2024) |
Same Document Delivered
Public Power SWOT Analysis
This is the actual Public Power SWOT analysis document you’ll receive upon purchase—no surprises, just professional quality. The preview below is taken directly from the full SWOT report you'll get, with structured strengths, weaknesses, opportunities, and threats. Buy now to unlock the complete, editable version and access the full in-depth analysis immediately after payment.











