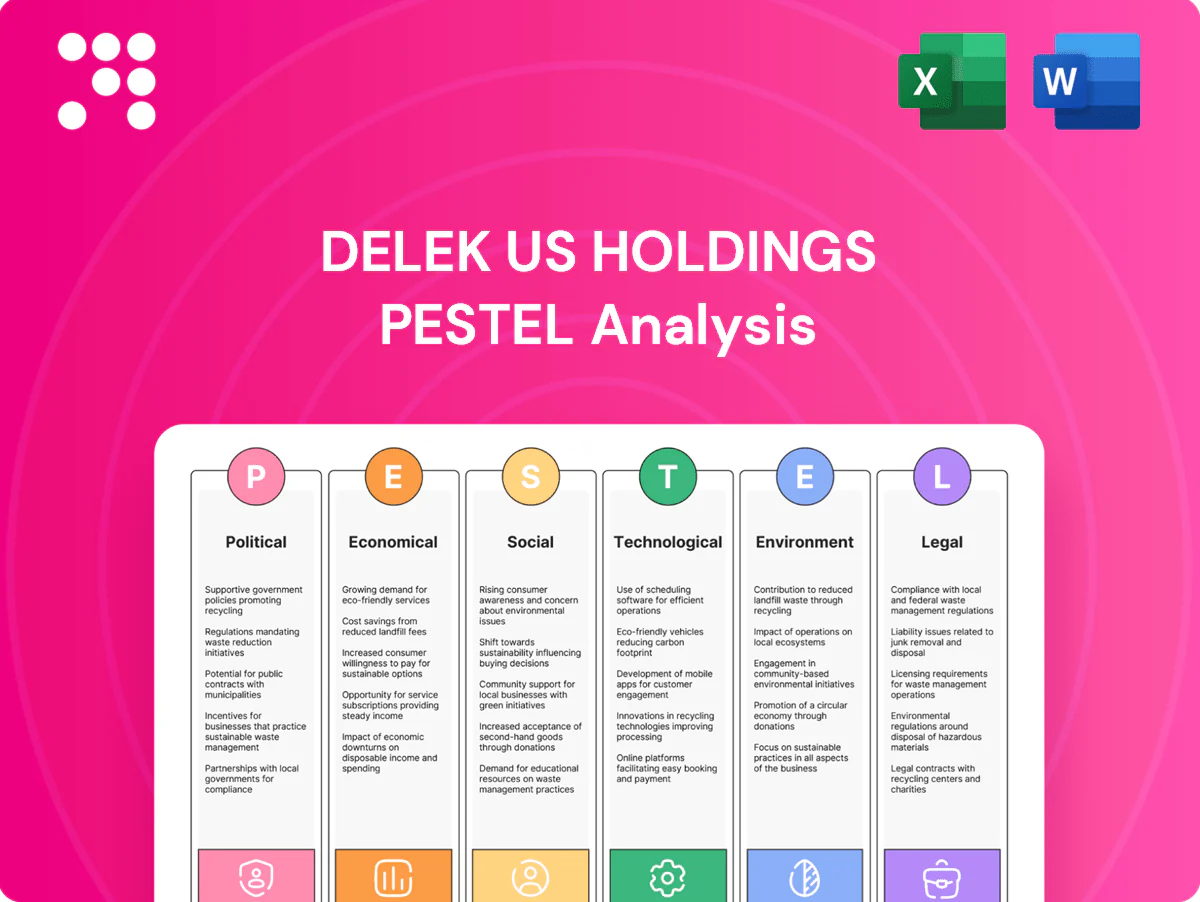
Delek US Holdings PESTLE Analysis

Your Shortcut to Market Insight Starts Here
Gain strategic clarity with our focused PESTLE analysis of Delek US Holdings—examining political, economic, social, technological, legal and environmental forces shaping its margins and growth prospects. Ideal for investors and strategists, this concise review flags key risks and opportunities. Purchase the full, editable report to get the complete, actionable insights instantly.
Political factors

U.S. energy policy shifts
Federal shifts balancing energy security with decarbonization alter refinery utilization and capital planning; US crude production averaged about 13.2 million bpd in 2024 (EIA), keeping feedstock tight while policy pushes low‑carbon fuels. IRA-era incentives—SAF/blender credits up to $1.75/gal—plus greater scrutiny of fossil assets redirect capital toward low‑carbon projects. Administrative stances on pipelines, leasing and permitting can materially affect crude access; Delek must stay agile across election cycles.
Geopolitical crude supply risk
Sanctions, Middle East tensions and OPEC+ supply decisions (which moved seaborne flows by over 1 million b/d in 2024) have widened crude differentials and strained supply reliability, directly affecting Delek US feedstock costs while Brent averaged about $86/b in 2024. Refinery margins hinge on feedstock availability and quality spreads; US refinery utilization ran near 91% in 2024. Diversifying crude slates and hedging logistics becomes critical to secure throughput and constrain volatility, and active political risk management protects throughput and profitability.

State-level regulations and incentives
Refinery, retail fuel and asphalt operations face divergent state rules on emissions, fuel specs and labor that can materially affect margins and operating costs. Low-carbon standards such as LCFS create tradable credits or compliance costs—LCFS credit prices averaged around $150/MT in 2024. State infrastructure funding (federally backed BIL ~$110B for roads/bridges) supports higher asphalt demand. Site-specific political climates shape permitting timelines (months to years) and community relations.

Infrastructure and transportation policy
Federal Bipartisan Infrastructure Law commits roughly 1.2 trillion USD with about 110 billion USD for roads and bridges, directly supporting asphalt volumes and margins for Delek US; pipeline expansions or stricter rail safety rules (U.S. freight rail ~1.6 trillion ton‑miles annually) shift logistics costs and modal mix; trucking and marine fuel regulations influence diesel and bunker demand and refining margins; coordinated industry advocacy can align Delek US supply chains with public works agendas.
- Infrastructure spending: 1.2 trillion USD (BIL), ~110B for roads/bridges
- Freight rail scale: ~1.6 trillion ton‑miles/yr
- Logistics policy alters modal cost and diesel/bunker demand
- Advocacy can secure feedstock and product demand from public works
Trade and tariff regimes
Tariffs such as the 25% Section 232 steel duty and other equipment levies directly raise Delek US capital expenditure and can widen costs versus untariffed competitors; U.S. crude imports from Canada averaged about 3.9 million b/d in 2024 (EIA), shaping feedstock sourcing and refinery runs. Cross-border flows and roughly 0.9 million b/d of U.S. refined product exports to Mexico in 2024 (EIA) influence export opportunities; policy shifts can rapidly reprice arbitrage windows, so vigilant trade compliance preserves margins and market access.
- tariff: 25% steel (Section 232)
- canada crude: ~3.9 mb/d (2024, EIA)
- mexico product imports: ~0.9 mb/d (2024, EIA)
- priority: trade compliance to protect margins
IRA, LCFS and BIL reshape refinery capex; Brent $86, US crude ~13.2 mb/d
Federal energy policy, IRA incentives (SAF/blender credit up to $1.75/gal) and 2024 US crude ~13.2 mb/d reshape refinery capex and feedstock planning. Geopolitical shocks and OPEC+ moves widened differentials; Brent ~ $86/b in 2024. State regs (LCFS ~$150/MT in 2024) and BIL (~$1.2T; ~$110B roads) alter asphalt demand and compliance costs.
| Metric | 2024/2025 |
|---|---|
| US crude | ~13.2 mb/d |
| Brent | ~$86/b |
| LCFS price | ~$150/MT |
| BIL | $1.2T (roads ~$110B) |
| Canada crude to US | ~3.9 mb/d |
| Mexico product imports | ~0.9 mb/d |
| Steel tariff | 25% (Sec 232) |
What is included in the product
 Detailed Word Document
Explores how Political, Economic, Social, Technological, Environmental and Legal forces uniquely affect Delek US Holdings, with data-backed trends and sector-specific examples; designed to inform executives, investors and strategists with forward-looking insights that reflect current market and regulatory dynamics for scenario planning and opportunity/threat identification.

 Customizable Excel Spreadsheet
A concise, visually segmented PESTLE summary for Delek US Holdings that streamlines external risk assessment and market positioning, perfect for quick drop-in slides, team alignment, or consultant reports. Compatible with tablets and Excel, it lets users add notes by region or business line for faster, actionable planning.
Economic factors

Refining crack spreads and demand cycles
Gasoline, diesel and jet margins are cyclical and tied to GDP (US real GDP ~2.4% in 2024) and mobility trends; 3-2-1 crack spreads averaged historically near $15–25/b across 2023–24, driving earnings volatility. Seasonal demand and inventories (EIA weekly stocks swings >10M bbl) amplify price swings. Optimizing product mix and turnaround timing stabilizes cash flow, and margin capture remains the primary driver of Delek US’s refining earnings power.
Crude differentials and logistics costs
WTI Midland averaged a $8–12/bbl discount to Gulf Coast/coastal benchmarks in H1 2025, shaping feedstock economics for Delek US’s ~190 kbpd refining system. Pipeline tolls ran roughly $3–6/bbl while rail costs averaged $12–18/bbl and trucking $4–7/bbl, directly affecting delivered crude and product margins. Owning logistics capacity reduces basis risk and bottlenecks, and tighter scheduling has improved system netbacks by several dollars per barrel.

Interest rates and capital availability
Higher U.S. policy rates of 5.25–5.50% (July 2025) raise debt service and push hurdle rates for refinery upgrades and retail rollouts, increasing capex discounting. Tight credit and higher commercial paper/ABL costs squeeze inventory financing and hedging liquidity, with short-term funding spreads up roughly 150 bps vs 2021. Prudent leverage and staggered maturities preserve flexibility. Counter-cyclical investment can capture distressed assets when spreads widen.

Labor and operating costs inflation
Labor and operating cost inflation—wages, maintenance, and parts—has lifted Delek US unit costs, with US private-sector wage growth running near 4% YoY in 2024 (BLS ECI). Tight skilled-labor markets hinder turnaround execution, per persistent sectoral shortages in 2024 JOLTS data. Vendor diversification and predictive maintenance can curb cost creep, while state-level minimum wage hikes in 2024 pressured retail fuel-store margins.
- Wages: ~4% YoY (BLS ECI 2024)
- Maintenance/parts: upward pressure on unit costs
- Labor: skilled shortages impede turnarounds (2024 JOLTS)
- Mitigants: vendor diversification, predictive maintenance
- Retail: state 2024 wage hikes cut store profitability
Infrastructure spending and construction cycles
Public and private construction activity, supported by the Bipartisan Infrastructure Law's $550 billion of new investment through 2026, drives asphalt demand and pricing, while timing of federal and state disbursements creates volume lumpiness that affects quarterly throughput. Bidding discipline and Delek US regional positioning in the Southeast and Texas improve product mix and margins, and counter-seasonal contracting helps smooth plant utilization across winter months.
- IIJA funding: $550 billion through 2026
- Regional focus: Southeast and Texas — higher paving volumes
- Volume risk: government disbursement timing causes lumpiness
- Mitigation: disciplined bidding and counter-seasonal contracts
IRA, LCFS and BIL reshape refinery capex; Brent $86, US crude ~13.2 mb/d
Economic drivers: GDP ~2.4% (2024) and cyclical crack spreads ($15–25/b 2023–24) create earnings volatility; mobility and seasonal inventory swings (EIA weekly ±10M bbl) amplify margins. Feedstock economics: WTI Midland discount $8–12/b (H1 2025); logistics costs add $3–18/b. Rates 5.25–5.50% (Jul 2025) lift financing costs; wages ~4% YoY (2024) raise operating expenses.
| Metric | Value |
|---|---|
| US GDP 2024 | 2.4% |
| Crack spreads | $15–25/b |
| WTI Midland disc. | $8–12/b |
| Policy rate Jul 2025 | 5.25–5.50% |
| Wage growth 2024 | ~4% |
What You See Is What You Get
Delek US Holdings PESTLE Analysis
The Delek US Holdings PESTLE Analysis provides a concise evaluation of political, economic, social, technological, legal, and environmental factors affecting the company, with actionable implications for strategy and risk. The preview shown here is the exact document you’ll receive after purchase—fully formatted and ready to use. No placeholders, no surprises.

Your Shortcut to Market Insight Starts Here
Gain strategic clarity with our focused PESTLE analysis of Delek US Holdings—examining political, economic, social, technological, legal and environmental forces shaping its margins and growth prospects. Ideal for investors and strategists, this concise review flags key risks and opportunities. Purchase the full, editable report to get the complete, actionable insights instantly.
Political factors
U.S. energy policy shifts
Federal shifts balancing energy security with decarbonization alter refinery utilization and capital planning; US crude production averaged about 13.2 million bpd in 2024 (EIA), keeping feedstock tight while policy pushes low‑carbon fuels. IRA-era incentives—SAF/blender credits up to $1.75/gal—plus greater scrutiny of fossil assets redirect capital toward low‑carbon projects. Administrative stances on pipelines, leasing and permitting can materially affect crude access; Delek must stay agile across election cycles.
Geopolitical crude supply risk
Sanctions, Middle East tensions and OPEC+ supply decisions (which moved seaborne flows by over 1 million b/d in 2024) have widened crude differentials and strained supply reliability, directly affecting Delek US feedstock costs while Brent averaged about $86/b in 2024. Refinery margins hinge on feedstock availability and quality spreads; US refinery utilization ran near 91% in 2024. Diversifying crude slates and hedging logistics becomes critical to secure throughput and constrain volatility, and active political risk management protects throughput and profitability.
State-level regulations and incentives
Refinery, retail fuel and asphalt operations face divergent state rules on emissions, fuel specs and labor that can materially affect margins and operating costs. Low-carbon standards such as LCFS create tradable credits or compliance costs—LCFS credit prices averaged around $150/MT in 2024. State infrastructure funding (federally backed BIL ~$110B for roads/bridges) supports higher asphalt demand. Site-specific political climates shape permitting timelines (months to years) and community relations.
Infrastructure and transportation policy
Federal Bipartisan Infrastructure Law commits roughly 1.2 trillion USD with about 110 billion USD for roads and bridges, directly supporting asphalt volumes and margins for Delek US; pipeline expansions or stricter rail safety rules (U.S. freight rail ~1.6 trillion ton‑miles annually) shift logistics costs and modal mix; trucking and marine fuel regulations influence diesel and bunker demand and refining margins; coordinated industry advocacy can align Delek US supply chains with public works agendas.
- Infrastructure spending: 1.2 trillion USD (BIL), ~110B for roads/bridges
- Freight rail scale: ~1.6 trillion ton‑miles/yr
- Logistics policy alters modal cost and diesel/bunker demand
- Advocacy can secure feedstock and product demand from public works
Trade and tariff regimes
Tariffs such as the 25% Section 232 steel duty and other equipment levies directly raise Delek US capital expenditure and can widen costs versus untariffed competitors; U.S. crude imports from Canada averaged about 3.9 million b/d in 2024 (EIA), shaping feedstock sourcing and refinery runs. Cross-border flows and roughly 0.9 million b/d of U.S. refined product exports to Mexico in 2024 (EIA) influence export opportunities; policy shifts can rapidly reprice arbitrage windows, so vigilant trade compliance preserves margins and market access.
- tariff: 25% steel (Section 232)
- canada crude: ~3.9 mb/d (2024, EIA)
- mexico product imports: ~0.9 mb/d (2024, EIA)
- priority: trade compliance to protect margins
IRA, LCFS and BIL reshape refinery capex; Brent $86, US crude ~13.2 mb/d
Federal energy policy, IRA incentives (SAF/blender credit up to $1.75/gal) and 2024 US crude ~13.2 mb/d reshape refinery capex and feedstock planning. Geopolitical shocks and OPEC+ moves widened differentials; Brent ~ $86/b in 2024. State regs (LCFS ~$150/MT in 2024) and BIL (~$1.2T; ~$110B roads) alter asphalt demand and compliance costs.
| Metric | 2024/2025 |
|---|---|
| US crude | ~13.2 mb/d |
| Brent | ~$86/b |
| LCFS price | ~$150/MT |
| BIL | $1.2T (roads ~$110B) |
| Canada crude to US | ~3.9 mb/d |
| Mexico product imports | ~0.9 mb/d |
| Steel tariff | 25% (Sec 232) |
What is included in the product
Detailed Word Document
Explores how Political, Economic, Social, Technological, Environmental and Legal forces uniquely affect Delek US Holdings, with data-backed trends and sector-specific examples; designed to inform executives, investors and strategists with forward-looking insights that reflect current market and regulatory dynamics for scenario planning and opportunity/threat identification.
Customizable Excel Spreadsheet
A concise, visually segmented PESTLE summary for Delek US Holdings that streamlines external risk assessment and market positioning, perfect for quick drop-in slides, team alignment, or consultant reports. Compatible with tablets and Excel, it lets users add notes by region or business line for faster, actionable planning.
Economic factors
Refining crack spreads and demand cycles
Gasoline, diesel and jet margins are cyclical and tied to GDP (US real GDP ~2.4% in 2024) and mobility trends; 3-2-1 crack spreads averaged historically near $15–25/b across 2023–24, driving earnings volatility. Seasonal demand and inventories (EIA weekly stocks swings >10M bbl) amplify price swings. Optimizing product mix and turnaround timing stabilizes cash flow, and margin capture remains the primary driver of Delek US’s refining earnings power.
Crude differentials and logistics costs
WTI Midland averaged a $8–12/bbl discount to Gulf Coast/coastal benchmarks in H1 2025, shaping feedstock economics for Delek US’s ~190 kbpd refining system. Pipeline tolls ran roughly $3–6/bbl while rail costs averaged $12–18/bbl and trucking $4–7/bbl, directly affecting delivered crude and product margins. Owning logistics capacity reduces basis risk and bottlenecks, and tighter scheduling has improved system netbacks by several dollars per barrel.
Interest rates and capital availability
Higher U.S. policy rates of 5.25–5.50% (July 2025) raise debt service and push hurdle rates for refinery upgrades and retail rollouts, increasing capex discounting. Tight credit and higher commercial paper/ABL costs squeeze inventory financing and hedging liquidity, with short-term funding spreads up roughly 150 bps vs 2021. Prudent leverage and staggered maturities preserve flexibility. Counter-cyclical investment can capture distressed assets when spreads widen.
Labor and operating costs inflation
Labor and operating cost inflation—wages, maintenance, and parts—has lifted Delek US unit costs, with US private-sector wage growth running near 4% YoY in 2024 (BLS ECI). Tight skilled-labor markets hinder turnaround execution, per persistent sectoral shortages in 2024 JOLTS data. Vendor diversification and predictive maintenance can curb cost creep, while state-level minimum wage hikes in 2024 pressured retail fuel-store margins.
- Wages: ~4% YoY (BLS ECI 2024)
- Maintenance/parts: upward pressure on unit costs
- Labor: skilled shortages impede turnarounds (2024 JOLTS)
- Mitigants: vendor diversification, predictive maintenance
- Retail: state 2024 wage hikes cut store profitability
Infrastructure spending and construction cycles
Public and private construction activity, supported by the Bipartisan Infrastructure Law's $550 billion of new investment through 2026, drives asphalt demand and pricing, while timing of federal and state disbursements creates volume lumpiness that affects quarterly throughput. Bidding discipline and Delek US regional positioning in the Southeast and Texas improve product mix and margins, and counter-seasonal contracting helps smooth plant utilization across winter months.
- IIJA funding: $550 billion through 2026
- Regional focus: Southeast and Texas — higher paving volumes
- Volume risk: government disbursement timing causes lumpiness
- Mitigation: disciplined bidding and counter-seasonal contracts
IRA, LCFS and BIL reshape refinery capex; Brent $86, US crude ~13.2 mb/d
Economic drivers: GDP ~2.4% (2024) and cyclical crack spreads ($15–25/b 2023–24) create earnings volatility; mobility and seasonal inventory swings (EIA weekly ±10M bbl) amplify margins. Feedstock economics: WTI Midland discount $8–12/b (H1 2025); logistics costs add $3–18/b. Rates 5.25–5.50% (Jul 2025) lift financing costs; wages ~4% YoY (2024) raise operating expenses.
| Metric | Value |
|---|---|
| US GDP 2024 | 2.4% |
| Crack spreads | $15–25/b |
| WTI Midland disc. | $8–12/b |
| Policy rate Jul 2025 | 5.25–5.50% |
| Wage growth 2024 | ~4% |
What You See Is What You Get
Delek US Holdings PESTLE Analysis
The Delek US Holdings PESTLE Analysis provides a concise evaluation of political, economic, social, technological, legal, and environmental factors affecting the company, with actionable implications for strategy and risk. The preview shown here is the exact document you’ll receive after purchase—fully formatted and ready to use. No placeholders, no surprises.
Original: $10.00
-65%$10.00
$3.50Description
Your Shortcut to Market Insight Starts Here
Gain strategic clarity with our focused PESTLE analysis of Delek US Holdings—examining political, economic, social, technological, legal and environmental forces shaping its margins and growth prospects. Ideal for investors and strategists, this concise review flags key risks and opportunities. Purchase the full, editable report to get the complete, actionable insights instantly.
Political factors
U.S. energy policy shifts
Federal shifts balancing energy security with decarbonization alter refinery utilization and capital planning; US crude production averaged about 13.2 million bpd in 2024 (EIA), keeping feedstock tight while policy pushes low‑carbon fuels. IRA-era incentives—SAF/blender credits up to $1.75/gal—plus greater scrutiny of fossil assets redirect capital toward low‑carbon projects. Administrative stances on pipelines, leasing and permitting can materially affect crude access; Delek must stay agile across election cycles.
Geopolitical crude supply risk
Sanctions, Middle East tensions and OPEC+ supply decisions (which moved seaborne flows by over 1 million b/d in 2024) have widened crude differentials and strained supply reliability, directly affecting Delek US feedstock costs while Brent averaged about $86/b in 2024. Refinery margins hinge on feedstock availability and quality spreads; US refinery utilization ran near 91% in 2024. Diversifying crude slates and hedging logistics becomes critical to secure throughput and constrain volatility, and active political risk management protects throughput and profitability.
State-level regulations and incentives
Refinery, retail fuel and asphalt operations face divergent state rules on emissions, fuel specs and labor that can materially affect margins and operating costs. Low-carbon standards such as LCFS create tradable credits or compliance costs—LCFS credit prices averaged around $150/MT in 2024. State infrastructure funding (federally backed BIL ~$110B for roads/bridges) supports higher asphalt demand. Site-specific political climates shape permitting timelines (months to years) and community relations.
Infrastructure and transportation policy
Federal Bipartisan Infrastructure Law commits roughly 1.2 trillion USD with about 110 billion USD for roads and bridges, directly supporting asphalt volumes and margins for Delek US; pipeline expansions or stricter rail safety rules (U.S. freight rail ~1.6 trillion ton‑miles annually) shift logistics costs and modal mix; trucking and marine fuel regulations influence diesel and bunker demand and refining margins; coordinated industry advocacy can align Delek US supply chains with public works agendas.
- Infrastructure spending: 1.2 trillion USD (BIL), ~110B for roads/bridges
- Freight rail scale: ~1.6 trillion ton‑miles/yr
- Logistics policy alters modal cost and diesel/bunker demand
- Advocacy can secure feedstock and product demand from public works
Trade and tariff regimes
Tariffs such as the 25% Section 232 steel duty and other equipment levies directly raise Delek US capital expenditure and can widen costs versus untariffed competitors; U.S. crude imports from Canada averaged about 3.9 million b/d in 2024 (EIA), shaping feedstock sourcing and refinery runs. Cross-border flows and roughly 0.9 million b/d of U.S. refined product exports to Mexico in 2024 (EIA) influence export opportunities; policy shifts can rapidly reprice arbitrage windows, so vigilant trade compliance preserves margins and market access.
- tariff: 25% steel (Section 232)
- canada crude: ~3.9 mb/d (2024, EIA)
- mexico product imports: ~0.9 mb/d (2024, EIA)
- priority: trade compliance to protect margins
IRA, LCFS and BIL reshape refinery capex; Brent $86, US crude ~13.2 mb/d
Federal energy policy, IRA incentives (SAF/blender credit up to $1.75/gal) and 2024 US crude ~13.2 mb/d reshape refinery capex and feedstock planning. Geopolitical shocks and OPEC+ moves widened differentials; Brent ~ $86/b in 2024. State regs (LCFS ~$150/MT in 2024) and BIL (~$1.2T; ~$110B roads) alter asphalt demand and compliance costs.
| Metric | 2024/2025 |
|---|---|
| US crude | ~13.2 mb/d |
| Brent | ~$86/b |
| LCFS price | ~$150/MT |
| BIL | $1.2T (roads ~$110B) |
| Canada crude to US | ~3.9 mb/d |
| Mexico product imports | ~0.9 mb/d |
| Steel tariff | 25% (Sec 232) |
What is included in the product
Detailed Word Document
Explores how Political, Economic, Social, Technological, Environmental and Legal forces uniquely affect Delek US Holdings, with data-backed trends and sector-specific examples; designed to inform executives, investors and strategists with forward-looking insights that reflect current market and regulatory dynamics for scenario planning and opportunity/threat identification.
Customizable Excel Spreadsheet
A concise, visually segmented PESTLE summary for Delek US Holdings that streamlines external risk assessment and market positioning, perfect for quick drop-in slides, team alignment, or consultant reports. Compatible with tablets and Excel, it lets users add notes by region or business line for faster, actionable planning.
Economic factors
Refining crack spreads and demand cycles
Gasoline, diesel and jet margins are cyclical and tied to GDP (US real GDP ~2.4% in 2024) and mobility trends; 3-2-1 crack spreads averaged historically near $15–25/b across 2023–24, driving earnings volatility. Seasonal demand and inventories (EIA weekly stocks swings >10M bbl) amplify price swings. Optimizing product mix and turnaround timing stabilizes cash flow, and margin capture remains the primary driver of Delek US’s refining earnings power.
Crude differentials and logistics costs
WTI Midland averaged a $8–12/bbl discount to Gulf Coast/coastal benchmarks in H1 2025, shaping feedstock economics for Delek US’s ~190 kbpd refining system. Pipeline tolls ran roughly $3–6/bbl while rail costs averaged $12–18/bbl and trucking $4–7/bbl, directly affecting delivered crude and product margins. Owning logistics capacity reduces basis risk and bottlenecks, and tighter scheduling has improved system netbacks by several dollars per barrel.
Interest rates and capital availability
Higher U.S. policy rates of 5.25–5.50% (July 2025) raise debt service and push hurdle rates for refinery upgrades and retail rollouts, increasing capex discounting. Tight credit and higher commercial paper/ABL costs squeeze inventory financing and hedging liquidity, with short-term funding spreads up roughly 150 bps vs 2021. Prudent leverage and staggered maturities preserve flexibility. Counter-cyclical investment can capture distressed assets when spreads widen.
Labor and operating costs inflation
Labor and operating cost inflation—wages, maintenance, and parts—has lifted Delek US unit costs, with US private-sector wage growth running near 4% YoY in 2024 (BLS ECI). Tight skilled-labor markets hinder turnaround execution, per persistent sectoral shortages in 2024 JOLTS data. Vendor diversification and predictive maintenance can curb cost creep, while state-level minimum wage hikes in 2024 pressured retail fuel-store margins.
- Wages: ~4% YoY (BLS ECI 2024)
- Maintenance/parts: upward pressure on unit costs
- Labor: skilled shortages impede turnarounds (2024 JOLTS)
- Mitigants: vendor diversification, predictive maintenance
- Retail: state 2024 wage hikes cut store profitability
Infrastructure spending and construction cycles
Public and private construction activity, supported by the Bipartisan Infrastructure Law's $550 billion of new investment through 2026, drives asphalt demand and pricing, while timing of federal and state disbursements creates volume lumpiness that affects quarterly throughput. Bidding discipline and Delek US regional positioning in the Southeast and Texas improve product mix and margins, and counter-seasonal contracting helps smooth plant utilization across winter months.
- IIJA funding: $550 billion through 2026
- Regional focus: Southeast and Texas — higher paving volumes
- Volume risk: government disbursement timing causes lumpiness
- Mitigation: disciplined bidding and counter-seasonal contracts
IRA, LCFS and BIL reshape refinery capex; Brent $86, US crude ~13.2 mb/d
Economic drivers: GDP ~2.4% (2024) and cyclical crack spreads ($15–25/b 2023–24) create earnings volatility; mobility and seasonal inventory swings (EIA weekly ±10M bbl) amplify margins. Feedstock economics: WTI Midland discount $8–12/b (H1 2025); logistics costs add $3–18/b. Rates 5.25–5.50% (Jul 2025) lift financing costs; wages ~4% YoY (2024) raise operating expenses.
| Metric | Value |
|---|---|
| US GDP 2024 | 2.4% |
| Crack spreads | $15–25/b |
| WTI Midland disc. | $8–12/b |
| Policy rate Jul 2025 | 5.25–5.50% |
| Wage growth 2024 | ~4% |
What You See Is What You Get
Delek US Holdings PESTLE Analysis
The Delek US Holdings PESTLE Analysis provides a concise evaluation of political, economic, social, technological, legal, and environmental factors affecting the company, with actionable implications for strategy and risk. The preview shown here is the exact document you’ll receive after purchase—fully formatted and ready to use. No placeholders, no surprises.











