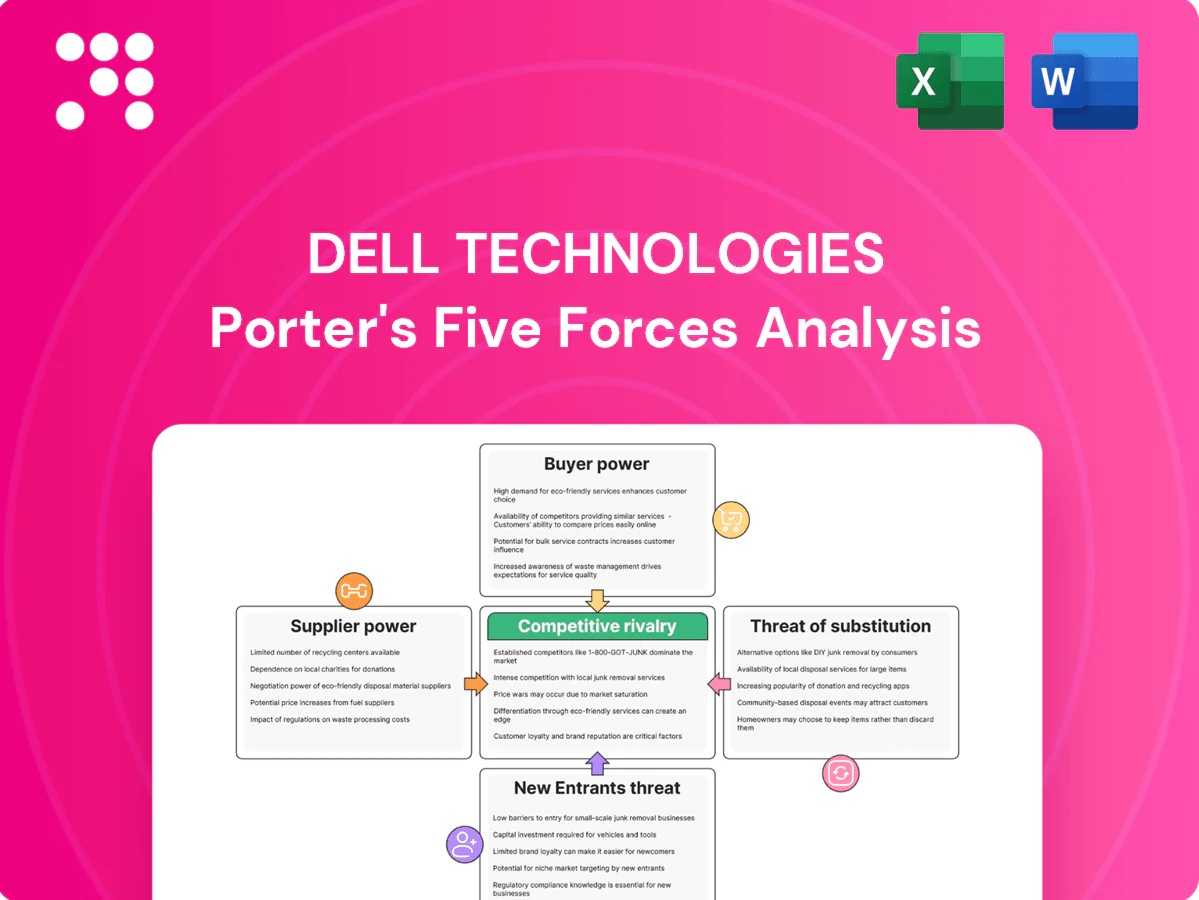
Dell Technologies Porter's Five Forces Analysis

Elevate Your Analysis with the Complete Porter's Five Forces Analysis
Dell Technologies faces intense competitive rivalry from HP, Lenovo and cloud providers, with buyer power elevated by enterprise scale and procurement cycles; supplier power is moderate due to component concentration, while substitutes and new entrants pose limited but evolving threats. This brief snapshot only scratches the surface. Unlock the full Porter's Five Forces Analysis to explore Dell’s competitive dynamics in detail.
Suppliers Bargaining Power

Concentrated chip suppliers
Core CPUs/GPUs come from a few vendors—Intel (~60%) and AMD (~40%) dominate server CPUs in 2024, while NVIDIA holds >90% of datacenter GPUs—giving suppliers pricing, allocation and roadmap leverage; node transitions or capacity squeezes tighten OEM terms. Dell mitigates with multi-sourcing and tight demand forecasting, but dependence persists and sudden performance leadership shifts force rapid platform pivots.
Memory and storage volatility
DRAM and NAND markets are cyclical, driving input-cost swings that compress OEM gross margins. Suppliers often prioritize larger strategic buyers during shortages, tightening access for smaller customers. Dell, which reported FY2024 revenue of 101.2 billion dollars, uses hedging, diversified sourcing and design flexibility to manage swings. Sudden price spikes can still sharply compress profitability.

ODM/EMS manufacturing reliance
Contract manufacturers and ODMs materially shape lead times, capacity and cost for Dell, with FY2024 revenue around $101 billion giving Dell bargaining leverage but not full insulation.
Switching partners is costly and slow due to tooling, certifications and quality controls, keeping supplier hold high.
Tight global EMS capacity—utilization above 80% in 2024—and concentration in China/Taiwan magnify supplier and geopolitical risk.

Software and OS dependencies
Key OS and platform licenses (Windows holds ~76% global desktop share in 2024) impose significant licensing fees and compliance terms that affect Dell’s margins and channel pricing. Feature availability and limited vendor support windows directly shape product value and upgrade cycles. Partner co-selling agreements with Microsoft and others reduce supplier leverage, yet rigorous certification requirements create durable customer stickiness.
- OS market share: Windows ~76% (StatCounter, 2024)
- Licensing/compliance: non-trivial fees affect margins
- Co-selling: mitigates supplier power
- Certifications: increase switching costs
Logistics and component constraints
Shipping, semiconductors, and specialty components (NICs, PSUs) can bottleneck supply; carriers and niche parts vendors gain leverage during disruptions. Dell’s global logistics network and $101.2B FY2024 scale improve allocation, yet surcharges and delays can raise COGS. Risk pooling and buffer inventory only partially mitigate these shocks.
- Carriers/niche vendors: higher bargaining power in disruptions
- Surcharges/delays: upward pressure on COGS
- Logistics scale helps but does not eliminate shortages
Concentrated suppliers (GPUs >90%, CPUs ~60/40) amplify pricing power
Supplier concentration (Intel ~60%/AMD ~40% server CPUs; NVIDIA >90% datacenter GPUs, 2024) and cyclical DRAM/NAND pricing give suppliers pricing and allocation leverage; Dell FY2024 revenue $101.2B and multi-sourcing mitigate but do not remove risk. EMS utilization >80% (2024) and Windows ~76% desktop share raise switching costs and licensing exposure.
| Metric | 2024 value | Impact |
|---|---|---|
| FY Revenue | $101.2B | Bargaining leverage |
| Datacenter GPUs | >90% | Supplier pricing power |
| EMS utilization | >80% | Lead-time risk |
| Windows share | ~76% | Licensing dependence |
What is included in the product
 Detailed Word Document
Tailored Porter's Five Forces analysis of Dell Technologies revealing competitive intensity, buyer and supplier power, threat of new entrants and substitutes, and strategic levers that protect or erode its market position. Highlights disruptive threats, pricing pressures, and entry barriers with actionable insights for investors and strategists.

 Customizable Excel Spreadsheet
A compact Dell Technologies Porter's Five Forces one-sheet that instantly reveals competitive pressure and strategic risks for quick decision-making. Customize force levels, swap in your data, and drop the clean spider chart into pitch decks or dashboards for immediate boardroom-ready insight.
Customers Bargaining Power

Large enterprise procurement
Large enterprise procurement secures deep volume discounts and strict SLAs, leveraging concentrated buying power across global accounts. Gartner estimated worldwide IT spending at about 4.9 trillion USD in 2024, amplifying competitive bidding among OEMs and persistent downward price pressure. Dell offsets this through custom configurations and services, yet renewal cycles frequently reset terms aggressively.
Channel partners and resellers
Distributors and VARs shape end-customer choice and margins by demanding rebates, marketing development funds (MDF) and flexible credit terms, forcing Dell to absorb part of channel economics. Dell reported $101.2 billion revenue in FY2024 and leverages partner programs to expand reach but shares revenue and margin with resellers. The availability of strong channel alternatives (other OEM ecosystems and cloud-native suppliers) heightens buyer leverage and pricing pressure.

Commoditized client devices
Desktops and notebooks face feature parity, driving price sensitivity and easy cross-brand comparisons that increase switching; Dell reported fiscal 2024 revenue of $101.2 billion, underscoring scale but thin margins. Dell offsets pressure with fleet management, extended warranties and financing programs. Persistent TCO focus from buyers keeps pricing under sustained pressure.

Multi-sourcing and standardized RFPs
IT buyers increasingly split awards to avoid lock-in and ensure supply, forcing suppliers like Dell—which reported $101.2 billion in FY2024 revenue—to compete across fragmented RFPs; standardized specs enable apples-to-apples comparisons so decisions hinge on service, delivery, and lifecycle value.
- Multi-sourcing pressure
- Standardized RFPs = price transparency
- Win on service & delivery
- Lifecycle value compresses margins on large deals
Shift to as-a-service expectations
Customers increasingly demand opex, elastic and outcome-based contracts, negotiating term flexibility and usage-based pricing; Dell’s APEX and managed services address this shift while buyers use public cloud benchmarks to push terms, elevating ongoing bargaining power—public cloud spend approached $620B in 2024 (Gartner), tightening price/feature comparisons.
- Opex preference
- Usage-based pricing
- Cloud benchmarks raise leverage
Enterprise buyers and cloud parity squeeze vendor margins, driving shift to opex models
Large enterprise buyers and channels exert strong leverage—Gartner 2024 IT spend ~$4.9T and Dell FY2024 revenue $101.2B create concentrated procurement and aggressive price/reset cycles. Feature parity in PCs and cloud benchmarks (public cloud ~$620B in 2024) raise switching and price pressure, pushing buyers toward opex/usage models. Dell mitigates via APEX, services, financing and partner programs but margins remain compressed.
| Metric | 2024 Value |
|---|---|
| Dell revenue (FY) | $101.2B |
| Global IT spend | $4.9T |
| Public cloud spend | $620B |
What You See Is What You Get
Dell Technologies Porter's Five Forces Analysis
This preview shows the exact Dell Technologies Porter's Five Forces Analysis you'll receive immediately after purchase—no surprises, no placeholders. The document displayed is the full, professionally formatted analysis ready for download and immediate use once you buy. You're viewing the actual deliverable; instant access is granted at payment.

Elevate Your Analysis with the Complete Porter's Five Forces Analysis
Dell Technologies faces intense competitive rivalry from HP, Lenovo and cloud providers, with buyer power elevated by enterprise scale and procurement cycles; supplier power is moderate due to component concentration, while substitutes and new entrants pose limited but evolving threats. This brief snapshot only scratches the surface. Unlock the full Porter's Five Forces Analysis to explore Dell’s competitive dynamics in detail.
Suppliers Bargaining Power
Concentrated chip suppliers
Core CPUs/GPUs come from a few vendors—Intel (~60%) and AMD (~40%) dominate server CPUs in 2024, while NVIDIA holds >90% of datacenter GPUs—giving suppliers pricing, allocation and roadmap leverage; node transitions or capacity squeezes tighten OEM terms. Dell mitigates with multi-sourcing and tight demand forecasting, but dependence persists and sudden performance leadership shifts force rapid platform pivots.
Memory and storage volatility
DRAM and NAND markets are cyclical, driving input-cost swings that compress OEM gross margins. Suppliers often prioritize larger strategic buyers during shortages, tightening access for smaller customers. Dell, which reported FY2024 revenue of 101.2 billion dollars, uses hedging, diversified sourcing and design flexibility to manage swings. Sudden price spikes can still sharply compress profitability.
ODM/EMS manufacturing reliance
Contract manufacturers and ODMs materially shape lead times, capacity and cost for Dell, with FY2024 revenue around $101 billion giving Dell bargaining leverage but not full insulation.
Switching partners is costly and slow due to tooling, certifications and quality controls, keeping supplier hold high.
Tight global EMS capacity—utilization above 80% in 2024—and concentration in China/Taiwan magnify supplier and geopolitical risk.
Software and OS dependencies
Key OS and platform licenses (Windows holds ~76% global desktop share in 2024) impose significant licensing fees and compliance terms that affect Dell’s margins and channel pricing. Feature availability and limited vendor support windows directly shape product value and upgrade cycles. Partner co-selling agreements with Microsoft and others reduce supplier leverage, yet rigorous certification requirements create durable customer stickiness.
- OS market share: Windows ~76% (StatCounter, 2024)
- Licensing/compliance: non-trivial fees affect margins
- Co-selling: mitigates supplier power
- Certifications: increase switching costs
Logistics and component constraints
Shipping, semiconductors, and specialty components (NICs, PSUs) can bottleneck supply; carriers and niche parts vendors gain leverage during disruptions. Dell’s global logistics network and $101.2B FY2024 scale improve allocation, yet surcharges and delays can raise COGS. Risk pooling and buffer inventory only partially mitigate these shocks.
- Carriers/niche vendors: higher bargaining power in disruptions
- Surcharges/delays: upward pressure on COGS
- Logistics scale helps but does not eliminate shortages
Concentrated suppliers (GPUs >90%, CPUs ~60/40) amplify pricing power
Supplier concentration (Intel ~60%/AMD ~40% server CPUs; NVIDIA >90% datacenter GPUs, 2024) and cyclical DRAM/NAND pricing give suppliers pricing and allocation leverage; Dell FY2024 revenue $101.2B and multi-sourcing mitigate but do not remove risk. EMS utilization >80% (2024) and Windows ~76% desktop share raise switching costs and licensing exposure.
| Metric | 2024 value | Impact |
|---|---|---|
| FY Revenue | $101.2B | Bargaining leverage |
| Datacenter GPUs | >90% | Supplier pricing power |
| EMS utilization | >80% | Lead-time risk |
| Windows share | ~76% | Licensing dependence |
What is included in the product
Detailed Word Document
Tailored Porter's Five Forces analysis of Dell Technologies revealing competitive intensity, buyer and supplier power, threat of new entrants and substitutes, and strategic levers that protect or erode its market position. Highlights disruptive threats, pricing pressures, and entry barriers with actionable insights for investors and strategists.
Customizable Excel Spreadsheet
A compact Dell Technologies Porter's Five Forces one-sheet that instantly reveals competitive pressure and strategic risks for quick decision-making. Customize force levels, swap in your data, and drop the clean spider chart into pitch decks or dashboards for immediate boardroom-ready insight.
Customers Bargaining Power
Large enterprise procurement
Large enterprise procurement secures deep volume discounts and strict SLAs, leveraging concentrated buying power across global accounts. Gartner estimated worldwide IT spending at about 4.9 trillion USD in 2024, amplifying competitive bidding among OEMs and persistent downward price pressure. Dell offsets this through custom configurations and services, yet renewal cycles frequently reset terms aggressively.
Channel partners and resellers
Distributors and VARs shape end-customer choice and margins by demanding rebates, marketing development funds (MDF) and flexible credit terms, forcing Dell to absorb part of channel economics. Dell reported $101.2 billion revenue in FY2024 and leverages partner programs to expand reach but shares revenue and margin with resellers. The availability of strong channel alternatives (other OEM ecosystems and cloud-native suppliers) heightens buyer leverage and pricing pressure.
Commoditized client devices
Desktops and notebooks face feature parity, driving price sensitivity and easy cross-brand comparisons that increase switching; Dell reported fiscal 2024 revenue of $101.2 billion, underscoring scale but thin margins. Dell offsets pressure with fleet management, extended warranties and financing programs. Persistent TCO focus from buyers keeps pricing under sustained pressure.
Multi-sourcing and standardized RFPs
IT buyers increasingly split awards to avoid lock-in and ensure supply, forcing suppliers like Dell—which reported $101.2 billion in FY2024 revenue—to compete across fragmented RFPs; standardized specs enable apples-to-apples comparisons so decisions hinge on service, delivery, and lifecycle value.
- Multi-sourcing pressure
- Standardized RFPs = price transparency
- Win on service & delivery
- Lifecycle value compresses margins on large deals
Shift to as-a-service expectations
Customers increasingly demand opex, elastic and outcome-based contracts, negotiating term flexibility and usage-based pricing; Dell’s APEX and managed services address this shift while buyers use public cloud benchmarks to push terms, elevating ongoing bargaining power—public cloud spend approached $620B in 2024 (Gartner), tightening price/feature comparisons.
- Opex preference
- Usage-based pricing
- Cloud benchmarks raise leverage
Enterprise buyers and cloud parity squeeze vendor margins, driving shift to opex models
Large enterprise buyers and channels exert strong leverage—Gartner 2024 IT spend ~$4.9T and Dell FY2024 revenue $101.2B create concentrated procurement and aggressive price/reset cycles. Feature parity in PCs and cloud benchmarks (public cloud ~$620B in 2024) raise switching and price pressure, pushing buyers toward opex/usage models. Dell mitigates via APEX, services, financing and partner programs but margins remain compressed.
| Metric | 2024 Value |
|---|---|
| Dell revenue (FY) | $101.2B |
| Global IT spend | $4.9T |
| Public cloud spend | $620B |
What You See Is What You Get
Dell Technologies Porter's Five Forces Analysis
This preview shows the exact Dell Technologies Porter's Five Forces Analysis you'll receive immediately after purchase—no surprises, no placeholders. The document displayed is the full, professionally formatted analysis ready for download and immediate use once you buy. You're viewing the actual deliverable; instant access is granted at payment.
Original: $10.00
-65%$10.00
$3.50Description
Elevate Your Analysis with the Complete Porter's Five Forces Analysis
Dell Technologies faces intense competitive rivalry from HP, Lenovo and cloud providers, with buyer power elevated by enterprise scale and procurement cycles; supplier power is moderate due to component concentration, while substitutes and new entrants pose limited but evolving threats. This brief snapshot only scratches the surface. Unlock the full Porter's Five Forces Analysis to explore Dell’s competitive dynamics in detail.
Suppliers Bargaining Power
Concentrated chip suppliers
Core CPUs/GPUs come from a few vendors—Intel (~60%) and AMD (~40%) dominate server CPUs in 2024, while NVIDIA holds >90% of datacenter GPUs—giving suppliers pricing, allocation and roadmap leverage; node transitions or capacity squeezes tighten OEM terms. Dell mitigates with multi-sourcing and tight demand forecasting, but dependence persists and sudden performance leadership shifts force rapid platform pivots.
Memory and storage volatility
DRAM and NAND markets are cyclical, driving input-cost swings that compress OEM gross margins. Suppliers often prioritize larger strategic buyers during shortages, tightening access for smaller customers. Dell, which reported FY2024 revenue of 101.2 billion dollars, uses hedging, diversified sourcing and design flexibility to manage swings. Sudden price spikes can still sharply compress profitability.
ODM/EMS manufacturing reliance
Contract manufacturers and ODMs materially shape lead times, capacity and cost for Dell, with FY2024 revenue around $101 billion giving Dell bargaining leverage but not full insulation.
Switching partners is costly and slow due to tooling, certifications and quality controls, keeping supplier hold high.
Tight global EMS capacity—utilization above 80% in 2024—and concentration in China/Taiwan magnify supplier and geopolitical risk.
Software and OS dependencies
Key OS and platform licenses (Windows holds ~76% global desktop share in 2024) impose significant licensing fees and compliance terms that affect Dell’s margins and channel pricing. Feature availability and limited vendor support windows directly shape product value and upgrade cycles. Partner co-selling agreements with Microsoft and others reduce supplier leverage, yet rigorous certification requirements create durable customer stickiness.
- OS market share: Windows ~76% (StatCounter, 2024)
- Licensing/compliance: non-trivial fees affect margins
- Co-selling: mitigates supplier power
- Certifications: increase switching costs
Logistics and component constraints
Shipping, semiconductors, and specialty components (NICs, PSUs) can bottleneck supply; carriers and niche parts vendors gain leverage during disruptions. Dell’s global logistics network and $101.2B FY2024 scale improve allocation, yet surcharges and delays can raise COGS. Risk pooling and buffer inventory only partially mitigate these shocks.
- Carriers/niche vendors: higher bargaining power in disruptions
- Surcharges/delays: upward pressure on COGS
- Logistics scale helps but does not eliminate shortages
Concentrated suppliers (GPUs >90%, CPUs ~60/40) amplify pricing power
Supplier concentration (Intel ~60%/AMD ~40% server CPUs; NVIDIA >90% datacenter GPUs, 2024) and cyclical DRAM/NAND pricing give suppliers pricing and allocation leverage; Dell FY2024 revenue $101.2B and multi-sourcing mitigate but do not remove risk. EMS utilization >80% (2024) and Windows ~76% desktop share raise switching costs and licensing exposure.
| Metric | 2024 value | Impact |
|---|---|---|
| FY Revenue | $101.2B | Bargaining leverage |
| Datacenter GPUs | >90% | Supplier pricing power |
| EMS utilization | >80% | Lead-time risk |
| Windows share | ~76% | Licensing dependence |
What is included in the product
Detailed Word Document
Tailored Porter's Five Forces analysis of Dell Technologies revealing competitive intensity, buyer and supplier power, threat of new entrants and substitutes, and strategic levers that protect or erode its market position. Highlights disruptive threats, pricing pressures, and entry barriers with actionable insights for investors and strategists.
Customizable Excel Spreadsheet
A compact Dell Technologies Porter's Five Forces one-sheet that instantly reveals competitive pressure and strategic risks for quick decision-making. Customize force levels, swap in your data, and drop the clean spider chart into pitch decks or dashboards for immediate boardroom-ready insight.
Customers Bargaining Power
Large enterprise procurement
Large enterprise procurement secures deep volume discounts and strict SLAs, leveraging concentrated buying power across global accounts. Gartner estimated worldwide IT spending at about 4.9 trillion USD in 2024, amplifying competitive bidding among OEMs and persistent downward price pressure. Dell offsets this through custom configurations and services, yet renewal cycles frequently reset terms aggressively.
Channel partners and resellers
Distributors and VARs shape end-customer choice and margins by demanding rebates, marketing development funds (MDF) and flexible credit terms, forcing Dell to absorb part of channel economics. Dell reported $101.2 billion revenue in FY2024 and leverages partner programs to expand reach but shares revenue and margin with resellers. The availability of strong channel alternatives (other OEM ecosystems and cloud-native suppliers) heightens buyer leverage and pricing pressure.
Commoditized client devices
Desktops and notebooks face feature parity, driving price sensitivity and easy cross-brand comparisons that increase switching; Dell reported fiscal 2024 revenue of $101.2 billion, underscoring scale but thin margins. Dell offsets pressure with fleet management, extended warranties and financing programs. Persistent TCO focus from buyers keeps pricing under sustained pressure.
Multi-sourcing and standardized RFPs
IT buyers increasingly split awards to avoid lock-in and ensure supply, forcing suppliers like Dell—which reported $101.2 billion in FY2024 revenue—to compete across fragmented RFPs; standardized specs enable apples-to-apples comparisons so decisions hinge on service, delivery, and lifecycle value.
- Multi-sourcing pressure
- Standardized RFPs = price transparency
- Win on service & delivery
- Lifecycle value compresses margins on large deals
Shift to as-a-service expectations
Customers increasingly demand opex, elastic and outcome-based contracts, negotiating term flexibility and usage-based pricing; Dell’s APEX and managed services address this shift while buyers use public cloud benchmarks to push terms, elevating ongoing bargaining power—public cloud spend approached $620B in 2024 (Gartner), tightening price/feature comparisons.
- Opex preference
- Usage-based pricing
- Cloud benchmarks raise leverage
Enterprise buyers and cloud parity squeeze vendor margins, driving shift to opex models
Large enterprise buyers and channels exert strong leverage—Gartner 2024 IT spend ~$4.9T and Dell FY2024 revenue $101.2B create concentrated procurement and aggressive price/reset cycles. Feature parity in PCs and cloud benchmarks (public cloud ~$620B in 2024) raise switching and price pressure, pushing buyers toward opex/usage models. Dell mitigates via APEX, services, financing and partner programs but margins remain compressed.
| Metric | 2024 Value |
|---|---|
| Dell revenue (FY) | $101.2B |
| Global IT spend | $4.9T |
| Public cloud spend | $620B |
What You See Is What You Get
Dell Technologies Porter's Five Forces Analysis
This preview shows the exact Dell Technologies Porter's Five Forces Analysis you'll receive immediately after purchase—no surprises, no placeholders. The document displayed is the full, professionally formatted analysis ready for download and immediate use once you buy. You're viewing the actual deliverable; instant access is granted at payment.











