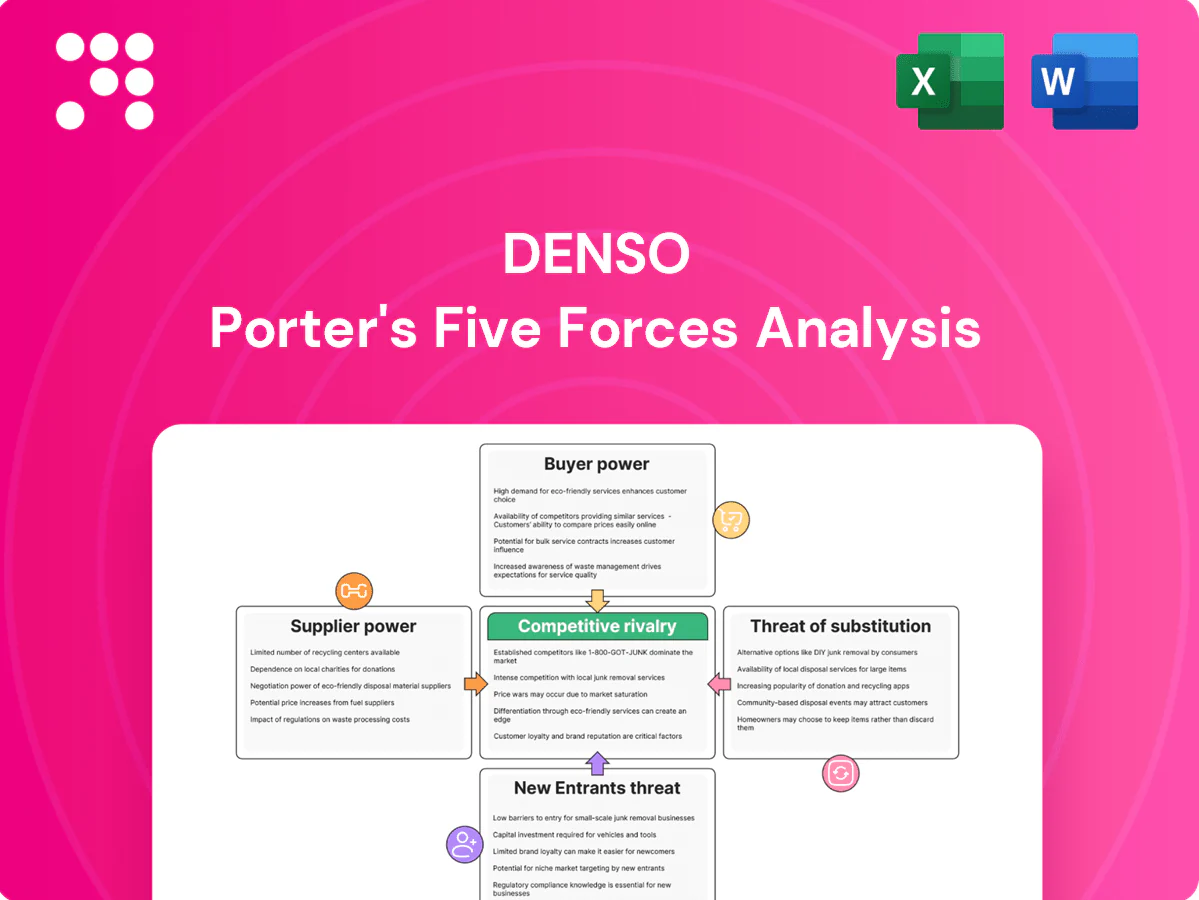
Denso Porter's Five Forces Analysis

Elevate Your Analysis with the Complete Porter's Five Forces Analysis
Denso's Porter's Five Forces assessment highlights intense supplier influence, moderate buyer power, strong rivalry from global OEM suppliers, limited threat of substitutes, and steady barriers to entry driven by scale and technology. This snapshot outlines key pressures shaping Denso’s strategic choices and margin resilience. Unlock the full Porter's Five Forces Analysis to explore force-by-force ratings, visuals, and actionable insights tailored to Denso.
Suppliers Bargaining Power

Critical chips and materials concentration
Automotive-grade semiconductors, rare earth magnets and specialty resins are concentrated among few qualified suppliers, giving suppliers pricing and allocation leverage. Chip lead times exceeded 40 weeks during 2021–22 and suppliers reprioritized volumes, disrupting Tier-1s like Denso. Qualification cycles often take 12–24 months, slowing switching. Concentration raises input-cost volatility and delivery risk; China supplied roughly 80% of refined rare earths in 2024.
Denso scale and dual-sourcing mitigate
Denso’s global scale—about 168,000 employees and operations in roughly 35 countries—plus long-term OEM agreements and deliberate multi-sourcing reduce single-supplier dependency. Supplier development and VA/VE initiatives align cost-down roadmaps, while volume visibility from major OEM programs (part of Denso’s roughly ¥5.6 trillion consolidated sales in FY2023) improves negotiation leverage. Collectively, these factors temper supplier power.

High quality and compliance barriers
Automotive PPAP, IATF 16949 and ISO 26262 safety requirements substantially shrink the pool of eligible Tier-2 suppliers, as lengthy qualification and functional safety evidence are mandatory for new approvals.
High compliance costs and extensive validation testing raise switching barriers, indirectly boosting incumbent supplier power despite Denso’s rigorous supplier audits and corrective programs.
The net effect is a narrower qualified base that sustains elevated supplier leverage over pricing and lead times.

Localized supply chains and geopolitics
Regionalization across Japan, North America and the EU and friend-shoring in 2024 reduce cross-border risk but constrain vendor choice per region; 2024 US-China chip export curbs have further tightened material supply. Denso’s local footprint in about 35 countries with ~170 subsidiaries provides flexibility but faces regional capacity limits, keeping supplier power situational by geography.
- Regional choice limits vendor pool
- 2024 chip/material controls increase supply tightness
- Denso: ~35 countries, ~170 subsidiaries
- Supplier power varies by region and capacity
Strategic partnerships and investments
Strategic equity stakes, JV participation and multi-year (3–5 year) capacity reservations with upstream partners secure priority access and stabilize supply into 2024; co-development of auto-grade semiconductors and power modules deepens integration, locking in cost and yield advantages while creating mutual dependence that gradually reduces supplier bargaining power.
- Equity/JV ties
- 3–5 year capacity reservations
- Co-development of chips/modules
- Lock-in cost/yield benefits
- Mutual dependence lowers supplier clout
Supplier leverage from concentrated chips and rare earths (China ≈80%)
Supplier power is elevated due to concentrated sources for auto semiconductors, rare earths (China ~80% of refined supply in 2024) and long chip lead times (>40 weeks in 2021–22); Denso scale (≈168,000 employees, ≈35 countries, ¥5.6 trillion FY2023) plus JVs, 3–5y capacity reservations and supplier development partially offset leverage.
| Metric | Value |
|---|---|
| Employees | ≈168,000 |
| Countries | ≈35 |
| Sales FY2023 | ¥5.6 trillion |
| Rare earths (China) | ≈80% (2024) |
What is included in the product
 Detailed Word Document
Uncovers competitive drivers, supplier and buyer power, entry barriers, substitutes, and rivalry shaping Denso's market position, with strategic insights on disruptive threats, pricing influence, and defensive advantages.

 Customizable Excel Spreadsheet
Clear Porter's Five Forces for Denso that pinpoints supplier, buyer, rivalry, substitutes and entrant pressures—customizable, slide-ready and designed to remove analysis friction for faster strategic decisions.
Customers Bargaining Power

Highly concentrated OEM base
Global automakers are few, large and professionalized purchasers—Toyota alone sold around 10 million vehicles in 2024—allowing them to exert strong price and contract-term pressure on suppliers like Denso. Annual cost-down expectations of roughly 3–5% are standard in RFQs, while OEMs leverage scale to benchmark across Tier-1s. This concentrated buyer base grants OEMs high negotiating leverage over suppliers.
Switching costs via co-development
Co-engineered systems, deep software integration and lengthy validation testing embed Denso into OEM platforms, making components and firmware bespoke and increasing OEM switching costs. Requalification and retooling often take 12-18 months and can consume a significant share of program timelines, raising timing risk for OEMs. This stickiness offsets buyer power during a vehicle program’s 3-5 year life, though model refresh cycles (~3-4 years) provide rebid opportunities that can reset terms.

Performance, warranty, and quality leverage
Automakers tie awards to PPAP quality, PPM targets (commonly <100 PPM) and warranty performance, enabling chargebacks and givebacks based on scorecards. Scorecard rankings directly influence future sourcing volumes and allocation. Denso must sustain near-zero defects and ≥95% on-time delivery to protect margins, and this scrutiny amplifies buyer influence.

EV transition intensifies price scrutiny
EV transition sharpens OEM price scrutiny: automakers pushing cost parity drive aggressive cost-downs on inverters, thermal systems and e-axles, with design-to-cost and modularization making offerings directly comparable and fueling dual-sourcing; battery pack prices fell to ~120 USD/kWh in 2024 (BNEF), reinforcing short-term buyer leverage.
- OEM cost-parity targets
- Modular designs increase comparability
- Dual-sourcing sustains price pressure
Diversification softens concentration risk
Diversification softens concentration risk: Denso reported consolidated sales of ¥5.37 trillion in FY2023 (year to Mar 2024), with non‑automotive streams such as factory automation and agri‑tech rising to about 8% of revenue in 2024, adding pricing leverage outside OEM channels. Aftermarket and Tier‑2 sales further distribute exposure, and while auto OEMs remain dominant, these adjacent segments modestly reduce overall buyer power.
- Non‑auto share ~8% (2024)
- FY2023 sales ¥5.37 trillion
- Aftermarket/Tier‑2 diversify exposure
Major OEMs demand 3-5% annual cost-downs as 3-5 year rebids meet EV price scrutiny
Global OEMs (Toyota ~10M units 2024) wield strong price/contract leverage, demanding ~3–5% annual cost‑downs and benchmarking across Tier‑1s. Co‑engineering and 12–18 month requalification raise OEM switching costs, though 3–5 year program cycles enable rebids. Quality scorecards (PPM <100, ≥95% OTD) enable chargebacks. EV push and ~USD120/kWh battery costs in 2024 heighten price scrutiny.
| Metric | Value (2024) |
|---|---|
| Toyota sales | ~10M units |
| Denso revenue FY2023 | ¥5.37T |
| Non‑auto share | ~8% |
| Battery price | ~USD120/kWh |
Full Version Awaits
Denso Porter's Five Forces Analysis
This Denso Porter's Five Forces analysis offers a thorough evaluation of competitive rivalry, supplier and buyer power, and the threats of substitutes and new entrants, with actionable insights for strategy and valuation. This preview shows the exact professionally formatted document you'll receive immediately after purchase—no surprises, no placeholders. Once bought you’ll have instant access to this same ready-to-use file.

Elevate Your Analysis with the Complete Porter's Five Forces Analysis
Denso's Porter's Five Forces assessment highlights intense supplier influence, moderate buyer power, strong rivalry from global OEM suppliers, limited threat of substitutes, and steady barriers to entry driven by scale and technology. This snapshot outlines key pressures shaping Denso’s strategic choices and margin resilience. Unlock the full Porter's Five Forces Analysis to explore force-by-force ratings, visuals, and actionable insights tailored to Denso.
Suppliers Bargaining Power
Critical chips and materials concentration
Automotive-grade semiconductors, rare earth magnets and specialty resins are concentrated among few qualified suppliers, giving suppliers pricing and allocation leverage. Chip lead times exceeded 40 weeks during 2021–22 and suppliers reprioritized volumes, disrupting Tier-1s like Denso. Qualification cycles often take 12–24 months, slowing switching. Concentration raises input-cost volatility and delivery risk; China supplied roughly 80% of refined rare earths in 2024.
Denso scale and dual-sourcing mitigate
Denso’s global scale—about 168,000 employees and operations in roughly 35 countries—plus long-term OEM agreements and deliberate multi-sourcing reduce single-supplier dependency. Supplier development and VA/VE initiatives align cost-down roadmaps, while volume visibility from major OEM programs (part of Denso’s roughly ¥5.6 trillion consolidated sales in FY2023) improves negotiation leverage. Collectively, these factors temper supplier power.
High quality and compliance barriers
Automotive PPAP, IATF 16949 and ISO 26262 safety requirements substantially shrink the pool of eligible Tier-2 suppliers, as lengthy qualification and functional safety evidence are mandatory for new approvals.
High compliance costs and extensive validation testing raise switching barriers, indirectly boosting incumbent supplier power despite Denso’s rigorous supplier audits and corrective programs.
The net effect is a narrower qualified base that sustains elevated supplier leverage over pricing and lead times.
Localized supply chains and geopolitics
Regionalization across Japan, North America and the EU and friend-shoring in 2024 reduce cross-border risk but constrain vendor choice per region; 2024 US-China chip export curbs have further tightened material supply. Denso’s local footprint in about 35 countries with ~170 subsidiaries provides flexibility but faces regional capacity limits, keeping supplier power situational by geography.
- Regional choice limits vendor pool
- 2024 chip/material controls increase supply tightness
- Denso: ~35 countries, ~170 subsidiaries
- Supplier power varies by region and capacity
Strategic partnerships and investments
Strategic equity stakes, JV participation and multi-year (3–5 year) capacity reservations with upstream partners secure priority access and stabilize supply into 2024; co-development of auto-grade semiconductors and power modules deepens integration, locking in cost and yield advantages while creating mutual dependence that gradually reduces supplier bargaining power.
- Equity/JV ties
- 3–5 year capacity reservations
- Co-development of chips/modules
- Lock-in cost/yield benefits
- Mutual dependence lowers supplier clout
Supplier leverage from concentrated chips and rare earths (China ≈80%)
Supplier power is elevated due to concentrated sources for auto semiconductors, rare earths (China ~80% of refined supply in 2024) and long chip lead times (>40 weeks in 2021–22); Denso scale (≈168,000 employees, ≈35 countries, ¥5.6 trillion FY2023) plus JVs, 3–5y capacity reservations and supplier development partially offset leverage.
| Metric | Value |
|---|---|
| Employees | ≈168,000 |
| Countries | ≈35 |
| Sales FY2023 | ¥5.6 trillion |
| Rare earths (China) | ≈80% (2024) |
What is included in the product
Detailed Word Document
Uncovers competitive drivers, supplier and buyer power, entry barriers, substitutes, and rivalry shaping Denso's market position, with strategic insights on disruptive threats, pricing influence, and defensive advantages.
Customizable Excel Spreadsheet
Clear Porter's Five Forces for Denso that pinpoints supplier, buyer, rivalry, substitutes and entrant pressures—customizable, slide-ready and designed to remove analysis friction for faster strategic decisions.
Customers Bargaining Power
Highly concentrated OEM base
Global automakers are few, large and professionalized purchasers—Toyota alone sold around 10 million vehicles in 2024—allowing them to exert strong price and contract-term pressure on suppliers like Denso. Annual cost-down expectations of roughly 3–5% are standard in RFQs, while OEMs leverage scale to benchmark across Tier-1s. This concentrated buyer base grants OEMs high negotiating leverage over suppliers.
Switching costs via co-development
Co-engineered systems, deep software integration and lengthy validation testing embed Denso into OEM platforms, making components and firmware bespoke and increasing OEM switching costs. Requalification and retooling often take 12-18 months and can consume a significant share of program timelines, raising timing risk for OEMs. This stickiness offsets buyer power during a vehicle program’s 3-5 year life, though model refresh cycles (~3-4 years) provide rebid opportunities that can reset terms.
Performance, warranty, and quality leverage
Automakers tie awards to PPAP quality, PPM targets (commonly <100 PPM) and warranty performance, enabling chargebacks and givebacks based on scorecards. Scorecard rankings directly influence future sourcing volumes and allocation. Denso must sustain near-zero defects and ≥95% on-time delivery to protect margins, and this scrutiny amplifies buyer influence.
EV transition intensifies price scrutiny
EV transition sharpens OEM price scrutiny: automakers pushing cost parity drive aggressive cost-downs on inverters, thermal systems and e-axles, with design-to-cost and modularization making offerings directly comparable and fueling dual-sourcing; battery pack prices fell to ~120 USD/kWh in 2024 (BNEF), reinforcing short-term buyer leverage.
- OEM cost-parity targets
- Modular designs increase comparability
- Dual-sourcing sustains price pressure
Diversification softens concentration risk
Diversification softens concentration risk: Denso reported consolidated sales of ¥5.37 trillion in FY2023 (year to Mar 2024), with non‑automotive streams such as factory automation and agri‑tech rising to about 8% of revenue in 2024, adding pricing leverage outside OEM channels. Aftermarket and Tier‑2 sales further distribute exposure, and while auto OEMs remain dominant, these adjacent segments modestly reduce overall buyer power.
- Non‑auto share ~8% (2024)
- FY2023 sales ¥5.37 trillion
- Aftermarket/Tier‑2 diversify exposure
Major OEMs demand 3-5% annual cost-downs as 3-5 year rebids meet EV price scrutiny
Global OEMs (Toyota ~10M units 2024) wield strong price/contract leverage, demanding ~3–5% annual cost‑downs and benchmarking across Tier‑1s. Co‑engineering and 12–18 month requalification raise OEM switching costs, though 3–5 year program cycles enable rebids. Quality scorecards (PPM <100, ≥95% OTD) enable chargebacks. EV push and ~USD120/kWh battery costs in 2024 heighten price scrutiny.
| Metric | Value (2024) |
|---|---|
| Toyota sales | ~10M units |
| Denso revenue FY2023 | ¥5.37T |
| Non‑auto share | ~8% |
| Battery price | ~USD120/kWh |
Full Version Awaits
Denso Porter's Five Forces Analysis
This Denso Porter's Five Forces analysis offers a thorough evaluation of competitive rivalry, supplier and buyer power, and the threats of substitutes and new entrants, with actionable insights for strategy and valuation. This preview shows the exact professionally formatted document you'll receive immediately after purchase—no surprises, no placeholders. Once bought you’ll have instant access to this same ready-to-use file.
Original: $10.00
-65%$10.00
$3.50Description
Elevate Your Analysis with the Complete Porter's Five Forces Analysis
Denso's Porter's Five Forces assessment highlights intense supplier influence, moderate buyer power, strong rivalry from global OEM suppliers, limited threat of substitutes, and steady barriers to entry driven by scale and technology. This snapshot outlines key pressures shaping Denso’s strategic choices and margin resilience. Unlock the full Porter's Five Forces Analysis to explore force-by-force ratings, visuals, and actionable insights tailored to Denso.
Suppliers Bargaining Power
Critical chips and materials concentration
Automotive-grade semiconductors, rare earth magnets and specialty resins are concentrated among few qualified suppliers, giving suppliers pricing and allocation leverage. Chip lead times exceeded 40 weeks during 2021–22 and suppliers reprioritized volumes, disrupting Tier-1s like Denso. Qualification cycles often take 12–24 months, slowing switching. Concentration raises input-cost volatility and delivery risk; China supplied roughly 80% of refined rare earths in 2024.
Denso scale and dual-sourcing mitigate
Denso’s global scale—about 168,000 employees and operations in roughly 35 countries—plus long-term OEM agreements and deliberate multi-sourcing reduce single-supplier dependency. Supplier development and VA/VE initiatives align cost-down roadmaps, while volume visibility from major OEM programs (part of Denso’s roughly ¥5.6 trillion consolidated sales in FY2023) improves negotiation leverage. Collectively, these factors temper supplier power.
High quality and compliance barriers
Automotive PPAP, IATF 16949 and ISO 26262 safety requirements substantially shrink the pool of eligible Tier-2 suppliers, as lengthy qualification and functional safety evidence are mandatory for new approvals.
High compliance costs and extensive validation testing raise switching barriers, indirectly boosting incumbent supplier power despite Denso’s rigorous supplier audits and corrective programs.
The net effect is a narrower qualified base that sustains elevated supplier leverage over pricing and lead times.
Localized supply chains and geopolitics
Regionalization across Japan, North America and the EU and friend-shoring in 2024 reduce cross-border risk but constrain vendor choice per region; 2024 US-China chip export curbs have further tightened material supply. Denso’s local footprint in about 35 countries with ~170 subsidiaries provides flexibility but faces regional capacity limits, keeping supplier power situational by geography.
- Regional choice limits vendor pool
- 2024 chip/material controls increase supply tightness
- Denso: ~35 countries, ~170 subsidiaries
- Supplier power varies by region and capacity
Strategic partnerships and investments
Strategic equity stakes, JV participation and multi-year (3–5 year) capacity reservations with upstream partners secure priority access and stabilize supply into 2024; co-development of auto-grade semiconductors and power modules deepens integration, locking in cost and yield advantages while creating mutual dependence that gradually reduces supplier bargaining power.
- Equity/JV ties
- 3–5 year capacity reservations
- Co-development of chips/modules
- Lock-in cost/yield benefits
- Mutual dependence lowers supplier clout
Supplier leverage from concentrated chips and rare earths (China ≈80%)
Supplier power is elevated due to concentrated sources for auto semiconductors, rare earths (China ~80% of refined supply in 2024) and long chip lead times (>40 weeks in 2021–22); Denso scale (≈168,000 employees, ≈35 countries, ¥5.6 trillion FY2023) plus JVs, 3–5y capacity reservations and supplier development partially offset leverage.
| Metric | Value |
|---|---|
| Employees | ≈168,000 |
| Countries | ≈35 |
| Sales FY2023 | ¥5.6 trillion |
| Rare earths (China) | ≈80% (2024) |
What is included in the product
Detailed Word Document
Uncovers competitive drivers, supplier and buyer power, entry barriers, substitutes, and rivalry shaping Denso's market position, with strategic insights on disruptive threats, pricing influence, and defensive advantages.
Customizable Excel Spreadsheet
Clear Porter's Five Forces for Denso that pinpoints supplier, buyer, rivalry, substitutes and entrant pressures—customizable, slide-ready and designed to remove analysis friction for faster strategic decisions.
Customers Bargaining Power
Highly concentrated OEM base
Global automakers are few, large and professionalized purchasers—Toyota alone sold around 10 million vehicles in 2024—allowing them to exert strong price and contract-term pressure on suppliers like Denso. Annual cost-down expectations of roughly 3–5% are standard in RFQs, while OEMs leverage scale to benchmark across Tier-1s. This concentrated buyer base grants OEMs high negotiating leverage over suppliers.
Switching costs via co-development
Co-engineered systems, deep software integration and lengthy validation testing embed Denso into OEM platforms, making components and firmware bespoke and increasing OEM switching costs. Requalification and retooling often take 12-18 months and can consume a significant share of program timelines, raising timing risk for OEMs. This stickiness offsets buyer power during a vehicle program’s 3-5 year life, though model refresh cycles (~3-4 years) provide rebid opportunities that can reset terms.
Performance, warranty, and quality leverage
Automakers tie awards to PPAP quality, PPM targets (commonly <100 PPM) and warranty performance, enabling chargebacks and givebacks based on scorecards. Scorecard rankings directly influence future sourcing volumes and allocation. Denso must sustain near-zero defects and ≥95% on-time delivery to protect margins, and this scrutiny amplifies buyer influence.
EV transition intensifies price scrutiny
EV transition sharpens OEM price scrutiny: automakers pushing cost parity drive aggressive cost-downs on inverters, thermal systems and e-axles, with design-to-cost and modularization making offerings directly comparable and fueling dual-sourcing; battery pack prices fell to ~120 USD/kWh in 2024 (BNEF), reinforcing short-term buyer leverage.
- OEM cost-parity targets
- Modular designs increase comparability
- Dual-sourcing sustains price pressure
Diversification softens concentration risk
Diversification softens concentration risk: Denso reported consolidated sales of ¥5.37 trillion in FY2023 (year to Mar 2024), with non‑automotive streams such as factory automation and agri‑tech rising to about 8% of revenue in 2024, adding pricing leverage outside OEM channels. Aftermarket and Tier‑2 sales further distribute exposure, and while auto OEMs remain dominant, these adjacent segments modestly reduce overall buyer power.
- Non‑auto share ~8% (2024)
- FY2023 sales ¥5.37 trillion
- Aftermarket/Tier‑2 diversify exposure
Major OEMs demand 3-5% annual cost-downs as 3-5 year rebids meet EV price scrutiny
Global OEMs (Toyota ~10M units 2024) wield strong price/contract leverage, demanding ~3–5% annual cost‑downs and benchmarking across Tier‑1s. Co‑engineering and 12–18 month requalification raise OEM switching costs, though 3–5 year program cycles enable rebids. Quality scorecards (PPM <100, ≥95% OTD) enable chargebacks. EV push and ~USD120/kWh battery costs in 2024 heighten price scrutiny.
| Metric | Value (2024) |
|---|---|
| Toyota sales | ~10M units |
| Denso revenue FY2023 | ¥5.37T |
| Non‑auto share | ~8% |
| Battery price | ~USD120/kWh |
Full Version Awaits
Denso Porter's Five Forces Analysis
This Denso Porter's Five Forces analysis offers a thorough evaluation of competitive rivalry, supplier and buyer power, and the threats of substitutes and new entrants, with actionable insights for strategy and valuation. This preview shows the exact professionally formatted document you'll receive immediately after purchase—no surprises, no placeholders. Once bought you’ll have instant access to this same ready-to-use file.











