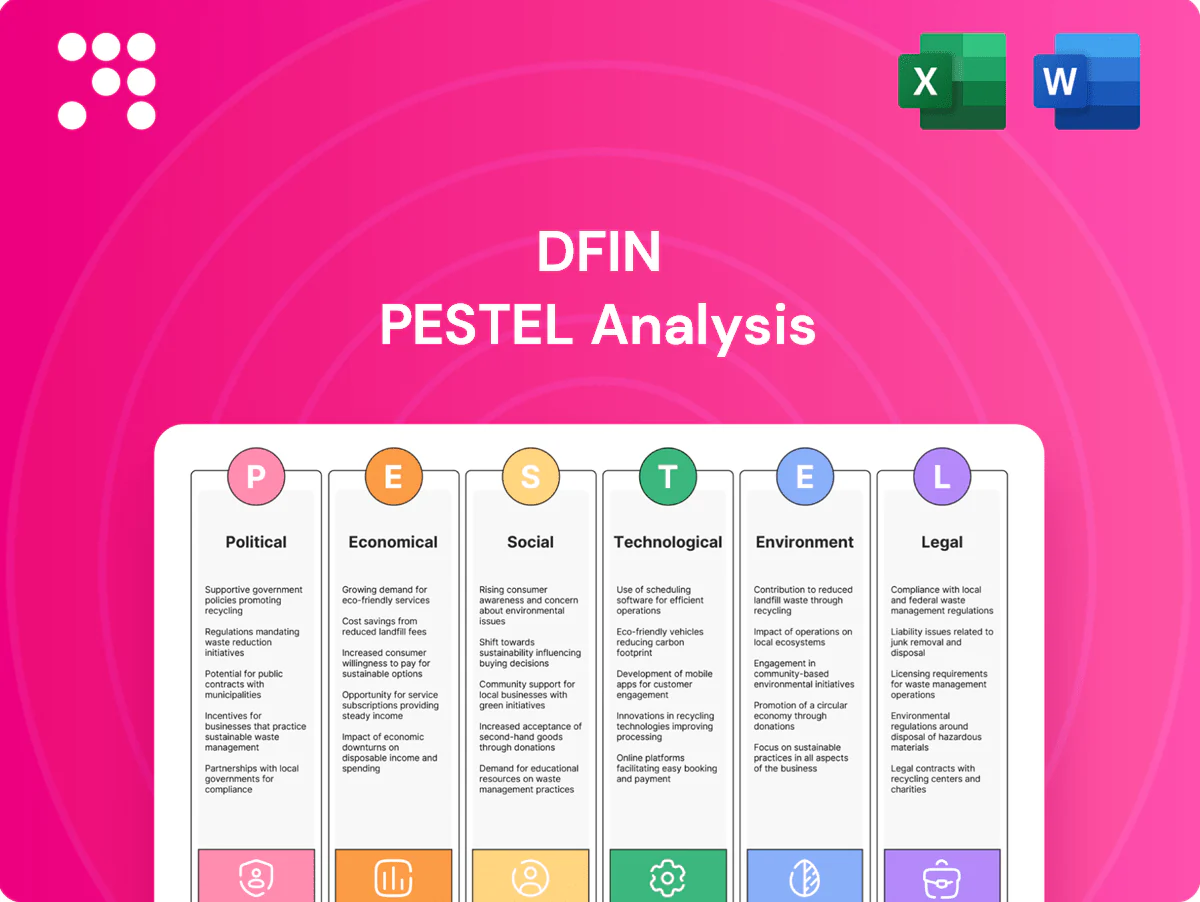
DFIN PESTLE Analysis

Your Competitive Advantage Starts with This Report
Discover how political shifts, economic cycles, and tech disruption shape DFIN’s strategic outlook in our concise PESTLE snapshot—designed for investors and strategists who need actionable context fast. This expert analysis highlights regulatory risks, market drivers, and emerging opportunities specific to DFIN. Purchase the full PESTLE to get the complete, editable briefing and make data-driven decisions with confidence.
Political factors

Regulatory policy shifts in key markets
DFIN’s demand tracks rulemaking by the SEC, ESMA, FCA and other authorities; EU’s CSRD expansion will cover roughly 50,000 companies, driving reporting upgrades. New SEC and ESMA disclosure mandates and taxonomy updates in 2024–25 can spur software and advisory spend, while deregulatory moves could slow growth. Ongoing supervisory scrutiny keeps baseline compliance services stable.
Geopolitics and data localization pressures
Heightened geopolitical tensions have pushed over 70 countries by 2024 to enact or propose data localization and sovereignty rules, forcing clients to demand in-region hosting and segregated environments. For DFIN this complicates delivery models, raises compliance and infrastructure costs, and fragments product roadmaps. Higher per-market engineering spend can compress margins but also creates local market opportunities for tailored compliance offerings.

Government digitization and e-filing mandates
Public-sector pushes toward digital reporting increase reliance on RegTech, with global RegTech spending exceeding $10 billion in 2024 and accelerating adoption across jurisdictions. Standardized e-filing portals and digital identities in 70+ countries expand DFIN’s addressable market. Compatibility with government schemas is critical for seamless integration. Early alignment can secure vendor preference lists and long-term contracts.

Public procurement and lobbying dynamics
Winning government or quasi-public compliance contracts requires navigating complex procurement rules; transparent pricing and certifiable security controls are often mandatory. Policy advocacy by vendors can influence standards and timelines, as seen in 2023–24 XBRL and ESG filing guidance updates. Public procurement represents about 12% of global GDP, highlighting strategic value.
- Navigate procurement rules
- Transparent pricing & security assurances
- Policy advocacy shapes standards/timelines
- Strong industry representation guides implementation
Trade restrictions and vendor-of-record rules
- Impact: August 2023 US semiconductor export controls
- Procurement: GSA >10,000 vendors
- Priority: supply-chain verification
- Action: rapid compliance updates
Regulatory mandates and data-localization boost RegTech demand and public-sector sales
Regulatory updates (SEC, ESMA, CSRD covering ~50,000 firms) and 2024–25 disclosure mandates drive demand for disclosure software; RegTech spend topped $10bn in 2024. Data-localization rules in 70+ countries raise hosting/compliance costs; public procurement (~12% of GDP) creates strategic sales channels.
| Factor | 2024–25 Metric | Impact |
|---|---|---|
| CSRD | ~50,000 firms | Reporting upgrades |
| RegTech spend | >$10bn | Market growth |
| Data localization | 70+ countries | Higher infra costs |
| Public procurement | ~12% GDP | Contract value |
What is included in the product
 Detailed Word Document
Explores how macro-environmental factors uniquely affect DFIN across Political, Economic, Social, Technological, Environmental and Legal dimensions, with each section backed by data and current trends. Designed for executives and investors, it offers forward-looking insights, regional/regulatory relevance, and ready-to-use formatting for plans and decks.

 Customizable Excel Spreadsheet
A concise, visually segmented DFIN PESTLE summary that can be dropped into presentations, edited with context-specific notes, and quickly shared across teams to streamline external risk discussions and strategic planning.
Economic factors

Capital markets activity cycles
IPO, debt issuance and M&A volumes directly drive filing and deal-related services; global IPO activity remained subdued through 2024 (total proceeds below $100 billion) while M&A and debt markets showed uneven recovery into early 2025. Downcycles compress transactional revenue, sometimes cutting deal-driven intake by double digits, while upcycles create surge demand. Diversifying into recurring SaaS revenue smooths volatility. Flexible capacity planning and on-demand resourcing mitigate peaks and troughs.
Interest rates and credit conditions
Higher rate paths — US federal funds 5.25–5.50% as of mid‑2025 — raise refinancing costs, complicate structured products and disclosure timelines; rising rates increase legal and reporting complexity. Tight credit compresses deal flow while boosting restructuring mandates. Clients scrutinize vendor cost during stress; documented ROI and retention case studies become key value proof points.

Currency fluctuations on global revenues
DFIN’s international exposure creates FX translation risk that can swing reported revenues; in FY2024 DFIN reported roughly $1.0B in revenue, amplifying the impact of currency moves on consolidated results. Pricing and active hedging strategies can stabilize margins and protect EBITDA. Localized pricing is often necessary in volatile FX markets to preserve market share. Clear, published FX policies and hedging disclosures reassure investors and reduce perceived risk.

Cost inflation in talent and cloud
Wage inflation for compliance, security, and AI talent is squeezing margins—AI specialist pay rose ~20% in 2024 while compliance/security roles increased ~8% year-over-year. Cloud infrastructure and security tooling costs expanded ~25–30% YoY in 2024, with cloud waste averaging ~32% of spend (Flexera 2024). Productivity automation can cut FTE needs 10–20%, and multi-year vendor commitments/RI/CU savings often deliver 20–30%+ unit-cost improvement.
- Wage inflation: AI +20% (2024)
- Security/compliance pay: +8% (2024)
- Cloud cost growth: 25–30% YoY; cloud waste ~32%
- Automation offset: FTE reduction 10–20%
- Vendor negotiation: 20–30%+ savings
Enterprise budget cycles and ROI scrutiny
Enterprise procurement cycles commonly run 3–9 months (Gartner 2024), with heightened CFO oversight extending sales cycles and demanding clear time-to-value, often within 12 months; buyers insist on measurable risk reduction. Modular land-and-expand SaaS fits phased budgets and lowers entry costs. Strong KPIs underpin renewals; top SaaS firms reported median net retention around 110% in 2024.
- Procurement: 3–9 months
- ROI expectation: ~12 months
- Net retention: ~110% (2024)
Regulatory mandates and data-localization boost RegTech demand and public-sector sales
Transaction volumes drive filing services; IPOs remained subdued through 2024 (<$100B) while M&A/debt recovered unevenly into 2025, so cyclical revenue swings persist. Higher rates (US funds 5.25–5.50% mid‑2025) and tight credit raise refinancing and restructuring work and pressure vendor ROI scrutiny. Wage and cloud inflation (AI pay +20% 2024; cloud costs +25–30%, waste ~32%) compress margins; automation and hedging offset risk.
| Metric | Value/Source |
|---|---|
| DFIN rev FY2024 | $1.0B |
| US funds rate mid‑2025 | 5.25–5.50% |
| IPO proceeds 2024 | <$100B |
| AI pay inflation 2024 | +20% |
| Cloud cost growth 2024 | 25–30%; waste ~32% |
| Procurement cycle | 3–9 months (Gartner 2024) |
| Median SaaS net retention 2024 | ~110% |
Same Document Delivered
DFIN PESTLE Analysis
The preview shown here is the exact DFIN PESTLE Analysis document you’ll receive after purchase—fully formatted, professionally structured, and ready to use. The content, layout, and insights visible in the preview are identical to the downloadable file delivered after checkout. No placeholders, no surprises—this is the real, finished file you’ll own.

Your Competitive Advantage Starts with This Report
Discover how political shifts, economic cycles, and tech disruption shape DFIN’s strategic outlook in our concise PESTLE snapshot—designed for investors and strategists who need actionable context fast. This expert analysis highlights regulatory risks, market drivers, and emerging opportunities specific to DFIN. Purchase the full PESTLE to get the complete, editable briefing and make data-driven decisions with confidence.
Political factors
Regulatory policy shifts in key markets
DFIN’s demand tracks rulemaking by the SEC, ESMA, FCA and other authorities; EU’s CSRD expansion will cover roughly 50,000 companies, driving reporting upgrades. New SEC and ESMA disclosure mandates and taxonomy updates in 2024–25 can spur software and advisory spend, while deregulatory moves could slow growth. Ongoing supervisory scrutiny keeps baseline compliance services stable.
Geopolitics and data localization pressures
Heightened geopolitical tensions have pushed over 70 countries by 2024 to enact or propose data localization and sovereignty rules, forcing clients to demand in-region hosting and segregated environments. For DFIN this complicates delivery models, raises compliance and infrastructure costs, and fragments product roadmaps. Higher per-market engineering spend can compress margins but also creates local market opportunities for tailored compliance offerings.
Government digitization and e-filing mandates
Public-sector pushes toward digital reporting increase reliance on RegTech, with global RegTech spending exceeding $10 billion in 2024 and accelerating adoption across jurisdictions. Standardized e-filing portals and digital identities in 70+ countries expand DFIN’s addressable market. Compatibility with government schemas is critical for seamless integration. Early alignment can secure vendor preference lists and long-term contracts.
Public procurement and lobbying dynamics
Winning government or quasi-public compliance contracts requires navigating complex procurement rules; transparent pricing and certifiable security controls are often mandatory. Policy advocacy by vendors can influence standards and timelines, as seen in 2023–24 XBRL and ESG filing guidance updates. Public procurement represents about 12% of global GDP, highlighting strategic value.
- Navigate procurement rules
- Transparent pricing & security assurances
- Policy advocacy shapes standards/timelines
- Strong industry representation guides implementation
Trade restrictions and vendor-of-record rules
- Impact: August 2023 US semiconductor export controls
- Procurement: GSA >10,000 vendors
- Priority: supply-chain verification
- Action: rapid compliance updates
Regulatory mandates and data-localization boost RegTech demand and public-sector sales
Regulatory updates (SEC, ESMA, CSRD covering ~50,000 firms) and 2024–25 disclosure mandates drive demand for disclosure software; RegTech spend topped $10bn in 2024. Data-localization rules in 70+ countries raise hosting/compliance costs; public procurement (~12% of GDP) creates strategic sales channels.
| Factor | 2024–25 Metric | Impact |
|---|---|---|
| CSRD | ~50,000 firms | Reporting upgrades |
| RegTech spend | >$10bn | Market growth |
| Data localization | 70+ countries | Higher infra costs |
| Public procurement | ~12% GDP | Contract value |
What is included in the product
Detailed Word Document
Explores how macro-environmental factors uniquely affect DFIN across Political, Economic, Social, Technological, Environmental and Legal dimensions, with each section backed by data and current trends. Designed for executives and investors, it offers forward-looking insights, regional/regulatory relevance, and ready-to-use formatting for plans and decks.
Customizable Excel Spreadsheet
A concise, visually segmented DFIN PESTLE summary that can be dropped into presentations, edited with context-specific notes, and quickly shared across teams to streamline external risk discussions and strategic planning.
Economic factors
Capital markets activity cycles
IPO, debt issuance and M&A volumes directly drive filing and deal-related services; global IPO activity remained subdued through 2024 (total proceeds below $100 billion) while M&A and debt markets showed uneven recovery into early 2025. Downcycles compress transactional revenue, sometimes cutting deal-driven intake by double digits, while upcycles create surge demand. Diversifying into recurring SaaS revenue smooths volatility. Flexible capacity planning and on-demand resourcing mitigate peaks and troughs.
Interest rates and credit conditions
Higher rate paths — US federal funds 5.25–5.50% as of mid‑2025 — raise refinancing costs, complicate structured products and disclosure timelines; rising rates increase legal and reporting complexity. Tight credit compresses deal flow while boosting restructuring mandates. Clients scrutinize vendor cost during stress; documented ROI and retention case studies become key value proof points.
Currency fluctuations on global revenues
DFIN’s international exposure creates FX translation risk that can swing reported revenues; in FY2024 DFIN reported roughly $1.0B in revenue, amplifying the impact of currency moves on consolidated results. Pricing and active hedging strategies can stabilize margins and protect EBITDA. Localized pricing is often necessary in volatile FX markets to preserve market share. Clear, published FX policies and hedging disclosures reassure investors and reduce perceived risk.
Cost inflation in talent and cloud
Wage inflation for compliance, security, and AI talent is squeezing margins—AI specialist pay rose ~20% in 2024 while compliance/security roles increased ~8% year-over-year. Cloud infrastructure and security tooling costs expanded ~25–30% YoY in 2024, with cloud waste averaging ~32% of spend (Flexera 2024). Productivity automation can cut FTE needs 10–20%, and multi-year vendor commitments/RI/CU savings often deliver 20–30%+ unit-cost improvement.
- Wage inflation: AI +20% (2024)
- Security/compliance pay: +8% (2024)
- Cloud cost growth: 25–30% YoY; cloud waste ~32%
- Automation offset: FTE reduction 10–20%
- Vendor negotiation: 20–30%+ savings
Enterprise budget cycles and ROI scrutiny
Enterprise procurement cycles commonly run 3–9 months (Gartner 2024), with heightened CFO oversight extending sales cycles and demanding clear time-to-value, often within 12 months; buyers insist on measurable risk reduction. Modular land-and-expand SaaS fits phased budgets and lowers entry costs. Strong KPIs underpin renewals; top SaaS firms reported median net retention around 110% in 2024.
- Procurement: 3–9 months
- ROI expectation: ~12 months
- Net retention: ~110% (2024)
Regulatory mandates and data-localization boost RegTech demand and public-sector sales
Transaction volumes drive filing services; IPOs remained subdued through 2024 (<$100B) while M&A/debt recovered unevenly into 2025, so cyclical revenue swings persist. Higher rates (US funds 5.25–5.50% mid‑2025) and tight credit raise refinancing and restructuring work and pressure vendor ROI scrutiny. Wage and cloud inflation (AI pay +20% 2024; cloud costs +25–30%, waste ~32%) compress margins; automation and hedging offset risk.
| Metric | Value/Source |
|---|---|
| DFIN rev FY2024 | $1.0B |
| US funds rate mid‑2025 | 5.25–5.50% |
| IPO proceeds 2024 | <$100B |
| AI pay inflation 2024 | +20% |
| Cloud cost growth 2024 | 25–30%; waste ~32% |
| Procurement cycle | 3–9 months (Gartner 2024) |
| Median SaaS net retention 2024 | ~110% |
Same Document Delivered
DFIN PESTLE Analysis
The preview shown here is the exact DFIN PESTLE Analysis document you’ll receive after purchase—fully formatted, professionally structured, and ready to use. The content, layout, and insights visible in the preview are identical to the downloadable file delivered after checkout. No placeholders, no surprises—this is the real, finished file you’ll own.
Description
Your Competitive Advantage Starts with This Report
Discover how political shifts, economic cycles, and tech disruption shape DFIN’s strategic outlook in our concise PESTLE snapshot—designed for investors and strategists who need actionable context fast. This expert analysis highlights regulatory risks, market drivers, and emerging opportunities specific to DFIN. Purchase the full PESTLE to get the complete, editable briefing and make data-driven decisions with confidence.
Political factors
Regulatory policy shifts in key markets
DFIN’s demand tracks rulemaking by the SEC, ESMA, FCA and other authorities; EU’s CSRD expansion will cover roughly 50,000 companies, driving reporting upgrades. New SEC and ESMA disclosure mandates and taxonomy updates in 2024–25 can spur software and advisory spend, while deregulatory moves could slow growth. Ongoing supervisory scrutiny keeps baseline compliance services stable.
Geopolitics and data localization pressures
Heightened geopolitical tensions have pushed over 70 countries by 2024 to enact or propose data localization and sovereignty rules, forcing clients to demand in-region hosting and segregated environments. For DFIN this complicates delivery models, raises compliance and infrastructure costs, and fragments product roadmaps. Higher per-market engineering spend can compress margins but also creates local market opportunities for tailored compliance offerings.
Government digitization and e-filing mandates
Public-sector pushes toward digital reporting increase reliance on RegTech, with global RegTech spending exceeding $10 billion in 2024 and accelerating adoption across jurisdictions. Standardized e-filing portals and digital identities in 70+ countries expand DFIN’s addressable market. Compatibility with government schemas is critical for seamless integration. Early alignment can secure vendor preference lists and long-term contracts.
Public procurement and lobbying dynamics
Winning government or quasi-public compliance contracts requires navigating complex procurement rules; transparent pricing and certifiable security controls are often mandatory. Policy advocacy by vendors can influence standards and timelines, as seen in 2023–24 XBRL and ESG filing guidance updates. Public procurement represents about 12% of global GDP, highlighting strategic value.
- Navigate procurement rules
- Transparent pricing & security assurances
- Policy advocacy shapes standards/timelines
- Strong industry representation guides implementation
Trade restrictions and vendor-of-record rules
- Impact: August 2023 US semiconductor export controls
- Procurement: GSA >10,000 vendors
- Priority: supply-chain verification
- Action: rapid compliance updates
Regulatory mandates and data-localization boost RegTech demand and public-sector sales
Regulatory updates (SEC, ESMA, CSRD covering ~50,000 firms) and 2024–25 disclosure mandates drive demand for disclosure software; RegTech spend topped $10bn in 2024. Data-localization rules in 70+ countries raise hosting/compliance costs; public procurement (~12% of GDP) creates strategic sales channels.
| Factor | 2024–25 Metric | Impact |
|---|---|---|
| CSRD | ~50,000 firms | Reporting upgrades |
| RegTech spend | >$10bn | Market growth |
| Data localization | 70+ countries | Higher infra costs |
| Public procurement | ~12% GDP | Contract value |
What is included in the product
Detailed Word Document
Explores how macro-environmental factors uniquely affect DFIN across Political, Economic, Social, Technological, Environmental and Legal dimensions, with each section backed by data and current trends. Designed for executives and investors, it offers forward-looking insights, regional/regulatory relevance, and ready-to-use formatting for plans and decks.
Customizable Excel Spreadsheet
A concise, visually segmented DFIN PESTLE summary that can be dropped into presentations, edited with context-specific notes, and quickly shared across teams to streamline external risk discussions and strategic planning.
Economic factors
Capital markets activity cycles
IPO, debt issuance and M&A volumes directly drive filing and deal-related services; global IPO activity remained subdued through 2024 (total proceeds below $100 billion) while M&A and debt markets showed uneven recovery into early 2025. Downcycles compress transactional revenue, sometimes cutting deal-driven intake by double digits, while upcycles create surge demand. Diversifying into recurring SaaS revenue smooths volatility. Flexible capacity planning and on-demand resourcing mitigate peaks and troughs.
Interest rates and credit conditions
Higher rate paths — US federal funds 5.25–5.50% as of mid‑2025 — raise refinancing costs, complicate structured products and disclosure timelines; rising rates increase legal and reporting complexity. Tight credit compresses deal flow while boosting restructuring mandates. Clients scrutinize vendor cost during stress; documented ROI and retention case studies become key value proof points.
Currency fluctuations on global revenues
DFIN’s international exposure creates FX translation risk that can swing reported revenues; in FY2024 DFIN reported roughly $1.0B in revenue, amplifying the impact of currency moves on consolidated results. Pricing and active hedging strategies can stabilize margins and protect EBITDA. Localized pricing is often necessary in volatile FX markets to preserve market share. Clear, published FX policies and hedging disclosures reassure investors and reduce perceived risk.
Cost inflation in talent and cloud
Wage inflation for compliance, security, and AI talent is squeezing margins—AI specialist pay rose ~20% in 2024 while compliance/security roles increased ~8% year-over-year. Cloud infrastructure and security tooling costs expanded ~25–30% YoY in 2024, with cloud waste averaging ~32% of spend (Flexera 2024). Productivity automation can cut FTE needs 10–20%, and multi-year vendor commitments/RI/CU savings often deliver 20–30%+ unit-cost improvement.
- Wage inflation: AI +20% (2024)
- Security/compliance pay: +8% (2024)
- Cloud cost growth: 25–30% YoY; cloud waste ~32%
- Automation offset: FTE reduction 10–20%
- Vendor negotiation: 20–30%+ savings
Enterprise budget cycles and ROI scrutiny
Enterprise procurement cycles commonly run 3–9 months (Gartner 2024), with heightened CFO oversight extending sales cycles and demanding clear time-to-value, often within 12 months; buyers insist on measurable risk reduction. Modular land-and-expand SaaS fits phased budgets and lowers entry costs. Strong KPIs underpin renewals; top SaaS firms reported median net retention around 110% in 2024.
- Procurement: 3–9 months
- ROI expectation: ~12 months
- Net retention: ~110% (2024)
Regulatory mandates and data-localization boost RegTech demand and public-sector sales
Transaction volumes drive filing services; IPOs remained subdued through 2024 (<$100B) while M&A/debt recovered unevenly into 2025, so cyclical revenue swings persist. Higher rates (US funds 5.25–5.50% mid‑2025) and tight credit raise refinancing and restructuring work and pressure vendor ROI scrutiny. Wage and cloud inflation (AI pay +20% 2024; cloud costs +25–30%, waste ~32%) compress margins; automation and hedging offset risk.
| Metric | Value/Source |
|---|---|
| DFIN rev FY2024 | $1.0B |
| US funds rate mid‑2025 | 5.25–5.50% |
| IPO proceeds 2024 | <$100B |
| AI pay inflation 2024 | +20% |
| Cloud cost growth 2024 | 25–30%; waste ~32% |
| Procurement cycle | 3–9 months (Gartner 2024) |
| Median SaaS net retention 2024 | ~110% |
Same Document Delivered
DFIN PESTLE Analysis
The preview shown here is the exact DFIN PESTLE Analysis document you’ll receive after purchase—fully formatted, professionally structured, and ready to use. The content, layout, and insights visible in the preview are identical to the downloadable file delivered after checkout. No placeholders, no surprises—this is the real, finished file you’ll own.











